


 Arguments


2022’s supercharged summer of climate extremes: How global warming and La Niña fueled disasters on top of disasters
Posted on 19 September 2022 by Guest Author
This article by Kevin Trenberth, Distinguished Scholar, NCAR; Affiliated Faculty, University of Auckland, is republished from The Conversation under a Creative Commons license. Read the original article.
There’s an old joke about the fellow who has his left foot in a bucket of ice water and the right in a bucket of hot water, so that his overall temperature is average. That seemed to apply to the climate during 2022’s northern summer of extremes.
Global warming is undoubtedly a factor, but just how the increasing extremes – heat waves, droughts and floods, sometimes one on top of the other – are related can be bewildering to the public and policymakers.
As a climate scientist, I’ve been working on these issues for more than four decades, and my new book, “The changing flow of energy through the climate system,” details the causes, feedbacks and impacts. Let’s take a closer look at how climate change and natural weather patterns like La Niña influence what we’re seeing around the world today.
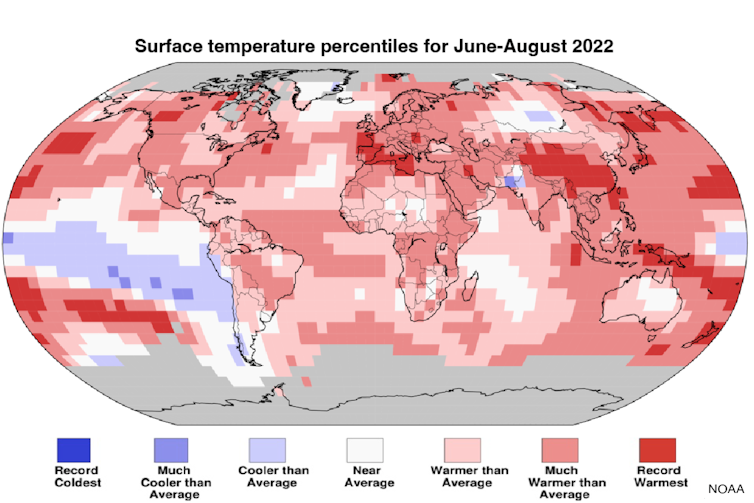 The June-August 2022 global land and ocean surface temperature was 1.6 degrees Fahrenheit (0.89 Celsius) above the 20th-century average of 60.1 F (15.6 C). It tied with 2015 and 2017 as the fifth-warmest in the 143-year temperature record. NOAA
The Northern Hemisphere’s extreme summer
Summer 2022 has indeed seemed to feature one climate-related disaster after another.
Record-breaking heat waves baked India and Pakistan, then monsoon flooding left about a third of Pakistan under water, affecting an estimated 33 million people. Temperatures exceeded 104 degrees Fahrenheit (40 Celsius) for prolonged periods in many places, and even broke 122 F (50 C) in Jacobabad, Pakistan, in May.
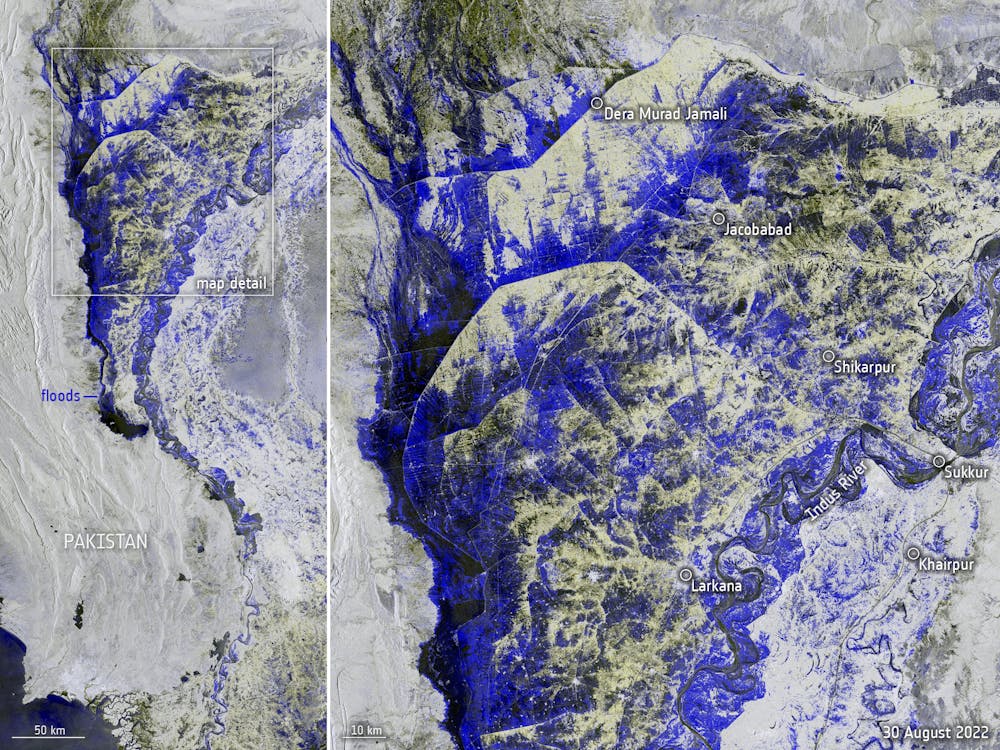 A satellite image of one part of Pakistan shows how flooding turned rivers into lakes several miles wide. European Space Agency
The Asian heat helped to melt some glaciers in the Himalayas, elevating rivers. At the same time, three times the normal annual rain fell in Pakistan during the weekslong monsoon. More than 1,500 people died in the flooding, an estimated 1.8 million homes were damaged or destroyed, and hundreds of thousands of livestock were lost. Food for the coming seasons will be in short supply.
Extreme heat in Europe led to wildfires, especially in Spain and Portugal. The drought in Spain dried up a reservoir, revealing the long-submerged “Spanish Stonehenge,” an ancient circle of megalithic stones believed to date back to around 5000 B.C. Electricity generation in France plummeted, with low rivers reducing the ability to cool nuclear power towers, and German barges had difficulty finding enough water to navigate the Rhine River.
 Residents fought wildfires in Spain in July 2022 that spread through dry fields and forests. AP Photo/Bernat Armangue
In the United States, the West and the Midwest suffered through intense heat waves, and the crucial Colorado River reservoirs Lake Powell and Lake Mead hit record lows, triggering water restrictions. Yet, the country also saw major disruptive flooding in several cities and regions, from Death Valley to the mountains of eastern Kentucky.
In China, heat waves and drought stretched over eight weeks and dried up parts of the Yangtze River to the lowest level since at least 1865 – until parts of the same area were inundated with flooding rains in August.
Climate change exacerbates the extremes
Yes, these are all manifestations of climate change brought about by human activities.
Climate change for the most part does not directly cause the rainfall or drought, but it makes these naturally occurring events more intense or severe. Carbon dioxide and other greenhouse gases, largely from power plants, vehicles, buildings, industry and agriculture, trap heat in the atmosphere, heating the planet.
In addition to raising temperature, global warming increases evaporation of surface waters into the atmosphere, drying areas that have had little rain. Warmer air increases the amount of water vapor the atmosphere can hold, and the thirstier atmosphere sucks moisture from the surface.
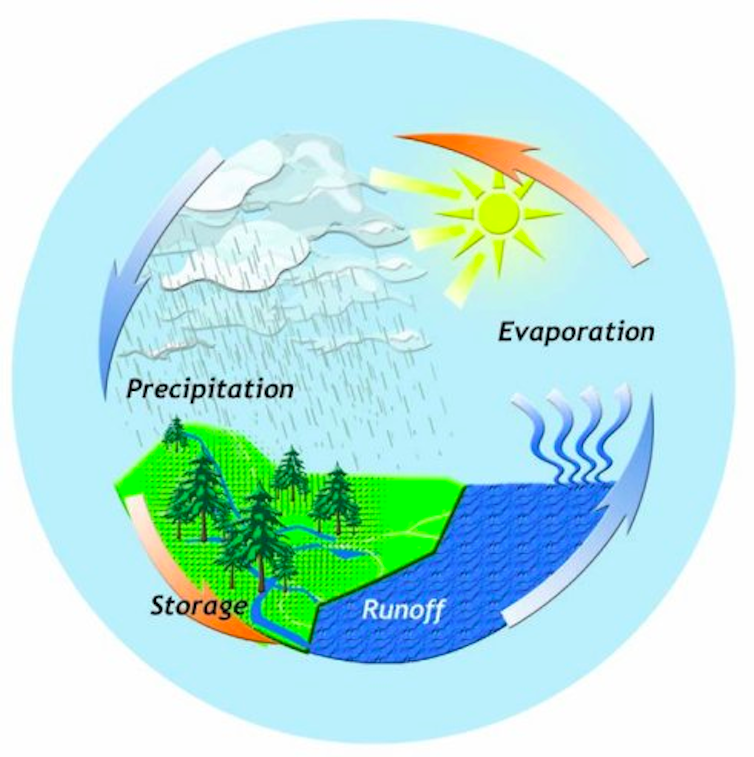 Key elements of the water cycle. Global Energy and Water Exchanges
That extra moisture is carried away by winds and eventually flows into storms, often a thousand miles distant, that rain harder. Atmospheric moisture has increased by 5% to 20% in general compared with the pre-1970s. The increase in water vapor, a greenhouse gas, further amplifies warming. When water evaporates, it absorbs heat, and when it later falls as rain, that heat is released back into the atmosphere. This extra energy fuels storms, leading to more intense systems that may also be bigger and last longer, with up to 30% more rain as a consequence of warming.
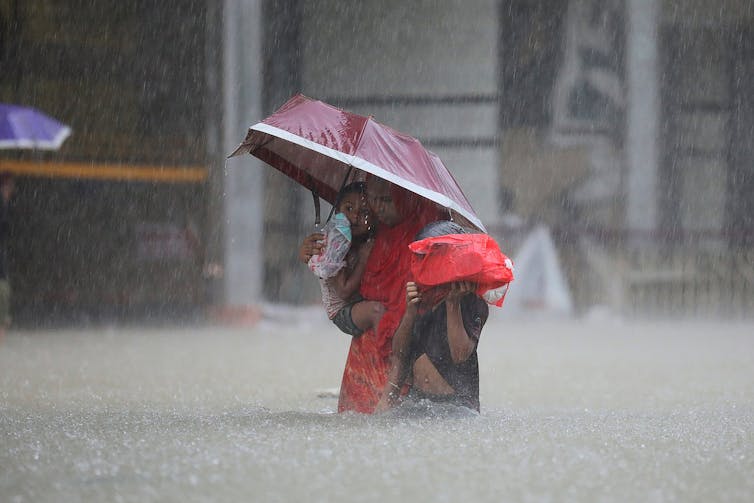 A warming climate can lead to more extreme downpours, as Bangladesh and India experienced in 2022. AFP via Getty Images
On average, precipitation falls on only about 8% of the land globally at any time. It is the intermittency of precipitation that leads to the exaggerated extremes, resulting in localized heavy rains and widespread dry spells.
So, with the accelerated water cycle, wet areas get wetter, and dry areas get drier, while over the oceans, this results in salty waters becoming saltier and fresh waters becoming fresher.
Infrastructure isn’t ready for the consequences
The impact of these events and whether they turn into disasters depend in part on how prepared communities are for the changes. Most infrastructure, forests and farms are adapted to a previous climate.
Whether heavy rains result in flooding depends critically on drainage systems and surface water management.
When populations grow, as Pakistan’s has, more people become vulnerable when they settle in flood plains. It takes time for surface waters to evaporate, and flood water runoff is affected by rising sea levels that slow and may even reverse stream and river flows to the ocean.
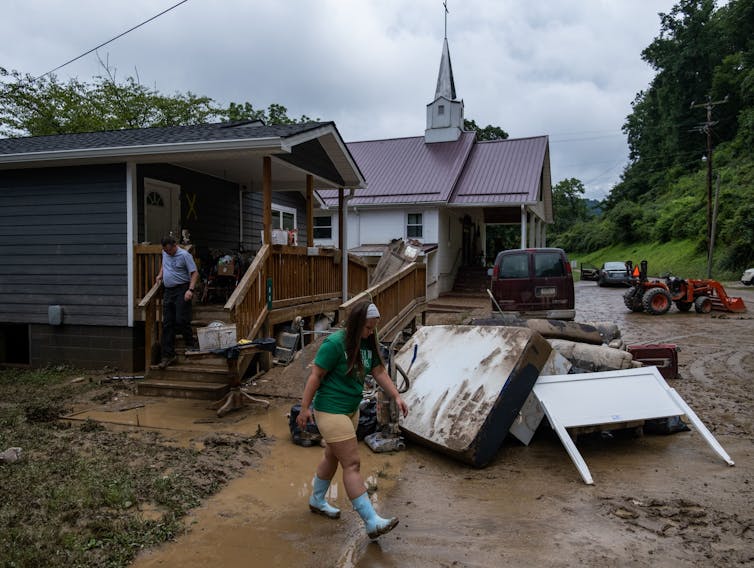 Flash flooding swept through mountain valleys in eastern Kentucky in July 2022, killing more than three dozen people. It was one of several destructive flash floods in the U.S. Seth Herald/AFP via Getty Images
Natural variability also plays a major role
While the observed increases in extremes are a consequence of climate change, the weather events themselves are still largely naturally occurring.
Two naturally reoccurring weather patterns are important to understand: La Niña and El Niño – the two opposite phases of the El Niño-Southern Oscillation.
In 2022, we are likely headed into a third year of a La Niña event, in which cool waters dominate the central and eastern tropical Pacific. The pattern affects atmospheric circulation, keeping the main rains over southern Asia and the Indonesian region, and with associated record-breaking marine heat waves in the North and South Pacific. In North America, it typically means the southern half of the U.S. is drier than normal.
 Surface temperatures increased over most of the planet from 1979 to 2021, with parts of the Arctic rising as much as 5 F (3 C). Courtesy of Dennis Hartmann
In the Southern Hemisphere, that marine heat wave over the South Pacific led to the warmest and wettest meteorological winter (June-August) on record in New Zealand, with several major floods. Rain was 141% of “normal,” and nationwide temperatures averaged 2.5 F (1.4 C) above the 1981-2010 average. The exceptionally high sea surface temperatures not only contributed to warmer temperatures on land, but also fed atmospheric rivers and provided extra moisture to onshore winds and storms.
The La Niña cooling in the tropical Pacific can readily reverse, with an El Niño pattern effectively pumping heat out of the ocean and into the atmosphere. A preliminary analysis colleagues and I conducted suggests that the global ocean heat content is at record-high levels. Exceptionally warm deep waters in the tropical western Pacific right now suggest prospects for the next El Niño event in 2023, potentially resulting in more global temperature records in 2024 as some ocean heat returns to the atmosphere.
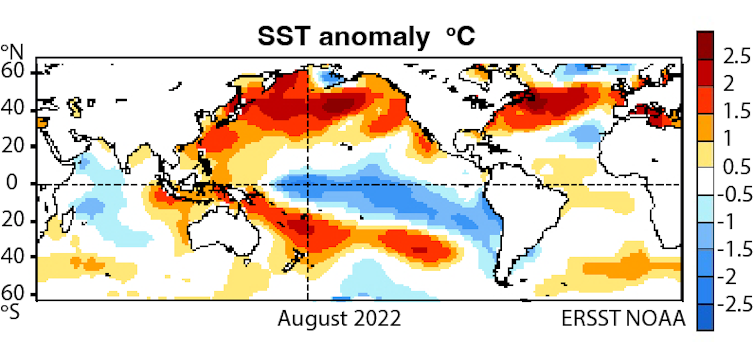 August 2022 had a distinct La Niña weather pattern, with cold waters in the tropical Pacific and intense marine heat waves in the North and South Pacific. The temperatures are compared to the 1991-2020 average. NOAA
All La Niñas are not the same, however. Because of how sea temperatures responded to the heat in the extratropics, the environment today is very different than it was two years ago. Warmth in the North Pacific could have consequences for the “pineapple express” and other West Coast U.S. storms this coming winter.
The natural variability component means that we should not simply expect more of the same every year. As we likely go into an El Niño next year and global temperatures get a boost, extremes will shift to new locations.


Comments