Tracking the 2°C Limit - January 2016
Posted on 17 February 2016 by Rob Honeycutt
January gave us yet another record anomaly in the GISS data, coming in at 1.13C. If we apply this to our preindustrial baseline that puts the monthly anomaly at 1.382C. (Click here for a full size version of the graph below.)

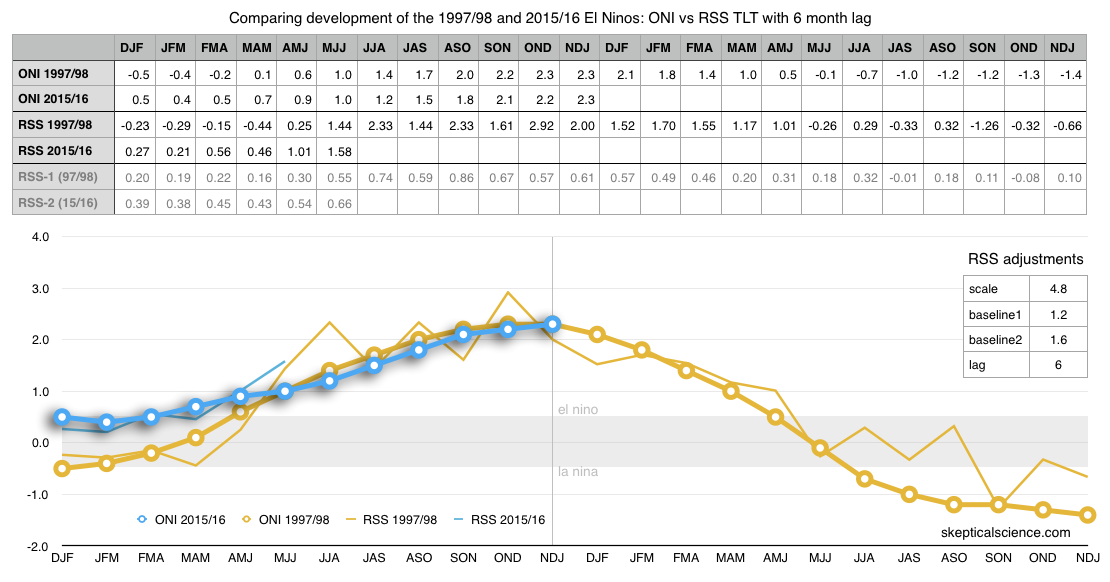
While we're clearly seeing a strong El Nino signal in the surface station data, the satellite data continues to lag. On my chart tracking the current El Nino compared to the 1997/98 El Nino I've decided to try switching to the RSS data. There's not a lot of difference between the two and I'm continuing to track both data sets. (Full size image here.)

Best guess from these comparisons suggest that it's likely the anomaly for satellite data will exceed that of 1998 before all is said and done. It also seems likely the peak in the satellite record is still about 5 months away. We should have a good idea how the satellite data responded to the El Nino sometime around June of this year.


 Arguments


Just to confirm, you've offset (drawn back) RSS by 6 months relative to ONI? Looks like it should be 5 months, locking on peak warmth/el Nino. What drew you to choose 6 months? Better overall correlation?
Barry... Yup. I thought the same thing and tried it. It's not as good a fit. I've always heard the 6 month figure quoted, and I initially questioned it. But working with this graph has caused me to accept that as the correct figure.
Here's the same chart with a 5mo lag. The peak seems right but before and after just don't seem to fit. The numbers jump around at the peak, so who's to say exactly where that peak actually is? The 6 month lag seems (to my eyechrometer) a better overall fit.
Rob - thanks so much for this. I've been hunting for a couple days now, trying to determine the anamoly of this January's temp. compared to the "pre-industrial" baseline for an article I may write for Huffington.(It's a bit frustrating with all the different baselines that the different organizations use). So, to be clear, it is 1.38 C, correct? I am coming from the angle that Paris issued the "intention" to keep warming at or below 1.5C and, though it is only a single month, and probably an El Nino fueled "precursor", it nonetheless takes us quite close to that boundary.
dagold... The 12mo average is probably a better number (1.13°C). And even that will probably fall back down close to 1°C over the coming few years. I'd say, rough guess, not counting heat in the pipeline, we're about half way to 2°C.
Problem is, like driving a large heavy vehicle at highway speeds, you have a lot of momentum and just can't stop on a dime. We need to give ourselves a lot of room to slow down if we want to stay below 2°C.
>We need to give ourselves a lot of room to slow down if we want to stay below 2°C.
Indeed. A great recent lecture here at the LSE by Professor Kevin Anderson on the 'slowing down problem' ie using up all the emisisons budget.
www.youtube.com/watch?v=-T22A7mvJoc&index=26&list=PLYrPyJ3sC_t8ycZyn843Kl57YazOISnWh
On a side note, at about 1:06, from, memory he talks about the importance of personal emisions responsibility, refuting the 'my emisisons don't matter' meme I see high emitters use, he's especially damming of climate scientists :)
The data which, alas, I was told they were spurious, have been received the official NOAA and actually January globally showed a positive anomaly of not exceed the aforementioned value of +1.13 ° C but equal "only" to +1.04 ° C. Always a very high value, but not a record value so that it remains the prerogative of December. Hopefully it's started a slow descent linked to the mitigation of Nino, by 2016 I would love to see the heating resized below the degree Celsius.
http://www.ilforumditutti.net/t3919p40-monitoraggio-costante-global-warming#35468
Franco... I'm sorry but I think Google Translate has turned your Italian into indecipherable English.
Franco72:
I think you are comapring different results. The NOAA site lists January as 1.04C higher than the average of 1900-1999. The NASA site lists January as 1.13 C higher than 1951-1980. The NOAA baseline is higher than the NASA baseline so the results are different. This does not indicate any problems with the data or indicate any cooling. NOAA has December as the hottest month by a small amount while NASA has January as hottest by a small amount. NASA includes more of the Arctic which may be why it is hotter than NOAA for this month.
El Nino causes an increase af 0.1-0.2C temperature. As the year progresses we expect the temperature to retreat from the current record high temperatures by a little as El Nino fades. This does not indicate any cooling of the globe it is just the normal pattern of El Nino.
Thanks for the reply, Rob. 6 mo does look better. Did you analyse the fits statistically?