Climate Science Glossary

Term Lookup

Enter a term in the search box to find its definition.

Settings

Use the controls in the far right panel to increase or decrease the number of terms automatically displayed (or to completely turn that feature off).

Term Lookup

Settings


All IPCC definitions taken from Climate Change 2007: The Physical Science Basis. Working Group I Contribution to the Fourth Assessment Report of the Intergovernmental Panel on Climate Change, Annex I, Glossary, pp. 941-954. Cambridge University Press.

Home Arguments Software Resources Comments The Consensus Project Translations About Support

Bluesky Facebook LinkedIn Mastodon MeWe

Twitter YouTube RSS Posts RSS Comments Email Subscribe


Climate's changed before
It's the sun
It's not bad
There is no consensus
It's cooling
Models are unreliable
Temp record is unreliable
Animals and plants can adapt
It hasn't warmed since 1998
Antarctica is gaining ice
View All Arguments...


Username
Password
New? Register here
Forgot your password?

Latest Posts

Archives

Weather records due to climate change: A game with loaded dice

Posted on 1 April 2012 by John Hartz

This is a reprint of a press release posted by the Potsdam Institute for Climatic Impact Research on March 25, 2012.

The past decade has been one of unprecedented weather extremes. Scientists of the Potsdam Institute for Climate Impact Research (PIK) in Germany argue that the high incidence of extremes is not merely accidental. From the many single events a pattern emerges. At least for extreme rainfall and heat waves the link with human-caused global warming is clear, the scientists show in a new analysis of scientific evidence in the journal Nature Climate Change. Less clear is the link between warming and storms, despite the observed increase in the intensity of hurricanes.
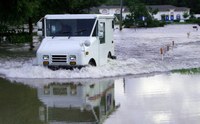
Photo of flooded road in US  

Flooded road after heavy rains in the US.

In 2011 alone, the US was hit by 14 extreme weather events which caused damages exceeding one billion dollars each – in several states the months of January to October were the wettest ever recorded. Japan also registered record rainfalls, while the Yangtze river basin in China suffered a record drought. Similar record-breaking events occurred also in previous years. In 2010, Western Russia experienced the hottest summer in centuries, while in Pakistan and Australia record-breaking amounts of rain fell. 2003 saw Europe´s hottest summer in at least half a millennium. And in 2002, the weather station of Zinnwald-Georgenfeld measured more rain in one day than ever before recorded anywhere in Germany – what followed was the worst flooding of the Elbe river for centuries.

"A question of probabilities"

“The question is whether these weather extremes are coincidental or a result of climate change,” says Dim Coumou, lead author of the article. “Global warming can generally not be proven to cause individual extreme events – but in the sum of events the link to climate change becomes clear.” This is what his analysis of data and published studies shows. “It is not a question of yes or no, but a question of probabilities,” Coumou explains. The recent high incidence of weather records is no longer normal, he says.

“It´s like a game with loaded dice,” says Coumou. “A six can appear every now and then, and you never know when it happens. But now it appears much more often, because we have changed the dice.” The past week illustrates this: between March 13th and 19th alone, historical heat records were exceeded in more than a thousand places in North America. 

Three pillars: basic physics, statistical analysis and computer simulations

The scientists base their analysis on three pillars: basic physics, statistical analysis and computer simulations. Elementary physical principles already suggest that a warming of the atmosphere leads to more extremes. For example, warm air can hold more moisture until it rains out. Secondly, clear statistical trends can be found in temperature and precipitation data, the scientists explain. And thirdly, detailed computer simulations also confirm the relation between warming and records in both temperature and precipitation.

With warmer ocean temperatures, tropical storms – called typhoons or hurricanes, depending on the region – should increase in intensity but not in number, according to the current state of knowledge. In the past decade, several record-breaking storms occurred, for example hurricane Wilma in 2004. But the dependencies are complex and not yet fully understood. The observed strong increase in the intensity of tropical storms in the North Atlantic between 1980 and 2005, for example, could be caused not just by surface warming but by a cooling of the upper atmosphere. Furthermore, there are questions about the precision and reliability of historic storm data.

Overall, cold extremes decrease with global warming, the scientists found. But this does not compensate for the increase in heat extremes. 

Climatic warming can turn an extreme event into a record-breaking event

“Single weather extremes are often related to regional processes, like a blocking high pressure system or natural phenomena like El Niño,“ says Stefan Rahmstorf, co-author of the article and chair of the Earth System Analysis department at PIK. “These are complex processes that we are investigating further. But now these processes unfold against the background of climatic warming. That can turn an extreme event into a record-breaking event.”


Journal Article: Coumou, D., Rahmstorf, S. (2012): A Decade of Weather Extremes. Nature Climate Change [DOI: 10.1038/NCLIMATE1452]

0 0

Printable Version  |  Link to this page

Comments

Comments 1 to 23:

  1. "loaded Dice" is a nice phrase, but I think its not really suitable. When loading two six-sided dice, only the distributon will change: More double-six, less double one. I think we have gone beyond this point: We have thrown away one dice, and replaced it with a seven-sided one. So we now can roll a thirteen, as e.g. the russian heatwave, while rising the average from 7 to 7.5. And when we dont stop burning fossil fuels, we throw away the next dice, replacing it with another seven-sided, or even eight-sided one.
    0 0
  2. Does anyone know what the delay is between the push to the Gulf Stream (ice freezing in the far north Atlantic) and the response (Gulf Stream getting up to speed). As the freezing period gets shorter and the melting period longer, what would happen if we ended up with a 6 month cycle. We would have a strong Gulf stream in the summer giving high temperatures and heavy rainfall and a weak Gulf Stream in the winter causing extreme cold. http://mtkass.blogspot.co.nz/2012/03/pulsating-climate.html
    0 0
  3. I've been watching the heat wave in the American Midwest, and I've seen reports that it is being caused by a blocking high, which is in turn a result of a jet stream loop. I'm thinking that the locations of the jet streams are really governed by where the Hadley, Ferrel, and Polar cells meet, and those locations are broadly governed by energy in the atmosphere that has to be lost through radiative processes. If I'm right so far, then the pattern and location of the heat waves and other weather patterns is very much affected by GHG content. I'm thinking that the loaded dice analogy is good for an introduction to the concept (whether a 1-6 die is loaded, or if the die becomes a 1-7, 2-7, whatever), but the analogy is simplified in the sense that it gives the naive reader the impression that the distribution of extreme events will be uniformly random, and I am thinking that the distribution of anomalous events has a poleward skew. Heat waves common to Mexico start to happen more frequently in Texas. Monsoons that used to hit south/central India start to shift to northern India and Pakistan, where the infrastructure is not built for it, etc.
    0 0
  4. Articles such as this one contribute to a body of evidence that shows beyond doubt that climate change, regardless of its cause, is a bad thing and the sooner we act to reverse it, the better. [snipped] What I suspect will happen is that Rahmstorf and his team, not to mention the IPCC, will continue to publish more and more press releases and papers showing ever more clearly that we really have to fight climate change ever more urgently while the likes of the Daily Mail editor and Rupert Murdoch and the rest of the motley crew [snip] will continue to enjoy their freedom and carry on as they are, while we quietly creep past tipping point after tipping point until it is too late to do anything other than rearrange the deck chairs. Pity they had to build a swimming pool for the Olympics – wait a few years and the whole Olympic arena will be one huge swimming pool. How’s that for a legacy? And, as Ramstorf has shown, we can expect more extreme weather events, so if an extreme low coincides with a perigee spring tide, we might get that legacy sooner than many expect.
    0 0
    Moderator Response: TC: From the comments policy: No accusations of deception. Any accusations of deception, fraud, dishonesty or corruption will be deleted. This applies to both sides. Stick to the science. You may criticise a person's methods but not their motives. No profanity or inflammatory tone. Again, constructive discussion is difficult when overheated rhetoric or profanity is flying around.
  5. The clearest global warming contribution IMO is the pervasive although dispersed warmth added to the natural patterns which happened to be warm here this winter. The midwest and NE extreme records would not have happened without the unusually mild winter (even considering the La Nina pattern). The extreme warm event required prolonged mildness, lack of snow, warm ground, and warm lakes. Only then can the 40F or more above normal occur. As for pattern changes, the predictions are not settled. A decade ago or so the thinking used to be strong polar jet and less meridional flow as we saw this past winter. More recent pattern predictions are somewhat different. I would not attribute the winter or March pattern to GW.
    0 0
  6. James Hansen has also used the loaded dice metaphor. One can find an article called "Perceptions of Climate Change: The New Climate Dice" here in PDF format. It was posted to his web site on January 5, 2012.
    0 0
  7. Michael.M at 02:23 AM on 1 April, 2012 "loaded Dice" Not only is the dice getting high values but we could also be seeing lower values lobbed off. Thus we may enter a state where we have what we consider extreme weather now as the norm, where chaos rains. I suspect things might get a bit like that as the current injection of GHG is like none before or pretty much so. It is going to be a wild ride.
    0 0
  8. The article “Multi-stability and critical thresholds of the Greenland ice sheet” in Nature Climate Change (2012) doi:10.1038/nclimate1449, appears to be counter productive in that it undermines the level of urgency of actions needed to respond to speculative climate prognosis. Are we indeed trying to mitigate the risk the population could face in 500 years? It looks like we have plenty time to adjust to the situation by then. It suggests that if we are patient and wait long enough the problem might solve itself because with each new report the doomsday is being postponed, and the magnitudes of the changes are shrinking. As to the level of credibility of the report one has to consider the excessive use of what is known as “wavers” in the legal profession: phrases such as “substantial”, “could contribute”, “potentially affect”, “might be” and by stating that the source is “a novel computer simulation of the Greenland ice sheet and the regional climate”. Does that mean if the predictions turn out to be false it is the model’s problem? Who of us would be around by then to say “I told you so”? “..a new study by scientists from the Potsdam Institute for Climate Impact Research (PIK, Potsdam-Instituts für Klimafolgenforschung) and the Universidad Complutense de Madrid. Today, already 0.8 degrees global warming has been observed. Substantial melting of land ice could contribute to long-term sea-level rise of several meters and therefore it potentially affects the lives of many millions of people. …..in the long run humanity might be aiming at 8 degrees Celsius of global warming. This would result in one fifth of the ice sheet melting within 500 years and a complete loss in 2000 years; according to the study .....The scientists achieved their insights by using a novel computer simulation of the Greenland ice sheet and the regional climate. (http://www.pik-potsdam.de/aktuelles/pressemitteilungen/gronlands-eismassen-konnten-komplett-schmelzen-bei-1-6-grad-globaler-erwarmung?set_language=de)
    0 0
  9. West129, your comment shows that you have completely misunderstood the OP. Instead of undermining the level of urgency of actions needed to mitigate climate change, it heightens the imperative behind them, for it resolves with increasing clarity the outcomes awaiting us down the road we travel. This report is but one of many recent works, all coming to the same conclusion: AGW is bad, its worse than we thought, it's late in the game and time is running out to implement changes that can make a difference before time runs out on mitigation efforts. And then all we will have left is the "adapt or die" option. For it is not the 6 meters of SLR over 500 years from GIS melt that matters (and if the GIS goes, the WAIS will precede it by orders of magnitude, adding a like amount of SLR), it's just the first 2 meters of SLR that matter. That will force abandonment of the great cities of the coast the world over. You beat the lonely drum of "It's not bad" though the train has left the station, without you.
    0 0
  10. DB "... it's just the first 2 meters of SLR that matter." Yes. That came home to me quite strongly the other day reading a piece about the president (now former) of the Maldives. If anyone thinks that losing a few remote islands off the coast of India by a couple of metres of SLR is unimportant they should think again He pointed out that New York is at the same level as the Maldives. So if those 'insignificant' islands go under, life will not be too comfortable in the subways and carparks of NYC.
    0 0
  11. "He pointed out that New York is at the same level as the Maldives." Actually, due to the unequal redistribution of the SLR (various gravitic/crustal rebound effects), New York City will face a disproportionate impact of that 2 meter SLR: "U.S. seaboards would rise 25 percent more than the global average and threaten cities like New York, Washington, D.C., and San Francisco"
    0 0
  12. Daniel Bailey, I missed the point of the OP on purpose because the Rahmstorf, S. (2012): A Decade of Weather Extremes, Nature Climate Change [DOI: 10.1038/NCLIMATE1452] report was, in my opinion, translated into the “PIK press release” that contradicts facts/reality but is meant to generate publicity and misleading propaganda. It is a summary of plain speculations that lack scientific merit and is are a disgrace to the German scientific community. . As to the increase in the sea level please, refer to the very alarming IPCC predictions (scenarios), “Prognosen des IPCC zum Meeresspiegelanstieg im 21. Jahrhundert [21]” (Increase of sea level for the 21st century): IPCC predicted 367 cm in 1990, 124 cm in 1995, 77 cm in 2001, 51 cm in 2007 and who knows what they will predict next, except that I am certain that it will be even lower. I wonder where the 2 meters you mention are coming from. The 3,67meters [12 ft] predicted by IPCC in 1990 has shrunk to ½ meter (1½ ft) in 2007 because their models have improved? No, because they were adjusted to reflect reality. Models run on computers are still no better than what used to be called crystal balls, not worth getting exited about or to command actions. The climatologists will loose their credibility if they continue to produce documents that contradict reality and seem to have no other purpose than to hype or terrorize the population.
    0 0
  13. Daniel Bailey @11, I believe US seaboards are, on average more threatened because of isostatic rebound. Because the great ice sheets are no longer weighing down the north of the continent, the north is rising, but the south is sinking. This is bad news for southern US coastal towns which will probably experience sea level rise greater than 25% above the global average. I suspect, however, that New York would be near the "pivot point", and possibly north of it. In either case it will experience sea level rises closer to the the global average than the rest of the US, and possibly less than the global average. I haven't checked the exact details, however.
    0 0
  14. @ West "I missed the point of the OP on purpose" Ah, you were being purposefully obtuse! Well, that's all right then. Not. Please curtail the ideology and inflammatory rhetoric. This is a science-based forum. You lose credibility thusly. And do please bother to support your unsupported assertions with links (to credible source) as well. As for my source for 2 meters SLR, please note that I did not temporally attach it. Using your very own Stefan Rahmstorf you refer to: Has the IPCC underestimated the risk of sea level rise? In this paper, Dr. Rahmstorf documents the IPCC's underestimations (not over-estimations) of SLR and incorporates some of the latest estimates of SLR (124 centimetres by 2100 and 114 centimetres by 2095) Taking ice sheet dynamics into account, decadal doublings of mass-loss from both the Greenland and West Antarctic Ice Sheets are expected this century...and beyond. The present worst-case scenario in the literature (also the latest) which takes this into account is here (in press). Note the use of supportive links for assertions. And note, again, that I did not tie the 2 meter SLR to a particular date. That would be a false assumption on your part that I did. @ Tom: The Bamber paper has details. Edit: The Bamber paper can be found here (free download after free registration): Reassessment of the Potential Sea-Level Rise from a Collapse of the West Antarctic Ice Sheet
    0 0
  15. Analogies compare shared characteristics of two different things to better explain the thing that is less well understood. I use the slugger on steroids analogy, given that more people watch baseball than roll dice in casinos. A single game/series performance is weak evidence. However, a dramatic change in a player’s physical appearance, season home run percentage and average distance is strong evidence.
    0 0
  16. TomC #13: " I suspect, however, that New York would be near the "pivot point"" There's an abundance of data for this; no need to speculate. From Sella et al 2007: The uplift rates generally decrease with distance from Hudson Bay and change to subsidence (1 – 2 mm/yr) south of the Great Lakes. The ‘‘hinge line’’ separating uplift from subsidence is consistent with data from water level gauges along the Great Lakes, showing uplift along the northern shores and subsidence along the southern ones. They show the hinge line running off the east coast well north of NYC. That suggests that a major portion of the US coastline has SLR that is enhanced by negative GIA. However, if SLR was due only to GIA, it would not be accelerating. Yet that is exactly what it is doing, as shown here. Results clearly show that the 20th-century rate of sea-level rise is 2 millimeters higher than the background rate of the past 4,000 years. Furthermore, the magnitude of the sea-level rise increases in a southerly direction from Maine to South Carolina. On the US Gulf Coast, the issue of SLR is compounded by subsidence due to sedimentary compaction and dewatering, ground water removal and hydrocarbon production. Any way you slice it, this is not a favorable combination.
    0 0
  17. muoncounter @16, thank you for the additional information. What I was missing, and what Bamber indicates (and thanks to Daniel for doing so) is that a collapse of the West Antarctic Ice Sheet will both result in uplift in West Antarctica as the continent responds to reduced load, and the removal of substantial mass from West Antarctica to near the equator under the effect of the centripetal "force" from the Earth's rotation. Both effects will result in water moving from the Southern Hemisphere to the Northern Hemisphere, resulting in a greater increase in sea level in the NH than in the SH. This combined effects are shown below. The contours are the normalized sea level rise, so that 1 represents the global average. Multiply by 3.2 to get the sea level rise in meters. This increase does not take into account the effects of uplift or subsidence in North America due to isostatic rebound in North America. Consequently, while collapse fo the WAIS will bring 1.25 times global averge sea level rise in New York, it will bring much more south of New York along the US coast. Still, Bamber et al is good news, on balance, as it reduces the expected sea level rise from a collapse of the WAIS. That does not reduce the final sea level rise expected from global warming as the ice expected to melt has not reduced, only the ice expected to collapse. But it does reduce the magnitude of the most rapid sea level rise.
    0 0
  18. @ Daniel Bailey 14: You proved my point: This is a science based forum. { snip }
    0 0
    Moderator Response: [mc] Incomprehensible, non-science based commentary snipped. Please refer to the Comments Policy.
  19. West129 - most of "what if" is in human control. IF you emit at this rate, THEN you will likely get sealevel rise of x metres. Just like theory of gravity says IF you provide this much thrust to your rocket, THEN you will end up there. That said there is no denying very considerable uncertainties because of the highly non-linear behaviour of ice-sheets. The models are semi-empirical, based on past ice sheet behaviour. However, what source says sealevel will go down? The physics says melt rate will at worse than linear but hard to estimate by how much. What they all say, is that continuing to emit GHGs will cause at very least expensive levels of sea-level rise. No amount of semantics about "predictions" or "forecasts" change that. If you dont like the prediction, then change the emissions.
    0 0
    Moderator Response: TC: The comments policy forbids all caps. Please comply in future so that moderators are not forced into deciding whether to snip or delete.
  20. I think the focus on 2 meters is, in a way, misleading. Storm surges will create Katrina like events in coastal cities long before the actual 2 meters is hit. Of course storm surges on top of 2 meters is so far beyond ugly that I can't honestly truly comprehend it. Sadly, on the current track, we shall indeed see.
    0 0
  21. Weather records, indeed. April 11, Amarillo Texas: 4-8 feet of hail, followed by flash flooding as it melted. Quoting the anchorman, "I have never, ever, ever seen what you're about to show us."
    0 0
  22. mc, while the hailstorm and consequences were dramatic, I have a few doubts about the reports of 2-4 or 4-8 feet of hail actually falling (is there a better source than news media?) - I suspect those measurements were mostly from drifts where the flash floods piled the ice up. I don't doubt that there were large rainfall and hail totals however! And I don't want to take away too much from the weirdness of that weather - the video of the flash flood loaded up with ice is scary, the power, shape and destructiveness of the flood has more in common with a volcanic lahar than even a typical flash flood!
    0 0
  23. sky, All those US news outlets get the same feed from the NWS. Thank goodness the Daily Mail wasn't fooled: But the photos of the one-off event are so unbelievable that an army of online sceptics have cast doubt on their authenticity, suggesting that instead they may simply show large rocks. These must be the usual 'sceptics,' who rarely bother checking their facts. But the last time I was in the UK, even they didn't have rocks that could melt.
    0 0

You need to be logged in to post a comment. Login via the left margin or if you're new, register here.


The Consensus Project Website

THE ESCALATOR

(free to republish)


© Copyright 2025 John Cook
Home | Translations | About Us | Privacy | Contact Us