


 Arguments


A prelude to the Arctic melting season
Posted on 12 February 2012 by Neven
This is a summary/re-write of a recent blog post on the Arctic Sea Ice blog.
We are entering the final stage of the freezing season in the Arctic. The sea ice has reached all shores, and where there aren't shores it reaches as far south as the winds and currents will permit. Or, at least it used to go like that.
Ice growth had been relatively slow in sea ice regions like the Barents Sea, Kara Sea and Greenland Sea (see this Cryosphere Today map to get an idea of where the regions are), but nothing (much) out of the ordinary. However, in the past two weeks a persistent weather pattern emerged that is bringing Siberian cold to almost all of Europe, but warm air and water to Novaya Zemlya, the large island that separates the Barentsz and Kara Seas.
The effect this has had can clearly be seen when comparing yesterday's sea ice concentration image with those of previous years on the same date:
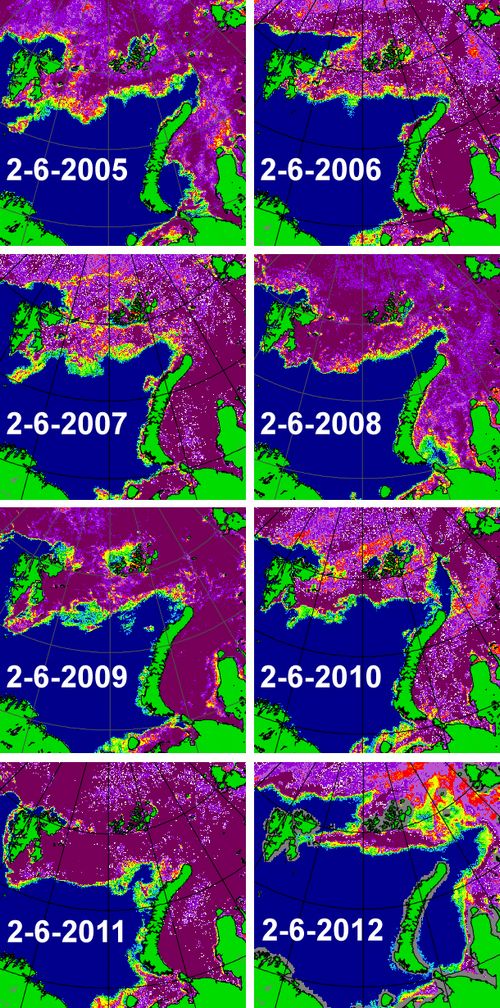
image courtesy of the University of Bremen
I have been looking at the Arctic sea ice from up close for about two years now, but this is definitely one of the most spectacular things I have seen so far. It's almost as if the melting season has already started in the Barents and Kara Seas, two months earlier than normal. The only year that looks even remotely similar to this year is 2005.
What could be causing such an early retreat of sea ice cover? The answer is probably manifold. First and foremost is the big high-pressure system over Northern Siberia that is helping Ded Moroz (the Slavic version of Old Man Winter) to hold Europe in a late frosty grip. At the same time this high draws in winds from the west, pushing the ice back in the Barents and Kara Seas. These winds also bring warm air and rain from the North Atlantic. Take for instance this data from the weather station at Svalbard for the latest 30 days:
"Average temperature was -3.3 °C, 12.2 °C above the normal. Highest temperature was 4.8 °C (29 January), and the lowest was -15.0 °C (25 January). The total precipitation was 61.3 mm. Highest daily precipitation was 25.9 mm (30 January)."
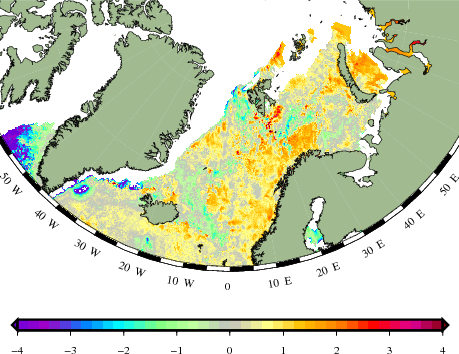
So warm winds, warm rain. How about the water? The winds are probably taking the warm waters from the North Atlantic Current some further still into the Arctic, to places where the sea water that was already exceptionally warm last melting season never really cooled down enough (relatively speaking) for some proper ice formation, as can be seen on this sea surface temperature anomaly map from the Danish Meteorological Institute:
According to weather forecast models the pattern will change again in the coming days. Whether we will see a late freeze-up in the Barents and Kara Seas, remains to be seen. Either way, it won't make those warm waters disappear, and it won't prevent the Sun from coming up to reclaim its reign over the Arctic in a couple of weeks from now. As things currently stand, the Atlantic side of the Arctic looks spectacular. Spectacular and ominous.


 0
0  0
0 Increasing freshwater on the U.S. and Canadian side of the Arctic from 2005 to 2008 is balanced by decreasing freshwater on the Russian side, so that on average the Arctic did not have more freshwater. Here blue represents maximum freshwater increases and the yellows and oranges represent maximum freshwater decreases.
 Never-the-less the full comparison still shows Arctic summer sea Ice Extent to have fallen almost as much in the 21st century as it did throughout the twentieth. It is interesting to note that all of the fall in the twentieth century is post 1950. In other words, the clear pattern is that while NAO may influence Arctic sea ice extent, that influence is now imposed on an unprecedented (in modern times) long term decline in sea ice extent which is a consequence of global warming.
Put differently, the difference between the 2011 and 2012 sea ice extent near Novaya Zemlya may be due to the NAO, but the difference between 2012 and the 1976-2006 mean is due to global warming:
Never-the-less the full comparison still shows Arctic summer sea Ice Extent to have fallen almost as much in the 21st century as it did throughout the twentieth. It is interesting to note that all of the fall in the twentieth century is post 1950. In other words, the clear pattern is that while NAO may influence Arctic sea ice extent, that influence is now imposed on an unprecedented (in modern times) long term decline in sea ice extent which is a consequence of global warming.
Put differently, the difference between the 2011 and 2012 sea ice extent near Novaya Zemlya may be due to the NAO, but the difference between 2012 and the 1976-2006 mean is due to global warming:
 Doesn't look like much of a player.
Even worse for the BC believers is Warren et al 2008:
Preliminary results indicate that the snow cover in Alaska, Canada, and the Arctic Ocean has lower BC concentrations now than 20 years ago (5-10 ppb instead of 15-30 ppb), consistent with the declining trend of BC found in air samples at Alert.
-- emphasis added
How can a pollutant that is decreasing in concentration contribute to an increasing melt rate?
Doesn't look like much of a player.
Even worse for the BC believers is Warren et al 2008:
Preliminary results indicate that the snow cover in Alaska, Canada, and the Arctic Ocean has lower BC concentrations now than 20 years ago (5-10 ppb instead of 15-30 ppb), consistent with the declining trend of BC found in air samples at Alert.
-- emphasis added
How can a pollutant that is decreasing in concentration contribute to an increasing melt rate?

 [Source]
 source.
Here is a January 1977 anomaly map when winter ice shows the largest extent in the record (compare to your 2012 graph) (article with graph of arctic ice 1972 to 2002).
source.
Here is a January 1977 anomaly map when winter ice shows the largest extent in the record (compare to your 2012 graph) (article with graph of arctic ice 1972 to 2002).
 source.
What may be more significant are the summer month anomalies.
source.
What may be more significant are the summer month anomalies.
 source.
or-(another summer with low arctic ice area)
source.
or-(another summer with low arctic ice area)
 source.
And for comparative view the summer of 1977.
source.
And for comparative view the summer of 1977.
 source.


Comments