Climate Science Glossary

Term Lookup

Enter a term in the search box to find its definition.

Settings

Use the controls in the far right panel to increase or decrease the number of terms automatically displayed (or to completely turn that feature off).

Term Lookup

Settings


All IPCC definitions taken from Climate Change 2007: The Physical Science Basis. Working Group I Contribution to the Fourth Assessment Report of the Intergovernmental Panel on Climate Change, Annex I, Glossary, pp. 941-954. Cambridge University Press.

Home Arguments Software Resources Comments The Consensus Project Translations About Support

Bluesky Facebook LinkedIn Mastodon MeWe

Twitter YouTube RSS Posts RSS Comments Email Subscribe


Climate's changed before
It's the sun
It's not bad
There is no consensus
It's cooling
Models are unreliable
Temp record is unreliable
Animals and plants can adapt
It hasn't warmed since 1998
Antarctica is gaining ice
View All Arguments...


Username
Password
New? Register here
Forgot your password?

Latest Posts

Archives

Arctic sea ice melt - natural or man-made?

Posted on 9 June 2008 by John Cook

Arctic sea ice has declined steadily since the 1970s. However, the 2007 summer saw a dramatic drop in sea ice extent, smashing the previous record minimum set in 2005 by 20%. This has been widely cited as proof of global warming. However, a popular mantra by climatologists is not to read too much into short term fluctuations - climate change is more concerned with long term trends. So how much of Arctic melt is due to natural variability and how much was a result of global warming?

The long term trend in Arctic sea ice

Global warming affects Arctic sea ice in various ways. Warming air temperatures have been observed over the past 3 decades by drifting buoys and radiometer satellites (Rigor 2000, Comiso 2003). Downward longwave radiation has increased, as expected when air temperature, water vapor and cloudiness increases (Francis 2006). More ocean heat is being transported into Arctic waters (Shimada 2006).

As sea ice melts, positive feedbacks enhance the rate of sea ice loss. Positive ice-albedo feedback has become a dominant factor since the mid-to-late 1990s (Perovich 2007). Older perennial ice is thicker and more likely to survive the summer melt season. It reflects more sunlight and transmits less solar radiation to the ocean. Satellite measurements have found over the past 3 decades, the amount of perennial sea ice has been steadily declining (Nghiem 2007). Consequently, the mean thickness of ice over the Arctic Ocean has thinned from 2.6 meters in March 1987 to 2.0 meters in 2007 (Stroeve 2008).


Global warming has a clearly observed, long term effect on Arctic sea ice. In fact, although climate models predict that Arctic sea ice will decline in response to greenhouse gas increases, the current pace of retreat at the end of the melt season is exceeding the models’ forecasts by around a factor of 3 (Stroeve 2007).
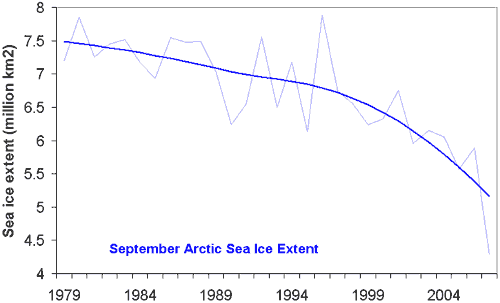


Figure 1: September Arctic Sea Ice Extent (thin, light blue) with long term trend (thick, dark blue). Sea ice extent is defined as the surface area enclosed by the sea ice edge (where sea ice concentration falls below 15%).

What caused the dramatic ice loss in 2007?

The sudden drop in sea ice extent in 2007 exceeded most expectations. The summer sea ice extent was 40% below 1980's levels and 20% below the previous record minimum set in 2005. The major factor in the 2007 melt was anomalous weather conditions.

An anticyclonic pattern formed in early June 2007 over the central Arctic Ocean, persisting for 3 months (Gascard 2008). This was coupled with low pressures over central and western Siberia. Persistent southerly winds between the high and low pressure centers gave rise to warmer air temperatures north of Siberia that promoted melt. The wind also transported ice away from the Siberian coast.

In addition, skies under the anticyclone were predominantly clear. The reduced cloudiness meant more than usual sunlight reached the sea ice, fostering strong sea ice melt (Kay 2008).

Both the wind patterns and reduced cloudliness were anomalies but not unprecedented. Similar patterns occurred in 1987 and 1977. However, past occurances didn't have the same dramatic effect as in 2007. The reason for the severe ice loss in 2007 was because the ice pack had suffered two decades of thinning and area reduction, making the sea ice more vulnerable to current weather conditions (Nghiem 2007).

Conclusion

Recent discussion about ocean cycles have focused on how internal variability can slow down global warming. The 2007 Arctic melt is a sobering example of the impact when internal variability enhances the long term global warming trend.

0 0

Printable Version  |  Link to this page

Comments

1  2  3  4  5  6  7  8  9  10  11  Next

Comments 1 to 50 out of 529:

  1. John Unfortunately two of the links would not open for me* and all but Kay 2008 were only abstracts. As Kay et. al. does not mention carbon dioxide anywhere in the body of the paper and neither did the abstracts, there is no indication that it was caused by AGW. The paper and abstracts all refer to heat transfer from ocean currents but really do not answer your question one way or another. Very interesting reading however. * no error messages just blank pages - probably server problems rather than bad links.
    0 0
    Response: Kay 2008 isn't about CO2 but about the weather conditions in 2007 that caused reduced cloudiness throughout the 2007 summer.
  2. I didn't have problem with any of the links and only the Gascard paper was limited to the abstract.
    0 0
  3. I tried again and was able to download Nghiem 2007, Comiso 2003 and Rigor 2000 this time around (I already had Kay 2008). I overlooked one of these earlier but the other two apparently had server problems. But for Francis 2006, Shimada 2006, Perovich 2007, Stroeve 2007, Stroeve 2008 and Gascard 2008, I still get only abstracts and a form to purchase the paper. I'll get back later after reading the 3 additional PDFs. Thanks.
    0 0
    Response: Any time I could find an online PDF, I'd link to that. In the cases where only the abstract was available, I'd email the author and 9 times out of 10 they'd email me the full paper. I'll be happy to email you any of the papers if you're interested.
  4. John Re: "Downward longwave radiation has increased, as expected when air temperature, water vapor and cloudiness increases (Francis 2006). More ocean heat is being transported into Arctic waters (Shimada 2006)." In Comiso 2003 - what the "Arctic is expected" to do is based on Budyko, M. I., 1966: "Polar ice and climate", as well as "atmosphere model to gradual changes of atmospheric CO2. Part II: Seasonal response", by Manabe, 1992. Cosimo 2003 is in turn referenced by Nghiem, 2007 for support. The CO2 hypothesis appears to be accepted defacto from 1999 as the cause: Using simulations by global climate models (RIGOR 1999) "These changes in surface air temperature over the Arctic Ocean are related to the Arctic Oscillation, which accounts for more than half of the surface air temperature trends over Alaska, Eurasia, and the eastern Arctic Ocean but less than half in the western Arctic Ocean." Also on Dec. 16, 1999, there was a press release "Evidence mounts for Arctic Oscillation's impact on northern climate" which said this could be part of human-induced climate change. But this is not what Francis or SHimada said in 2006 (at least according to the abstracts), they clearly state "air temperature, water vapor and cloudiness" and "ocean heat", with no mention of CO2, but instead the more powerful GHG: water vapor. To attempt to decipher all this I found a site that explained that the main constant is that the climate in all arctic areas is affected by the extreme solar radiation conditions of high latitudes. This site also contains the basics and terminology used so that the layman can more readily understand. Kay 2008 aside, I did not see mention anywhere of the other contributers to the ice melt that I have read about since last fall but the 3 I read assumed AGW caused the thinning and were published prior to the discovery of vulcanism's contrinution under and around Greenland. So I am still skeptical.
    0 0
  5. John I know that Kay 2008 was not about CO2, but it was the only paper I could read and try to relate to the question posed in the title "natural or man-made?". It is obvious to me that summer 2007 was natural over the arctic from that paper so I had some difficulty figuring it out in context. After reading Nghiem 2007, Comiso 2003 and Rigor 2000, I started to put it into context to see how you intend it to support AGW. No offense but I am not convinced.
    0 0
    Response: I thought I'd spelled it out but hopefully this'll make it clearer. The dramatic sea ice melt in 2007 was largely due to natural weather conditions - the strong winds moving ice out of the Arctic and reduced cloudiness. Kay 2008 looks at the natural weather conditions causing the reduced cloudiness.

    So the answer to the question "is Arctic ice melt natural or manmade?" is both. The long term trend is manmade but natural weather conditions in 2007 added to the trend, with dramatic effect. Plus the long term trend weakened the sea ice so that it was more vulnerable in 2007.
  6. From the opening line in the Abstract (Gascard 2008): "The Arctic is undergoing significant environmental changes due to climate warming." I assume that this must be a different "anticyclonic pattern" than the one spoken of in Kay 2008 since it has a different cause. Or is that why you titled this in the form of a question?
    0 0
  7. John No, your argument was clear and well written, my confusion is in the supporting papers and the asumption made that the thinning was caused by AGW (Gascard 2008). I think the cause is much more dynamic than just GHGs from other papers I have read. The explanation for the sudden melt is quite understandable.
    0 0
  8. You haven't got that quite right I think, Quietman. The extent of summer sea ice melt over the Arctic in 2007 certainly wasn't natural. It was a combination of a natural phenomenon intercepting with strongly "unnatural" conditions. If you read Kay et al (2008), it's clear that the authors indicate that their analysis is consistent with a natural, but not uncommon, phenomenon (decreased cloudiness and increased longwave downwelling) being greatly augmented by the fact of a greatly attenuated Arctic ice sheet (both in extent and thickness) that has been occurring since the 1960's, as a result of increased global surface temperatures (global warming) which have predominated over the Northern polar regions. e.g. see historical sea ice extent data at the Uni of Illinois Arctic Climate Research Center: http://arctic.atmos.uiuc.edu/cryosphere/IMAGES/seasonal.extent.1900-2007.jpg It's the already attenuated loss of polar ice and ice thickness that lead to a (not-unprecedented) phenomenon having such a large effect. Two points are pertinent [see Kay et al (2008)]: (i) The increased LW downwelling is calculated by Kay et al to yield increased surface thermal energy sufficient to melt an extra 0.3 m of ice (or 0.7 m of ice in broken seas where albedo feedbacks kick in). In previous years [see point (ii)], when the sea ice was considerable thicker, 0.3 metres of melt wasn't sufficient to clear large areas of ice and so the sea-ice extent was (a) not diminished much, and (b) consequently, reinforcing albedo effects didn't arise. (ii) This is clear from the observation that the 2007 cloud/LW downwelling phenomenon was by no means unprecedented. Thus [see Kay et al (2008)], the Barrow measurements of cloud cover show that the years 1968, 1971, 1976, 1977 and 1991, for example, all had even lower cloud cover than that of 2007. However (see the link to the Uni. Of Illinois sea ice extent data just above in this post), there was no significant deviation from the trend of sequentially reduced summer sea ice extent during these years. In other words the weather conditions pertaining during the summer of 2007 shouldn’t have resulted in the massive attenuation of sea ice. Unfortunately, the “baseline” situation in the Arctic has changed. As Kay et al (2008) conclude: In a warming world "cloud and shortwave radiation will play an increasingly important role in modulating summertime sea ice extent." The other papers are generally in line with these rather straightforward conclusions. We've always known that the Arctic would be one of the most sensitive areas for observing consequences of global warming, since it is a "focus" for strong heat transfer from the equator, and it's an area where strong positive feedbacks due to loss of albedo from warming-induced sea ice melt will be observed in a warming world. That's pretty much exactly what Kay et al are highlighting. This statement in your post #4 is also a bit dodgy: "But this is not what Francis or SHimada said in 2006 (at least according to the abstracts), they clearly state "air temperature, water vapor and cloudiness" and "ocean heat", with no mention of CO2, but instead the more powerful GHG: water vapor." But it's obvious that: (i) "air temperature" refers to warmer air temperatures (the air temperature is rising due to enhanced greenhouse effect) (ii) "water vapour" refers to increased water vapour concentration that occurs spontaneously in warmer air. Remember that water vapour concentrations are effectively "set" by the air temperature (and pressure) and doesn't vary independently of primary warming (or cooling) influences. In other words water vapour concentrations can't just rise on their own! They're always feedbacks. (iii) "ocean heat" refers to the increased heat in the ocean due to global warming (and albedo effects as summer sea ice is increasingly denuded)…and so on…. i.e., the fact that a paper doesn't mention CO2 doesn't mean that effects from increasing greenhouse gases aren't implicitly or explicitly meant! After all man-made greenhouse gases included CO2 and methane and nitrous oxides directly and water vapour indirectly. However one doesn't have to keep spelling it out in every paper that's written.
    0 0
  9. chris I am sorry but to say the cause is involving CO2 to any serious degree is assuming that the hypothesis for current CO2 induced AGW is correct. All of the above papers make that assumption without any attempt to prove that assumption correct. Water Vapor acting as a GHG in lower latitudes would have the same effect as described, so would solar brightening from lack of aerosols and so would ocean warming cycle forcing from increased vulcanism. To be accurate, you can say for a fact that the ice thinned from some form of heating, possibly GHG, possibly CO2 but you can not assume that it is anything specific without proof. Thus far there is absolutely no proof of any serious effect from AGW - the cause is still hypothetical. Working from other peoples assumptions is just bad science. Kay et. al. in fact do not mention CO2 at all in the 2008 pape
    0 0
  10. I seem to have dropped the r.
    0 0
  11. Hi John: interesting post (I am familiar with the Canadian side of the Arctic - having spent some time there). I have been following the ice formation here http://igloo.atmos.uiuc.edu/cgi-bin/test/print.sh?fm=06&fd=10&fy=2007&sm=06&sd=10&sy=2008 and to me it looks like we are on for another low year this year. I wish I had taken William up on his offer of a bet!! ;-) JOhn
    0 0
  12. Quietman, in science one follows the evidence and discards hypotheses that don't accord with extant reality. The rapid denuding of the Arctic ice sheet, especially since the 1960's is a result of enhanced surface temperatures. The enhanced surface temperatures have followed the massive enhancement of atmospheric greenhouse gas concentrations, especially since the 1960's. Greenhouse gasses cause the Earth to warm. The best-supported (by the scientific evidence!) estimate for the response to enhanced [CO2] is near 3 oC (=/- a bit) of surface warming per doubling of atmospheric CO2. The Arctic is one of the most sensitive regions of the world to warming since (i) air and ocean currents carry excess heat from the equatorial regions to the high Northern latitudes, and (ii) reduction of albedo from melting sea ice enhances the effects of surface warming. One doesn't need to reiterate all of these well-established (by the evidence!) points every time one writes a paper that discuss the consequences of surface warming. You suggest that the warming might have other origins. However these are not supported by the evidence. You suggest "Water Vapor acting as a GHG in lower latitudes would have the same effect as described, so would solar brightening from lack of aerosols and so would ocean warming cycle forcing from increased vulcanism. " Let's see what the evidence indicates: (i) Water vapour. There can be no persistent increase in water vapour in low latitudes unless the troposphere warms. Persistent changes in water vapour are feedbacks to primary effectors of changes in tropospheric temperature. Water vapour can't just be "added" to the troposphere. It falls right out again. Water vapour partitions in the troposphere according to the tropospheric temperature and pressure. So if its concentrations have changed something priimary must have caused the changes in tropospheric temperature. We know that the troposphere has warmed as a result of enhanced CO2/methane/nitrous oxides. We know that this warming hasn't had a significant contribution from changes in solar outputs at least since the late 1950's. The scientific evidence indicates that tropospheric warming is the result of enhancement of the greenhouse effect, and that this warming has resulted in the expected increase (a well-established feedback) in tropospheric water vapour. (ii) "solar brightening from lack of aerosols". Nope. The atmospheric aerosol load has increased rather significantly since the 1960's. Thus enhanced Arctic sea ice melt has increased despite the overall decreased solar irradiation reaching the surface. Rather than "solar brightening" we've actually had a bit of "solar dimming". e.g. see: Hansen et. al. (2005): Earth's energy imbalance: Confirmation and implications. Science, 308, 1431-1435 (see Figure 1). http://pubs.giss.nasa.gov/docs/2005/2005_Hansen_etal_1.pdf (iii) "...ocean warming cycle forcing from increased vulcanism". Nope. There hasn't been "increased vulcanism" since the 1960's. Let's look at this in more detail, being careful not to be taken in by press release hyperbole: (a) A warm sub-crustal region seems to exist below Northern Greenland [***]. Can this have contributed to enhanced Arctic sea ice since the 1960's? Not really. Consider: (i) the location of the greatly attenunated regions of Arctic sea ice: e.g. comparing sea ice extent in Sept 10th 1979 with that in Sept 10 2007 http://igloo.atmos.uiuc.edu/cgi-bin/test/print.sh?fm=09&fd=10&fy=2007&sm=09&sd=10&sy=1979 The "hot spot" in Northern Greenland is nowhere near the regions of enhanced sea ice melt. [***]van der Veen et al (2007) Subglacial topography and geothermal heat flux: Potential interactions with drainage of the Greenland ice sheet Geophysical Research Letters, VOL. 34, L12501. Braun et al (2007) Gravity-inferred crustal thickness of Greenland; Earth And Planetary Science Letters 262138-158. (ii) That "hot spot" has been there for millions of years (actually it's been there for much longer, but Greenland has "migrated" over the "hot spot" millions of years ago). Is it likely that just at the time (since the 1960's) we've been enhancing the Earth's surface temperature by pumbing out greenhouse gasses, the "hot spot" has suddenly become "hotter"? Nope. (iii) Do sub-crustal magma chambers ("hot spots") and even surface volcanos produce persistent increases in surface temperatures? Not really. Consider the most active magma chambers and volcanic activity in the high Northern latitudes. They sit right under Iceland which sits astride the opening of the North Atlantic where two tectonic plates pull apart. By your hypothesis that must have produced rather large surface warming in recent times? In fact the opposite is true. If one inspects the pattern of surface warming during the period of massive man-made enhancement of the Earth's greenhouse effect, the region around Iceland is one of the few places which has undergone a mild cooling: e.g., consider Arctic surface warming 1954-2003 http://arctic.atmos.uiuc.edu/CLIMATESUMMARY/2003/IMAGES/annual.1954-2003.tchange.png (iv) In fact we know that even volcanos that breach the polar ice cap surfaces don't make much of a contribution to widespread contemporary ice sheet or sea ice melting [*****]. For example a "recent" (around 250 years BC) volcanic eruption has been identified in the West Antarctic ice sheet, and there is a bit of a "hot spot" there too. However as the authors point out this can't be impacting the widsespread thinning of glacial ice in the region: "Therefore, even if continuous or episodic production of melt water from HMSV affects Pine Island Glacier, there is little likelihood that it could affect these neighbouring glaciers. It is thus possible that volcanic activity over HMSV contributed to some of the recent changes in velocity of Pine Island Glacier27, but it cannot explain the widespread thinning that has been observed across these glacier basins in recent decades. We follow previous authors30 in favouring an oceanic driver as the likely cause for these changes." [*****]Corr & Vaughan (2008) A recent volcanic eruption beneath the West Antarctic ice sheetNature Geoscience 1, 122 - 125 (2008) ....and so on....overall you seem to be rejecting rather straightforward conclusions based on a wealth of well-established scientific data, and plumping for explanations for which the evidence is actively contrary.
    0 0
  13. chris Good argument. Except for the increased vulcanism. Do not confuse less eruptions for less vulcanism. The earth's been much more active, not less, since 1976. The extreme El Ninos in the ENSO are a direct result. The impact on PDO, Arctic Oscillation and Atlantic Multidecadal Oscillation have not been investigated yet as far as I can tell. The most recent paper on Solar Dimming / Brightening indicates exactly the opposite of what you indicate. But how much impact this may have I am not aware of. There is a link to it near the bottom of "Its the Sun". There is no argument as to whether CO2 is a GHG, only as to AGW as a major factor in the forcing. I agree CO2 is a contributer (as a symptom and a feedback) but disagree on the extent of its participation in warming. AGW is an assumption, an opinion of some scientists but far from all, and that "concensus" is in a slow reduction. Thus far it has not been shown to be the cause and will not be until someone decides at what point the hypothesis can be falsified (stop moving goal posts). Thus far the cycles of the solar system's gravitational forcing has been the best explanation to date for climate change (not just the sun or TSI). In Dr. Mackey's paper (2007) on Dr. Rhodes hypothesis, he says that the test period for the hypothesis is the next 5 years (the paper came out last summer). So far he has been correct (as the ocean cycles are driven by this hypothesis as well, the recent La Nina was expected). In engineering we base our conclusions on facts, not consensus, so my standards for acceptance are somewhat higher. I am content to wait and see if Dr. Mackey and the late Dr. Fairbridge continue to be correct.
    0 0
  14. Quietman, you really need to put some substance to those assertions. For example in post #9 you mentioned "...ocean warming cycle forcing from increased vulcanism". Now we're talking about the massive retreat of Arctic sea ice in the summer of 2007 on this thread, and the considerable long term trend of diminished Arctic sea ice since the 1960's: http://arctic.atmos.uiuc.edu/cryosphere/IMAGES/seasonal.extent.1900-2007.jpg I agree with you that the period since the 1970's has seen more volcanic activity than, for example, the middle period of the 20th century. However, volcanic activity in general results in transient cooling of the Earth's surface temperature. So obviously volcanic activity in general can't have made any contribution to the massive attenuation of summer Arctic sea ice. e.g. http://pubs.giss.nasa.gov/docs/2005/2005_Hansen_etal_1.pdf (see Figure 1a/c) My post (#12) was written assuming that you meant tectonic activity relating to local magma incursions/ocean crust thinning and so on, since this seems to be the only way that "tectonic activity" might enhance Arctic sea ice attenuation. So what do you mean? What do you mean specifically when you refer to "...ocean warming cycle forcing from increased vulcanism"? Likewise you say that "The most recent paper on Solar Dimming / Brightening indicates exactly the opposite of what you indicate." Which "most recent paper"? In what way does it "indicate(s) exactly the opposite of what (I) indicate"? Likewise you suggest that RW Fairbridge's "hypothesis" "has been the best explanation to date for climate change". Which hypothesis? You indicate that it "so far he has been correct" and that the recent La Nina "was expected". Please give us the citation to the paper in which Fairbridge outlines his hypothesis which allows him to predict the recent La Nina. Or at least explain to us how his analysis predicts the recent La Nina.
    0 0
  15. chris Re: "However, volcanic activity in general results in transient cooling of the Earth's surface temperature" No. That should be: Volcanic ERUPTIONS in general result in transient cooling from particulates but may be balanced by GHGs from the eruption (or not, depending on the nature of the eruption). The term vulcanism, while encompasing eruptions, is much broader. Yellowstone for instance has not erupted but is rising into a dome due to vulcanism, some worry about a supervolcano for which it has the potential. A volcanic eruption signals the start of El Nino but is not the cause of it. The cause of the volcano, however, is the same cause as the El Nino phase of ENSO. My hypothesis is based on what we now know about currents in the magma and the resulting changes in vulcanism from these currents. Also on a hypothesis (not mine) that vulcanism causes the upwelling currents from the SA subduction zone in an El Nino. In addition to magma flow there are tidal effects. These tidal effects are caused by gravitational pull from extra terrestrial bodies and may be amplified by alignments. Dr. Fairbridge explained how these gravitational forces effect the sun, and ssid the strongest effect comes from Jupiter when aligned with other planetary bodies (Mackey 2007). If Jupiter can effect the suns internal currents it can also effect the earths internal currents in my view; and the last full alignment occurred in 1976. The point I am attempting to make here is that you can not put the blame completely on CO2 because it is not alone in atmosphereic warming, let alone polar ice melt and this is borne out by the fact that it is only the north pole so affected. Dr. Fairbridge proposed the hypothesis that the sun is affected by gravitation forces of the solar system and by Jupiter in particular. Dr. Mackey, in his 2007 review of Dr. Fairbridges' work*, predicted the cooling this year and said that this and the next 4 years were the test years for the hypothesis. I (as in my hypothesis) expected the strong La Nina based on the Fairbridge hypothesis because 2+2 usually equals 4. It is the logical result of gravitational forces playing with magma circulation which is signalled by (not caused by, but having the same cause as) low sunspot activity. * Rhodes Fairbridge and the idea that the solar system regulates the Earth’s climate Richard Mackey Canberra ACT 2600 Australia epitrochoid@hotmail.com Journal of Coastal Research SI 50 955 - 968 ICS2007 (Proceedings) Australia ISSN 0749.0208
    0 0
  16. Hi John: interesting post (I am familiar with the Canadian side of the Arctic - having spent some time there). I have been following the ice formation here http://igloo.atmos.uiuc.edu/cgi-bin/test/print.sh?fm=06&fd=10&fy=2007&sm=06&sd=10&sy=2008 and to me it looks like we are on for another low year this year. I wish I had taken William up on his offer of a bet!! ;-) JOhn
    0 0
  17. chris BTW - Thanks for the 2005_Hansen_et.al. link. A little dated but interesting. Re: "Which "most recent paper"? In what way does it "indicate(s) exactly the opposite of what (I) indicate"?" Please see C. W. Stjern, J. E. Kristjánsson, and A. W. Hansen, 2008a>
    0 0
  18. Quietman, you're wandering way away from the subject of this thread which is the massive attenuation of Arctic sea ice during the summer of 2007. Straightforward scientific analysis provides a self-consistent interpretation in terms of global warming resulting from enhancement of the Earth's greenhouse effect through massive greenhouse gas emissions (this has been the cause of the relentless attenuation of Arctic summer sea ice since the 1960's - see urls in my posts above), together with weather conditions (reduced cloudiness and increased solar LW downwelling) that are normally rather neutral in their effects on Arctic sea ice extent, but under conditions of greatly denuded sea ice, result in rather significant melting of greatly thinned ice together with strong warming albedo feedbacks (see the top post by John Cook, the article by Kay et al (2008) that John Cook links to and which we've both discussed, and my post #12). You're hinting at other things without showing us any evidence for these. For example: (i) in response to my statement: Chris: "However, volcanic activity in general results in transient cooling of the Earth's surface temperature" you say: Quietman: "No. That should be: Volcanic ERUPTIONS in general result in transient cooling from particulates but may be balanced by GHGs from the eruption (or not, depending on the nature of the eruption)." But that makes no sense at all. After all if we look at the entire high resolution atmospheric CO2 record of the last 2000 years [***] we can see that atmospheric CO2 concentrations haven't varied by more than a few ppm around a value of 278 ppm in the period before the mid 19th century. So whereas the particulates from volcanic eruptions might in theory be "balanced by GHG's from the eruption", in practice during at least the last 2000 years, this hasn't been the case. Thus all volcanic eruptions of interest in the topic of this thread have resulted in cooling due to atmospheric aerosols. That's also rather clear from direct analysis of the forcings from volcanic eruptions of the 20th century [*****] [***]Meure CM et al (2006) Law Dome CO2, CH4 and N2O ice core records extended to 2000 years BP Geophys. Res. Lett. 33 L14810 [*****] Hansen et. al. (2005): Earth's energy imbalance: Confirmation and implications. Science, 308, 1431-1435 http://pubs.giss.nasa.gov/docs/2005/2005_Hansen_etal_1.pdf (see Figure 1). The other problem with your assertion about "GHG's from the eruption" is that you've already asserted elsewhere that you don't believe in "CO2-induced AGW" (e.g. in post #9 on this thread). So what are these "GHG's from the eruption" that "balance" "transient cooling from particulates"? Presumably not CO2. After all if the 65 ppm of atmosphere CO2 added to the atmosphere by mankinds emissions hasn't contributed to global warming in your worldview, how can 0.01-0.5 ppm released in a volcanic eruption (that's about the amount released during individual volcanic eruptions of the last around 2000 years) "balance" ""transient cooling from particulates"? Likewise, you suggest that Dr Fairbridge's "hypothesis" allows you to "expect the strong La Nina" "because 2 + 2 usually equals 4". I have no idea what you mean by that. It doesn't seem very scientific at all. However you seem to be insinuating that Fairbridge's "hypothesis" has predictive value for La Nina's (and El Nino's?). Here's a list of the La Nina years in the period 1872 - 2000. I've taken these from Ross Cooper-Johnston's book "El Nino" (Hodder and Stoughton 2000; page xii). Please indicate either: (i) the scientific paper in which Fairbridge demonstrates an analysis that allows this series to be understood in terms of his "hypothesis"... or: (ii) the mathematic equation(s) based on planetary motions/cycles that encapsulates this series... or: (iii) your explanation of the manner in which this series (and the recent la Nina) can be explanied. Here's the La Nina years: 1872-1874 1875-1876 1879-1880 1886-1887 1889-1890 1892-1893 1903-1904 1908-1911 1916-1918 1919 1921 1922-1923 1924-1925 1933-1934 1938-1939 1942-1843 1945-1946 1948-1949 1949-1950 1954-1955-1956 1964 1967-1968 1970-1971 1973-1974 1975-1976 1984-1985 1985-1986 1995-1996 1998-2000 (we could now add early 2006 and late 2007)
    0 0
  19. Quietman, the Stjern et al paper in press that you url in your post #17 is pretty much consistent with my statement in post #12 concerning aerosols and solar irradiation reaching the surface (global "dimming"/"brightening"). I said: [[(ii) "solar brightening from lack of aerosols". Nope. The atmospheric aerosol load has increased rather significantly since the 1960's. Thus enhanced Arctic sea ice melt has increased despite the overall decreased solar irradiation reaching the surface. Rather than "solar brightening" we've actually had a bit of "solar dimming". e.g. see: Hansen et. al. (2005): Earth's energy imbalance: Confirmation and implications. Science, 308, 1431-1435 (see Figure 1). http://pubs.giss.nasa.gov/docs/2005/2005_Hansen_etal_1.pdf]] Which is what Hansen et al show in their 2005 paper concerning the contributions to the Earth's energy budget in the 20th century. In other words the atmospheric aerosol load has increased rather significantly since the 1960's. Likewise that's what Stjern et al show indirectly. If you look at their Figure 3, which is a composite of the surface solar irradiation combining data from 11 stattions in the high Northern latitudes (see page 25 of the manuscript that you linked to), the surface solar irradiation was around 115 Wm-2 in 1960 (somewhat higher earlier), and is around 107 Wm-2 at the end of Stjern et al's measuring period. In other words the rather persistent attenuation of Arctic sea ice (the subject of this thread!) under the influence of marked global warming since the 1960's[***] has occurred even while the surface solar irradiation has decreased due to an enhanced atmosperic aerosol load. [***]http://arctic.atmos.uiuc.edu/cryosphere/IMAGES/seasonal.extent.1900-2007.jpg
    0 0
  20. chris Actually I agreed with Kay et. al. 2008, in that it was natural. I disagreed with AGW being the cause of the thinning and explained why. In order to blame it on CO2 induced AGW you first have to prove that it exists and then you have to prove exactly what part of warming it causes. Hypothetically it should warm the poles first. But the same is true of the alternate hypotheses. The papers I have read on AGW are very interesting but make too many assumptions based on poor climate models. If those models were correct the warming should have continued at the same or higher rate but in fact it did not, proving the models to be invalid. The burden of proof is on the writer, not the writer's skeptics. That is how science works regardless of how the younger generations might like to change it. The Young Earth fundamentalsts do the same thing, make an assumption (age of the earth) and disprove any argument with that assumption. Not acceptable. We are talking about a hypothesis, not even a theory, far from being proven and getting farther every year for the past 10 years.
    0 0
  21. PS I already gave you the link to mackey's paper which gives the explanation of the hypothesis. Google Rhodes-Fairbridge and you can find his ideas quite easily. I do not remember where I found them anymore and he won't respond to e-mails. He died two years ago.
    0 0
  22. Re #20, Quietman Actually Kay et al (2008) didn't say it was natural. That's very clear from a reading of Kay et al. (2008) as outlined in detail in my post #8. John Cook's top article gives a good account of the view that is supported by the scientific evidence. You didn't explain why CO2-induced AGW can't have caused the thinning. You made some vague comments about roles for water vapour, solar brightening from reduced aerosols and vulcanism. However each of these is unsupportable by the scientific evidence (see my post #12). The very paper that you brought to our attention apparently to "support" your assertion about reduced aerosol load, actually shows the opposite (see my post #19). That's not skepticism... You talk about "proving" that AGW exists. But of course in science "proof" isn't really a helpful concept ("proof" is a mathematical/philosophical concept). The scientific evidence strongly supports the conclusion that massive release into the atmosphere of greenhouse gases sequestered from the short term carbon cycle for many millions of years, results in warming of the Earth's surface. The warming we've seen and the distribution of excess heat, and so on is entirely consistent with expectations. And we can understand the dramatic attenuation of Arctic sea ice in relation to long term greenhouse forcing (especially since the 1960's following widescale post-war industrialisation), with a large additional factor (increased LW downwelling amplified by albedo effects) resulting in a sharp increased melting during the summer of 2007. Notice that the assumptions of AGW have got virtually nothing to do with models. Notice also that there is no expectation within the well-supported phenomenon of greenhouse-induced warming that the Earth's surface temperature should increase monotonously each year, nor that the Earth's surface might not cool for a bit within a warming scenario, and so on. To make such assertions is to misrepresent the scientific evidence and its interpretations, and that also is not skepticism. If one needs to bring "Young Earth fundamentalists" into it, I suspect one really doesn't have an argument!
    0 0
  23. Quietman, re Fairbridge and his "hypothesis". I was surprised to read in your post #17, the comment: "BTW - Thanks for the 2005_Hansen_et. al. link. A little dated but interesting. No problem, btw! However I'm surprised you consider a 3 year old paper "a little dated". Since I didn't know of Fairbridge's theories before yesterday I had a look for his scientific publications in the database. I can't find any scientific paper by Fairbridge in the last 10 years on the subject of solar influences on climate. So everything by Fairbridge is "a little dated" (certainly so in relation to Hansen's paper published in 2005!) Fairbridge published a brief report in 1995 that seems related to this topic: Fairbridge RW, Haubold HJ, Windelius G (1995) "Potential of interplanetary torques and solar modulation for triggering terrestrial atmospheric and lithospheric events" Earth Moon and Planets 70 179-181. but clearly a "hypothesis" can't be fully expounded in 3 pages, and this brief paper has been cited only once in the last 13 years, and clearly hasn't made any impact in the field. His next "most recent" paper that relates to this subject seems to be: Shirley JH, Sperber KR, Fairbridge RW (1990) Suns inertial motion and luminosity; Solar Physics 127, 379-392. (18 years old; 5 citations in 18 years). ...and so on...so everything by Fairbridge seems "a little dated". The article that you linked to by Mackey isn't a scientific paper. It's a eulogy of Fairbridge by some statistician who hasn't published any science on climate change, and who uses his article to pursue the political argument that we shouldn't do anything about the problem of global warming, but should just carry on, let things take their course, and "adapt" ("Adaptive efficiency is the key"!). I would like to see the relevant articles by Fairbridge himself in which his "hypothesis" is expounded. Can you cite these? Let Fairbridge's work speak for itself! I would also like to see a description from you of the mechanisms by which the "hypothesis" of Fairbridge explains the marked attenuation of Arctic sea ice since the 1960's, and the massive excess attenuation of sea ice in the summer of 2007, and so on. After all, it's not very scientific to refer to some unspecified "hypothesis" as a "catch-all" explanation of everything climate-related (you said in post #13: "Thus far the cycles of the solar system's gravitational forcing has been the best explanation to date for climate change"), without explaining what this "hypothesis" is, and illustrating specifically how it pertains to the issue at hand (i.e. the attenuation of Arctic summer sea ice).
    0 0
  24. chris You appear to have a fundamentalist problem with reading comprehension - so I give up.
    0 0
  25. You're trying to evade Chris' questions Quietman. It is common on this site to provide links to science papers. Why don't you give links to peer-reviewed science papers pertaining to solar/planetary inertia/gravitation and their influence on the Earth's climate? If Mackey's paper is not a peer-reviewed science paper, it does not carry the weight that you attribute to it. What else is there? This: "If those models were correct the warming should have continued at the same or higher rate but in fact it did not, proving the models to be invalid." You seem to suggest that all noise should disappear from the natural system in order for the model to be valid. I don't think that's how it works.
    0 0
  26. Philippe I did that. I answered the question. I refuse to argue with circular logic.
    0 0
  27. There is nothing circular about this. The lack of publication clearly indicates that the "hypothesis" has not been scientifically investigated. Perhaps it deserves to be but as of now, there is no work in support of it. I don't see that you provided proof to the contrary anywhere in this thread. If you really have cites, present them. But once again, the Mackey paper is not a real paper. Do you also have an explanation as to why the hypothesis has failed to generate enthusiasm among planetary scientists and specialsts of the Sun?
    0 0
  28. You didn’t answer the question, Quietman. You linked to an article by one Richard Mackey (no scientific publications whatsoever on climate/solar-related topics – has he published any science?). This is a poor and unscientific piece of work in which Mackey copies stuff out of press releases [*], makes demonstrably incorrect assertions [**], misrepresents entire scientific fields by selective citation (“cherrypicking”) [***], and pursues a false description of the mainstream scientific view of solar contributions to climate [****] (see bottom of post for examples). Mackey cites only one relevant (to solar cycles and climate effects) scientific paper of Fairbridge (we can leave out the fine papers on sea levels, and the various book chapters that he cites). This is: FAIRBRIDGE, R.W. and SHIRLEY, J. H., 1987. Prolonged Minima and the 179-yr cycle of the solar inertial motion. Solar Physics, 110 191-220. I’ve read this just now. It’s a perfectly fine piece of work, and I’m surprised you feel reluctant or unable to summarize Fairbridge’s hypothesis, or to cite his relevant papers. However it highlights fundamental problems with your description of Fairbridge’s hypothesis as being “the best explanation to date for climate change”. Here’s two: (i) Fairbridge and Shirley’s (F&S) analysis applies strictly to solar minima. In other words periods of “abnormally” low solar output, as identified by sunspot number for example. So in their Figure 5 they plot their measure of solar output as a function of time, and overlay with shading, periods of low sunspot number (these correspond to the well-known Wolf, Sporer, Dalton minima). But that’s it. F&S’s analysis has nothing to say about periods of global warming. The sun is either in a “normal” state or it is in one of its periodic minima. Fairbridge’s hypothesis (at least as outlined in F&S) has nothing to say about the very large global warming of the last 30-odd years, let alone the dramatic attenuation of Arctic sea ice since the 1960’s. That should be the end of the story as far as the subject of this thread is concerned. We know full well that changes in solar outputs have made little contribution to warming of the last 30-odd years, so we can leave Fairbridge’s nice work out of a discussion of causal factors relating to dramatic Arctic sea ice attenuation. However F&S make a prediction for the next minimum and it’s interesting to see how this might work out: (ii) On their Figure 5 F&S also shade a period corresponding to a prediction (made tentatively) for the next minimum. The next period of abnormally low sunspot numbers starts near 1990 and goes to 2020 (the latest date of their analysis - although they suggest the next minimum will be more prolonged). We can test at least the early part of this prediction since we have access to the sunspot numbers, e.g. here: http://en.wikipedia.org/wiki/Sunspot or: http://www.spaceweather.com/java/archive.html (etc.) Clearly we haven’t been in a low sunspot number phase since 1990. In fact sunspot numbers have been very high throughout cycle 22 (peaking near 1991), and high throughout cycle 23 (peaking near 2002). We don’t know what is going to happen very far into the future. However geomagnetic activity seems to be a very good predictor of subsequent sunspot cycle activity, and cycle 24 due to peak near 2013, is predicted to be a high sunspot number cycle: http://science.nasa.gov/headlines/y2006/21dec_cycle24.htm although others think it will be weaker: http://www.lund.irf.se/rwc/cycle24/ Now maybe the sun will enter a period of prolonged reduced output. But so far it hasn't, and the marked recent warming was entirely independent of the analysis/hypothesis of Fairbridge anyway. -------------------------------------------------------- some deficiencies in Mackey's eulogy of Fairbridge that you linked to in your post #15 [*] I was interested to read what Mackey had to say about sea levels, and this odd non-sciency sentence jumped off the page (see top of second column on page 961), referring to Baker’s work on sea level fluctuations): [“ BAKER et al (2005) have been collaborating on the project for the past eight years and have published nine papers in scientific journals in relation to it.”] That seems an odd thing to say in a scientific paper, so had a look to see whether it might be a “second hand” statement. It’s copied out of a press release. Here’s the sentence from the press release: http://www.une.edu.au/news/archives/000327.html [“The UNE scientists, Dr Baker, Dr Robert Haworth and Professor Peter Flood - have been collaborating on the project for the past eight years and have published nine scientific papers in international journals.”] …and examination of the previous paragraph of Mackey’s article shows more of this low grade plagiarism that is characteristic of the lazy or poorly-informed. [**] The following section from page 961 (bottom of left hand column). I’ll leave the reader to consider whether this has any merit: [“As SCAFETTA and WEST (2006b) report, increased solar activity warms the oceans, increases the volume of water vapour and carbon dioxide in the atmosphere and reduces the oceans’ uptake of water vapour and carbon dioxide from the air. As a result, some of the atmospheric carbon dioxide that has been attributed to human activity may have a solar origin. The resultant release of more water vapour and carbon dioxide into the atmosphere may have contributed to the warming that is already the direct result of increased solar output, variations in the sun’s gravitational force and interactions between the two. It is to be hoped that in its next series of publications the IPCC will quantify the proportion of greenhouse gases that have been produced by the sun in this manner.”] [***] Cherrypicking is rampant throughout Mackey’s article: Since I was surprised to read of Mackey’s assertions about late Holocene sea level variations: [“…even within the past thousand years, there have been several sudden changes in sea levels of up to two metres. The UNE team has discovered that each of these large changes took less than 40 years from beginning to end.”] I had a read of Richard Bakers paper (very nice too), but also some of the more recent analyses of Holocene sea level changes (e.g. Lewis et al 2008). It turns out that Baker’s work is only one of many studies of late Holocene sea levels, and that in general the evidence for large variations in Holocene sea levels are not well-supported. In fact Sloss et al (2007) indicate that Baker’s very large apparent fluctuations relate to their method (parapharising) of 14C-dating marine organisms found at various heights above present mean sea level, and assuming that defines the sea level height at the time identified by the 14C date, without making corrections for possible changes in tidal ranges, wave climate and so on. Whatever the final story on this, Mackey gives an entirely false representation of the subject by focussing on one piece of work that supports his “thesis”. S. E. Lewis et al (2008) Mid-late Holocene sea-level variability in eastern Australia; Terra Nova, Vol 20, No. 1, 74–81 C. R. Sloss et al (2007) Holocene sea-level change on the southeast coast of Australia: a review; The Holocene 17; 999-1014. [****] This can be stated succinctly. Mackey pursues the tired fallacy of pretending that because mainstream science shows no significant role for changes in solar outputs in the very marked warming of the last 30-odd years, that mainstream science (and the IPCC!) are ignoring the sun and downplaying it’s role as an influence on the Earth’s climate.
    0 0
  29. I'm surprised no one mentioned the role of albedo loss to dirty snow from soot deposition: Here: http://www.scientificblogging.com/the_soot_files/soot_black_icebergs_and_arctic_ice and: http://www.sciencedaily.com/releases/2006/03/060319183843.htm Soot is the carbon that must not be named....
    0 0
  30. And that soot is man-made, is it not?
    0 0
  31. Phillippe and chris Here are the abstracts from two recent papers that support natural forcing and question the effect of AGW. Solar-Cycle Warming at the Earth’s Surface and an Observational Determination of Climate Sensitivity. By Ka-Kit Tung and Charles D. Camp Department of Applied Mathematics, University of Washington, Seattle Washington, USA The total solar irradiance (TSI) has been measured by orbiting satellites since 1978 to vary on an 11-year cycle by about 0.07%. From solar min to solar max, the TSI reaching the earth’s surface increases at a rate comparable to the radiative heating due to a 1% per year increase in greenhouse gases, and will probably add, during the next five to six years in the advancing phase of Solar Cycle 24, almost 0.2 °K to the globally-averaged temperature, thus doubling the amount of transient global warming expected from greenhouse warming alone. Deducing the resulting pattern of warming at the earth’s surface promises insights into how our climate reacts to known radiative forcing, and yields an independent measure of climate sensitivity based on instrumental records. This model-independent, observationally-obtained climate sensitivity is equivalent to a global double-CO2 warming of 2.3 -4.1 °K at equilibrium, at 95% confidence level. The problem of solar-cycle response is interesting in its own right, for it is one of the rare natural global phenomena that have not yet been successfully explained. Phenomenological reconstructions of the solar signature in the Northern Hemisphere surface temperature records since 1600 N. Scafetta1 and B. J. West2 Received 18 January 2007; revised 4 May 2007; accepted 5 June 2007; published 3 November 2007. A phenomenological thermodynamic model is adopted to estimate the relative contribution of the solar-induced versus anthropogenic-added climate forcing during the industrial era. We compare different preindustrial temperature and solar data reconstruction scenarios since 1610. We argue that a realistic climate scenario is the one described by a large preindustrial secular variability (as the one shown by the paleoclimate temperature reconstruction by Moberg et al. (2005)) with the total solar irradiance experiencing low secular variability (as the one shown by Wang et al. (2005)). Under this scenario the Sun might have contributed up to approximately 50% (or more if ACRIM total solar irradiance satellite composite (Willson and Mordvinov, 2003) is implemented) of the observed global warming since 1900. Citation: Scafetta, N., and B. J. West (2007), Phenomenological reconstructions of the solar signature in the Northern Hemisphere surface temperature records since 1600, J. Geophys. Res., 112, D24S03, doi:10.1029/2007JD008437.
    0 0
  32. No that's wrong again, Quietman. You should read the papers that you dump before dumping them. And considering that we were discussing Arctic sea ice, and Fairbridge and Mackey, and aerosol contributions and volcanism and so on, I don’t really understand the point of changing the subject with these papers. In any case, neither of them says much that is against the mainstream science; Tung and Camp, especially, is completely in accordance with the scientific determination of the Earth’s equilibrium temperature response to manmade enhancement of the greenhouse effect (enhanced [CO2]!). Tung and Camp attempt to tease out the solar cycle contribution to the Earth's surface temperature. Obviously as the sun goes through its solar cycle (a complete "warming-cooling-warming" cycle every 11-ish years), the Earth must respond to some extent. Tung and Camp suggest that they can pull out a temperature variation of 0.018 oC between the solar minimum and maximum. That's a little larger than others find (~ 0.1 oC), but obviously the Earth's surface temperature must respond a little to the small change in solar output during the solar cycle, even if this response at the surface is damped (relative to the tropospheric response, for example). But there's nothing too remarkable about that and the paper neither particularly "supports natural forcing" nor does it "question the effect of AGW". In fact it completely supports the latter. Tung and Camp use their data to determine an independent measure of the Earth's "climate sensitivity". This is 2.3 - 4.1 oC per doubling of atmospheric [CO2] at 95% confidence. That's pretty much exactly what everyone else finds, and is pretty much exactly what I said earlier on this thread (e.g. 3 oC +/- a bit; see my post #12). In other words Tung and Camp are completely mainstream about AGW. They consider that manmade enhancement of the Earth's greenhouse effect causes warming equivalent to around 3 oC (2.3 - 4.1 oC at 95% confidence) per doubling of atmospheric CO2 (or CO2 equivalents). They support the conclusion that the fact that we've been near, or at the bottom of the solar cycle for the last couple of years, is a significant contribution to a temporary slow down of greenhouse-induced warming, and that as the solar cycle heads upwards through the next 5 or 6 years, the solar cycle effect will be adding to the greenhouse effect for a while, rather than countering it. There's nothing surprising there. We already know that. To spell out the obvious: Continual enhancement of the Earth's greenhouse effect produces a rather persistent, unidirectional increase in the Earth's surface temperature as the climate system tries to equilibrate at an ever-increasing greenhouse forcing. On top of this is a cyclic contribution (warming-cooling-warming-cooling) from the solar cycle. So the AGW greenhouse temperature forcing is “positive…positive…positive…”, whereas the solar cycle gives “positive…negative…positive…negative…positive” in a nice sinusoidal cycle (net contribution over the last 50 years pretty close to zero). In general we would look at the temperature record and consider that we can't really "see" the solar cycle contribution: e.g. http://data.giss.nasa.gov/gistemp/2007/ Tung and Camp consider that they can "tease it out"....fine!... The Scafetta and West paper is a mathematical analysis of the historical solar irradiance record in which a phenomenological (i.e. theoretical/empirical) possible solar contribution to 20th century warming under the assumption that all temperature variations in a (pre-industrial) test period were solar-induced. They suggest that in this theoretical analysis the sun "might" have contributed "approximately" "up to" 50% of 20th century warming. Fair enough. The sun "might" have contributed anywhere from zero to 50% of warming. We know that the sun has made no significant contribution to the marked warming of the last 30-odd years...we are pretty sure that the sun made some contribution to the warming in the early part of the century. Perhaps the solar contribution was 10-20% of 20th century warming, largely focussed in the period 1900-1940ish. I don't think anyone would quibble with that either. It’s a statistical/mathematic exercise. The authors are suitably circumspect about the nature of their phenomenological conclusion.
    0 0
  33. leebert, a paper cited a couple of times on this thread highlights all of the forcings including those from black carbon, so the soot isn't being swept under the carpet! i.e.: Hansen et. al. (2005): Earth's energy imbalance: Confirmation and implications. Science, 308, 1431-1435 http://pubs.giss.nasa.gov/docs/2005/2005_Hansen_etal_1.pdf (see Figure 1) (and see updated version below [***]; Figure 5 on page 26} The soot (black carbon) seems to be a little complex. McConnell et al [*] published data from Greenland ice cores that show that by far the greatest effects of black carbon on Artic ice occurred in the period rising from around 1900 to 1930, and then dropping back down to low levels by 1950, with occasional pulses (due to forest fires) from then. So the dominant effects of black carbon on Arctic ice albedo were in the early to mid 20th century, and perhaps that was a significant contribution to the Arctic warmth in the early part of the 20th century. The median estimated surface forcing (during early summer) was around 0.42 W/m2 before 1850, and was around 1.13 W/m2 in the period 1850-1951, with values as high as 3.2 Wm2 in the early 20th century. It’s been around 0.59 W/m2 since 1951 to present. [*] J. R. McConnell et al (2007) 20th-century industrial black carbon emissions altered arctic climate forcing; Science 317, 1381-1384. Albedo effects of black carbon on snow/ice seem rather more problematic for the Himalayas/Tibetan plateau/NE China regions (consistent with a dominant source for black carbon in Asia), where black carbon albedo forcings can reach 4.5 W/m2. [**] [**] J. Ming et al (2008) Black carbon record based on a shallow Himalayan ice core and its climatic implications; Atmospheric Chemistry And Physics 8, 1343-1352. Hansen et al (2007) estimate a contribution of black carbon/ice albedo effects of 0.065 oC to total global warming since the start of the industrial age [***]. This would obviously be larger locally (where the snow/ice is!), but the albedo effects act only during part of the year and at least for the Arctic were predominant in the period up to the 1950’s (see [*]). [***] Hansen, J et al. (2007) Climate simulations for 1880-2003 with GISS modelE. Clim. Dynam., 29, 661-696. http://pubs.giss.nasa.gov/docs/2007/2007_Hansen_etal_3_small.pdf Everyone agrees that it would be good if ice albedo-reducing black carbon could be eliminated, as a means of slowing down the effects of greenhouse-gas-induced warming: e.g.: [“Arctic warming is primarily a manifestation of global warming, such that reducing global-average warming will reduce Arctic warming and the rate of melting (IPCC 2007). Reductions in the atmospheric burden of CO2 are the backbone of meaningful efforts to mitigate climate forcing. But even if swift and deep reductions were made, given the long lifetime of CO2 in the atmosphere, the reductions may not be achieved in time to delay a rapid melting of the Arctic. Hence the goal of constraining the length of the melt season, and, in particular, delaying the onset of Spring melt, may best be achieved by targeting shorter-lived climate forcing agents, especially those that impose a surface forcing that may trigger regional scale climate feedbacks pertaining to sea ice melting.”] [****] [****] Quinn, P. K. et al (2007) Short lived pollutants in the Arctic-their climate impact and possible mitigation strategies. Atmos. Chem. Phys. 8, 1723-1735. The situation seems complicated by the fact that different sources of soot can have different directions of forcing, and the total aerosol load is actually protecting us somewhat from the full effects of greenhouse-gas induced warming. So (referring to Figure 28 in Hansen et al (2005) [*****; note that Hansen’s papers are useful since they’re freely downloadable!]), soot from fossil fuel burning has a positive (warming) forcing whereas soot from biomass burning has a negative (cooling) forcing, apparently. Non-soot aerosols provide a strong negative cooling forcing. The total effect of soot on global warming seems to be about nett neutral worldwide (‘though presumably net positive in regions with snow). So it seems one would have to be rather careful to eliminate just those components of the aerosol burden that gives rise to positive forcings. [*****] Hansen, J. et al. (2005) Efficacy of climate forcings; J. Geophys. Res., 110, D18104 http://pubs.giss.nasa.gov/docs/2005/2005_Hansen_etal_2.pdf The following paper also seems relevant; however it’s very dense! It’s a modelling paper and seems to be general in accordance with those cited above. M. G. Flanner et al (2007) Present day climate forcing and response from black carbon in snow; J. Geophys. Res. 112, D11202 The more specific question of the contribution of black carbon to Arctic sea ice recession seems difficult to hunt down. Note than the guy in your press release (Zender) is an author on both Flanner et al (2007) just above, and paper [*]. He seems to suggest that it’s around 33% now….however I haven’t found a clear-cut analysis in a published paper. That’s not to suggest there isn’t one!
    0 0
  34. Chris: Soot's role in the Arctic has been widely discussed since 2001, so yes, it's not really news. Except that the environmental activists do not mention it, they do not want a discussion on soot to divert attention from CO2. So what if two of the top researchers in the field are in agreement about the efficacy of soot mitigation in at least slowing the boreal thaw? What if we can't abate CO2 fast enough to forestall any warming that poses any real risk? Or what if CO2's future effects aren't as profound as the worst-case forecasts? In both cases failing to mitigate soot would be a huge error. So yes, it's been swept - politically - under the rug. And it stinks. And as for the net warming from tropospheric soot (Ramanthan, Carmichael, 2008) their study shows that worldwide - across the vast Pacific basin and elsewhere - soot in conjunction with sulfates are not *masking* CO2's warming effect, they are in fact "enhancing it." That's a very nice way of saying aersols have falsely IMPLICATED CO2 by a 35% margin. Both Ramanathan *AND* Carmichael have conceded that the presumed cooling effect of aerosols in the 1970's is only a popular guess and could well be wrong. As early as 2001 researchers have been citing warming anomalies in the Asian Brown Clouds. In 2003 Ramanathan's INDOEX work got spanked by the IPCC at the behest of the Indian & Chinese gov'ts. So again, it *has* been swept under the rug. And it stinks.
    0 0
  35. Philippe Chantreau: Soot and CO2 are not fungible and no one should pretend they are.
    0 0
  36. Philippe Chantreau: Soot and CO2 are not fungible and no one should pretend they are.
    0 0
  37. Chris: > The total effect of soot on global warming > seems to be about nett neutral worldwide > (‘though presumably net positive in regions > with snow). So it seems one would have to > be rather careful to eliminate just those > components of the aerosol burden that gives > rise to positive forcings. Sorry but the latest studies are showing that soot-ladened aerosol clouds (mid-tropospheric brown clouds) have a net positive forcing, with a Pacific-wide effect alone of 40 percent (that's be 12% of all global warming anomalies right there). And the big surprise: Sulfates are pushing NIR into the soot particles, driving the extra heating. So much for that shading and masking effect, eh? Ramanathan & Carmichael (2008) are seeing a global effect that's 60 percent of CO2's (a 37/53 mix). Read their paper, the effect has been masked both from surface temperatures and satellite. Ramanathan's point: We buy a 20 year window of opportunity from mitigating soot. The conventional view that brown clouds had a net masking effect are being shown to be completely wrong and it took Ramanathan's robot planes to find it, not satellites, not ground instruments, not climate models, not educated guesses. He was surprised when the data showed the effect, so he had his team at Scripps double-check the results. There's nothing like real field data taken in situ, now is there? Shall we exculpate CO2 by the same margin that aerosols were used to implicate it (via masking)? Here's a question: What do sulfates and nitrates become when they hit the ocean?
    0 0
  38. Agreed. I did not pretend such thing. Black carbon is nonetheless anthropogenic. If you want to nitpick words and argue that John's post was restricted to natural vs. CO2 only driven AGW, go ahead.
    0 0
  39. leebert, I only partially agree with your interpretation of Ramanathan and Carmichael’s work. It’s clear that the man-made aerosol burden including black carbon (BC) and atmospheric brown clouds (ABC’s) is providing a large nett negative (cooling) effect on the Earth’s surface temperature which is making quite a large contribution to partially offsetting man-made global warming. The Earth would be warmer still without man-made aerosols and ABC. This is pretty straightforward interpretation in Ramanathan and Carmichael’s (R&C) review. R&C do consider that BC alone has a nett warming contribution; however it’s not obvious that one could selectively eliminate BC in isolation, without removing some of the cooling aerosol contributions too. Here’s what I consider some of the pertinent points form R&C’s review: V. Ramanathan & G. Carmichael (2008) Global and regional climate changes due to black carbon; Nature geoscience 1, 221-227. (1) In Table 2 R&G diagram the contributions from various man-made greenhouse gas (GHG) and man-made aerosols, considering the effect on both the atmosphere or surface: all GHG’s (CO2, methane, N20, halons, ozone): atmosphere +1.4 surface +1.6 total +3.0 (W/m2 presumably) CO2: atmosphere +1.0 surface +0.6 total +1.6 black carbon (BC): atmosphere +2.6 surface -1.7 total +0.9 non BC man-made aerosols: atmosphere +0.4 surface -2.7 total -2.3 (2) Total man-made aerosols including that of BC are strongly nett cooling. One would need to eliminate BC selectively to mitigate part of global warming, and this would effectively be a “one-off” contribution. As R&C say (page 226, column 1): “It is important to emphasize that BC reduction can only help delay and not prevent unprecedented climate change due to CO2 emissions.” (3) The problem is outlined explicitly by R&C (p 226 column 1): “The logical deduction from Fig 2a,c,d is that elimination of present day ABCs through emission strategies would intensify surface warming by 0.4 to 2.4 oC. If only the non-BC aerosols were controlled, it could potentially add 2.3 W/m2 to the TOA forcing and push the system closer to the 3 oC cumulative warming (since 1850s), which is a likely threshold for unprecedented climate change.” (4) however (the good news!): “If on the other hand, the immediate target for control shifts entirely to BC (owing to its health impacts) without a reduction in non-BC aerosols, the elimination of the positive forcing by BC will decrease both the global warming and the retreat of sea and ice glaciers.” (5) So overall elimination of BC would be a good thing, as much as for anything else due to the health benefits – R&C point out that over 400,000 fatalities annually among women and children result from smoke inhalation from indoor cooking, a strong source of atmospheric aerosols including BC. (6) R&C point out that this isn’t straightforward (p 226, column 2): “However changes in BC alone do not tell the entire story as the climate response also depends on how the BC to non-BC aerosol fraction responds to future emissions. As BC is co-emitted with non-BC aerosols, it is necessary to evaluate how various mitigation strategies impact this fraction.” (7) Other points: (i) R&C highlight as do the other groups cited in my post above, that (relevant to the subject of this thread) the BC effect on ice albedo is particularly pronounced in Asia (Himalaya;Tibetan plateau;NE China). (ii) R&C’s analysis support the effect of aerosols and ABC’s in producing widescale global “dimming” (see discussion on p. 223, column 1). The dimming is particularly strong from atmospheric brown clouds. (iii) As far as I can see the overall effect of atmospheric brown clouds for global warming seems to be overall cooling. Regionally ABC cause surface cooling while warming the atmosphere in the winter and spring.
    0 0
  40. Having just read your post #37, according to Ramanachan and Carmichael, this statement of yours is quite incorrect: ["Sorry but the latest studies are showing that soot-ladened aerosol clouds (mid-tropospheric brown clouds) have a net positive forcing, with a Pacific-wide effect alone of 40 percent (that's be 12% of all global warming anomalies right there). And the big surprise: Sulfates are pushing NIR into the soot particles, driving the extra heating. So much for that shading and masking effect, eh?"] That's clearly incompatible with Ramanachan's and Carmichaels statement (p. 226, column 1). “The logical deduction from Fig 2a,c,d is that elimination of present day ABCs through emission strategies would intensify surface warming by 0.4 to 2.4 oC." (ABC being atmospheric brown cloud). Obviously if elimination of atmospheric brown clouds would result in an intensification of surface warming by 0.4 to 2.4 oC, then atmospheric brown clouds must be having a cooling contribution, acting to offset some of the warming due to man-made greenhouse gas enhancement.
    0 0
  41. oops! I've started calling Ramanathan "Ramanachan"! Apologies to Dr. Ramanathan..
    0 0
  42. Chris, The intent of my statement is not incompatible with Ramanathan & Carmichael, however, I will clarify: I'm not objecting to the "shading" effect, like I wrote, we're talking "net," (heating minus shading); I'm objecting to "shading and masking" as in the conventional view that ABCs were masking CO2's effects. This view still gets currency amongst ardent environmentalists and its very hard to get them to even read the news releases and change their minds. The point I'm making is that b/c of inadequate instrumentation on the surface & TOA all the effects of ABC looked like shading. Instruments looking at TOA can't see that it's brown clouds instead of CO2. So the real masking effect was only from field instruments being able to see the real effect at altitude. And even though the *NET* effect from sooty brown clouds is still warming, the shading effect in the ABC also causes regional droughts b/c it slows ocean surface evaporation, interrupting regional hydrological cycles. Here, this might help: http://www.latimes.com/news/printedition/asection/la-na-carbon25mar25,1,6570023.story "...The report concludes that the atmospheric warming effect of black carbon pollution is as much as three to four times the consensus estimate [emphasis mine] released last year in a report by the U.N.-sponsored Intergovernmental Panel on Climate Change." "...The paper concludes that carbon pollution contributes to global warming at a level that is about 60% of carbon dioxide's warming effect.." "...A mass of black carbon in the atmosphere causes about 300,000 times as much instantaneous warming as the same amount of carbon dioxide." The seasonal and regional extent of ABC's is confusing. Another study from Scripps indicated that 40% of the warming over the entire Pacific was from brown cloud, the net, annual effect is still a real warming. “It is important to emphasize that BC reduction can only help delay and not prevent unprecedented climate change due to CO2 emissions.” Yes, that is correct. I don't necessary agree with the overall CO2 science that claims a precipitous tipping point (that's another discussion) but I'm fine with CO2 driving warming. My point is that brown clouds were thought to contribute a net cooling effect b/c of the reflectivity of sulfates. The problem is that the white reflective sulfates, although they do impart albedo at the cloud tops, actually DRIVE near-IR right into the soot particles. At current mix ratios of soot:sulfates the heating effect is very pronounced while also causing droughts, depositing heavy metals, reducing ice albedo, etc. This is enough for Ramanathan to stress that a 20-year window of opportunity can be opened against any real risk that CO2-driven warming might pose. If you think the risk is high then our first order of business is to mitigate soot while we sort out the economic critical path of CO2 mitigation (a crash program will be expensive, the Stern Report's glowing forecasts are quite unlikely, it fails to account for loss of competitiveness & already high gov't taxes in Europe - already the EU is grappling with this and Japan says they can't afford the Kyoto targets). If, OTOH, the risk is moderate, a midpoint from the low end of the forecasted warming, then soot abatement may provide yet more proportional relief, esp. to the boreal environment. Please understand that Ramanathan is a very conventional AGW researcher and he's gone against conventional thinking on the matter & is pushing this pretty hard. I'm afraid the issue is being ignored for political purposes on both sides, the industrial apologists for obvious reasons, the environmental activists b/c their afraid that soot will dilute the message on CO2. This angers me quite a bit & would put=s the lie to a lot of their rhetoric about the polar bears if one doubts the sincerity of the activists. If the risk is high and the polar bears matter, and the odds are poor humanity can curb CO2 against any real risk that GHG pose, then the first order of business would be to mitigate soot. And I know the activist org's know this b/c I've read their news blogs about soot & Arctic albedo (EDF, WWF...). So it's really time the environmental groups stopped playing games name soot in its own right & stop conflating "carbon emissions" as though all are GHGs. It's obvious chicanery and it's undermining their credibility, badly for anyone who is realistic and is concerned about the worst-case scenarios (3 degrC) or the climate moderates who see a moderate case of 1.7 degrC at 580 ppm. The skeptics see it as impugning the whole case against CO2, in my case I see a partial exculpation of CO2 in terms of political reality, that the oft-claimed "masking effect" from aerosols was wrong and used to demonstrate current warming as solely from GHGs. Understand there's a dark political reality behind the entire soot business. Ramanathan's INDOEX work had its funding clipped at the behest of the Indian & CHinese gov't lobbying against his work. It was restored, but not first w/out a fight. Ramanathan mused publicly over the political messiness of climatology science w/in the field. We all should take that point thoughtfully.
    0 0
  43. And again: What do sulfates and nitrates become when they hit the ocean?
    0 0
  44. chris I do read the papers, but I do not read into them, just the facts, not conclusions based upon some faith in a root cause.
    0 0
  45. leebert, yes and no again! According to Ramanathan and Carmichael (R&C) the nett effect of atmospheric brown clouds (ABC) is cooling. They say: “The logical deduction from Fig 2a,c,d is that elimination of present day ABCs through emission strategies would intensify surface warming by 0.4 to 2.4 oC." (ABC being atmospheric brown cloud)." in other words if you take away the atmospheric brown clouds the Earth gets a bit warmer. So atmospheric brown clouds are partially offsetting the warming that results from anthropogenic increases in greenhouse gasses. After all global warming relates to the Earth's surface (land and ocean). That makes sense because that's where the Earth's biota (us included!) resides. I agree with you that the shading effect in the ABC seems also to cause regional droughts b/c it slows ocean surface evaporation, interrupting regional hydrological cycles. R&C say exactly that in their review (cited in my post #39). But I don't agree with you that the "masking effect" from aerosols is wrong. According to all the published energy balances, the nett effect of atmospheric aerosols, including soot and atmospheric brown clouds is a cooling one. Therefore aerosols “en masse” are rather significantly, partially "offsetting" the effects of manmade greenhouse gas emissions. That's clear from R&C's data in their Table 2 (numbers reproduced in my post #39) and in Hansen's energy balance "budget"): Hansen et. al. (2005): Earth's energy imbalance: Confirmation and implications. Science, 308, 1431-1435 http://pubs.giss.nasa.gov/docs/2005/2005_Hansen_etal_1.pdf (see Figure 1) and: Hansen, J et al. (2007) Climate simulations for 1880-2003 with GISS modelE. Clim. Dynam., 29, 661-696. http://pubs.giss.nasa.gov/docs/2007/2007_Hansen_etal_3_small.pdf (see Figure 5). On a couple of other points: (i) tipping points: I was just quoting R&C there! But they didn't mention tipping points. They talked about "unprecedented climate change". Of course one should ask "unprecedented" in what sense? It would certainly be unprecedented with respect to the Holocene... (ii) Ramanathan’s funding/politics. It’s perhaps not surprising that there was a bit of a hoohaw about Ramanathan’s INDOEX findings. Political sensibilities were strained. The developing nations, especially India, Pakistan and Indonesia felt that the developing world was being singled out. But Ramanathan isn’t doing badly. He's well funded and his work is considered important and seems to be widely respected. He is director of the Center for Cloud, Chemistry and Climate. He oversaw $25 million of funds for the INDOEX study..his Center seems to be well funded by the National Science Foundation amongst others. Despite the political nonsense the United Nations environmental Programme funded his follow up Atmospheric Brown Cloud Project. He’s presently pursuing corporate sponsorship for Project Surya to do a fairly large scale pilot study in converting cooking practices in rural India to non-soot emitting methods and so on… (iii) So I think you’re wrong about the nature of the politicking. It’s not about trying to pretend that global warming is all about greenhouse gas emissions. Because global warming really IS pretty much about greenhouse gas emissions. However if some reduction of black carbon emissions is effected through the efforts of Ramanathan et al then so much the better. But I don’t think we should turn Ramanathan’s work into a “cause celebre” for “skepticism” or for conspiracy theorising. And as Ramanathan and Carmichael state in their review, we need to be careful in dealing with aerosol emission reduction, since across the board cut backs of aerosols (black carbon, aerosols, atmospheric brown clouds et al) will only exacerbate the problem. (iv) as for your question about sulphates and nitrates? I would say that emissions of sulphurous and nitrous oxides into the atmosphere result rather quickly in their conversion by hydration into sulphurous (esp sulphuric) and nitrous (esp nitric) acids that within a short period are washed out of the atmosphere into the oceans and onto the land surface. They cause acidification.
    0 0
  46. Quietman, That makes no sense again. One can't just quote/cite stuff and assume that the paper is actually about what you hope it might be about! You need to read it. So far on this thread you've: (i) asserted that my statement about aerosols is incorrect, because (according to you) "The most recent paper on Solar Dimming / Brightening indicates exactly the opposite of what you indicate." However, on reading the paper that you cite one finds it does no such thing (see my post #19) (ii) asserted that (according to you) "RW Fairbridge's "hypothesis" "has been the best explanation to date for climate change". However, on reading Fairbridge's work one finds it has nothing whatsoever to say about the very marked warming of the last 30-odd years (see my post #28), let alone Arctic sea ice attenuation. (iii) asserted that a eulogy of Fairbridge by some statistician who has never published anything on climate-related, or solar-related science, provides a valid description of a hypothesis on solar contributions to climate. However on reading Mackey's article, one finds that it's a non-scientific and rather disgraceful effort (see my post #28 - numbered points below dotted line). (iv) asserted that a rather straightforward paper by Tung and Camp on the solar cycle and an analysis of the Earth's temperature response to enhanced [CO2] "questions the effect of AGW". However on reading the paper we find that Tung and Camp are in complete agreement with mainstream science on AGW, and calculate a climate sensitivity of 2.3-4.1 oC of warming per doubling of atmospheric [CO2], that is in complete agreement with the rest of the mainstream science (see my post #32). ....and so on... The point is that we can't just say stuff and hope that it might be a valid representation of what people actually discover and publish. One may as well read the work and find out what the data shows and what the authors are trying to say. All science is about skepticism, but skepticism only has meaning in relation to an honest and informed acquaintance with the science. Otherwise it's not skepticism...it's something else like conspiracy theorising...or denialism..or some other thing with a less than honourable connotation...
    0 0
  47. Chris: I think you're getting hung up on one aspect of the aerosol problem. I think you might be mixing apples & oranges. The heating effect of *brown clouds* is different from all aerosols. IOW, "white cloud" aerosols (sulfates) that lend net albedo to the air are offsetting a great deal of warming that'd happen otherwise. In those regions where whitish aerosols dominate the warming trend at the surface *IS* indeed offset & masked. That's OK. The actual problem is the soot & sulfate mixed brown clouds that in fact are said to enhance warming. So the aerosol sources have to have a strong BC mix in order to lend to a net warming effect. IOW airborne soot, once at altitude, causes vast interzonal and intermeridional forcings throughout SE Asia & the vast Pacific. The problem comes down to knowing what the extent of brown clouds vs. white aerosol clouds are, and the constraints of the white aerosol-dominated clouds are poorly quanitifed at this point in time. Just as with the 1970's, the *REAL* in-cloud effect is less known than the TOA & surface data. And, FWIW, this also goes for rainclouds as well. Why would R&C's paper state: “It is important to emphasize that BC reduction can only help delay and not prevent unprecedented climate change due to CO2 emissions.” The operative word here is "delay." I can understand the reservations but Hansen is not caught up on this, AFAIK. IPPC AR5 us purported to better reflect this. This will help put this into perspective: "The conventional thinking is that brown clouds have masked as much as 50 percent of the global warming by greenhouse gases through the so-called global dimming ... This study reveals that over southern and eastern Asia, the soot particles in the brown clouds are intensifying the atmospheric warming trend caused by greenhouse gases by as much as 50 percent." http://www.scienceagogo.com/news/20070701162100data_trunc_sys.shtml http://scrippsnews.ucsd.edu/Releases/?releaseID=777 "...On a regional level, that amount of heating, or positive radiative forcing, the black carbon causes in the skies over the Pacific is about 40 percent of the forcing that has been attributed to the carbon dioxide increase of the last century.." As for the activists, they will not mention soot.
    0 0
  48. leebert, someone seems to be mistaking their apples for the oranges! I'm not saying it isn't me...however I'm sitting here with Ramanathan and Carmichael's review in front of me, and what you say just doesn't seem to accord with what they say... I think the problem is that in the press release quotes that you are reproducing, the speaker/author is talking only about the atmospheric warming effect. However that's only part of the story. The surface effects have to be taken into account too. It's the total effect that is relevant when one considers the contribution to the Earth's surface temperature. If total aerosols (brown clouds/black carbon included) warm the atmosphere by a total of 2.8 W/m2 and cool the surface by a total of -4.4 W/m2 (through reduced solar irradiance at the surface; that's what Ramanathan and Carmichael show in their table 2 - I've reproduced the numbers again below [*****]), then if we're interested in the effect of aerosols on global warming, we need to consider both the atmospheric and surface effect. The total effect is to cool the Earth and to offset the warming contribution of atmospheric greenhouse gasses (nett effect of all atmospheric aerosols is a cooling of -1.4 W/m2). We can quote Ramanathan and Carmichael directly (p 222, column 2): ["At the top of the atmosphere (TOA), the ABC (that is BC + non-BC) forcing of -1.4 Wm-2, which includes a -1 Wm-2 indirect forcing, may have masked as much as 50% (+/- 25%) of the global forcing due to GHGs. The estimated aerosol forcing of -1.4 Wm-2 due to ABCs is within 15% of the aerosol forcing derived in the recent IPCC report as is also consistent with other stidies."] So however one plays this, atmospheric aerosols result in a nett coolong forcing, and partially offset the warming due to enhanced greenhouse gas emissions. Even if we consider only atmospheric brown clouds, the conclusion is similar. That seems to be implicit in Ramanathan and Carmichael's statement: ["The logical deduction from Fig 2a,c,d is that elimination of present day ABCs through emission strategies would intensify surface warming by 0.4 to 2.4 oC." (ABC being atmospheric brown cloud)."] It's only if one were able selectively to remove the black carbon component from brown clouds that one would effect a net cooling. That's what Ramanathan and Carmichael are advocating. As for "activists" who cares? Policymakers and their advisors presumably get their information from the science and not from "activists". Anyway, I don't see why "activists" should or shouldn't mention soot. It would be good to reduce aerosolic pollution, but according to Ramanathan and Carmichael, that would be dangerous in general, since that would exacerbate the problem of greenhouse gas forcing. However the value of Ramanathan and Carmichael's work seems to be in highlighting the possibility for targetted intervention to reduce black carbon. This (if it were possible) would have a significant effect in giving a temporary respite against the growing temperature effects of continued enhancement of the Earth's greenhouse effect, and would have large health benefits in the developing world. So I would have thought everyone, "activists" included, should support Ramanathan's efforts. -------------------------------------- [*****] Forcings extracted from Figure 2 of V Ramanathan and G. Carmichael (2008) Nature Geosciences 1, 221-227. black carbon (BC): atmosphere +2.6 surface -1.7 total +0.9 non BC man-made aerosols: atmosphere +0.4 surface -2.7 total -2.3 all GHG’s (CO2, methane, N20, halons, ozone): atmosphere +1.4 surface +1.6 total +3.0 (W/m2 presumably) CO2: atmosphere +1.0 surface +0.6 total +1.6
    0 0
  49. Chris, Well, this is a reflection the state of confusion about aerosols in general. The above quotes are from Ramanathan himself. So can we first assume he knows what he's saying? I think the confusion is this: 1. Brown aerosol clouds 2. Aerosol clouds in general (not brown) There's a difference. IOW, a global, generic aerosol negative forcing is correct, and a global, specific brown cloud positive forcing is also correct. Both statements are correct and not mutually exclusive. Ramanathan explains that only WRT to brown clouds that the mid-tropospheric exceeds the surface shading. Check out his testimony before Rep. Henry Waxman's subcommittee last fall. Summary: http://oversight.house.gov/story.asp?ID=1550 The video: http://oversight.house.gov/story.asp?ID=1639 Transcript: http://oversight.house.gov/documents/20071127165326.pdf Prepared statements: http://oversight.house.gov/documents/20071018110734.pdf As for aerosols in general, it's again a question of mix. If the aerosol clouds are white, then they are cooling from albedo & surface shading. If the aerosol clouds are dark they create a net heating (I think this is assuming they rise to the mid-troposphere). So yes you are correct that specifically targeting soot is key, before abating the whitish sulfates. As for the question of activists, the problem is that they are trying to galvanize a constituency into driving policy, notably Al Gore and others. The rhetoric and spin on CO2 overshadows any other discussion, it's been latched onto well beyond measure. There are many reasons for this, not least of which is Kyoto's cap & trade system and the implications (painfully demonstrated in Europe) for a vast expansion of dirigist power. I could go into excruciating detail, but I'll illustrate what's wrong with Kyoto by posing a simple question: Would you go for a cap & trade system where the high emitters pay low emitters to emit more of what the high emitters are already emitting? I wouldn't, I'd think that system was utterly daft. But that is, in fact, what Kyoto not only allows, but is currently implementing via UNFCCC CDM clean coal projects. Although not bad in of itself, since clean coal projects avert increased soot emissions for new power generation, the emission credits are for CO2, not soot. And so firms in developed countries will be penalized and made to pay firms in developing countries to emit yet more! For starters that's a market distorting artifice that'll increase CO2 emissions. And as you may have noted, clean coal also means reduced whitish sulfates output relative to the CO2 emitted. This is just one part of why I say what I do about activists, politicos and policy makers. The entire scheme looks terribly broken and yet we're supposed to subsume all other considerations to CO2 mitigation. This also yet another reason that the chances for a Kyoto-II are becoming increasingly poor. This doesn't bode well, then, for real CO2 reductions against any climate change that poses any real risk, does it? Which brings us to soot.
    0 0
  50. chris "Using NCEP reanalysis data that span four and a half solar cycles, we have obtained the spatial pattern over the globe which best separates the solar-max years from the solar-min years, and established that this coherent global pattern is statistically significant using a Monte-Carlo test. The pattern shows a global warming of the Earth’s surface of about 0.2 °K, with larger warming over the polar regions than over the tropics, and larger over continents than over the oceans. It is also established that the global warming of the surface is related to the 11-year solar cycle, in particular to its TSI, at over 95% confidence level." From the Conclusion: Solar-Cycle Warming at the Earth’s Surface and an Observational Determination of Climate Sensitivity. By Ka-Kit Tung and Charles D. Camp
    0 0

1  2  3  4  5  6  7  8  9  10  11  Next

You need to be logged in to post a comment. Login via the left margin or if you're new, register here.


The Consensus Project Website

THE ESCALATOR

(free to republish)


© Copyright 2025 John Cook
Home | Translations | About Us | Privacy | Contact Us