


 Arguments


Arctic Ice Volume is diminishing even more rapidly than Area
Posted on 21 October 2011 by Peter Hogarth
Introduction
Over the past few decades the globally averaged heat content of the atmosphere (Peterson 2011), and more importantly the oceans (von Schuckmann 2011, Hamon 2011), have significantly increased, resulting in average global surface temperature rise. This rise has not been uniform. Directly measured average air and surface temperatures over the Arctic have increased more than in any other region of the planet over at least the last fifty years (Wood 2010, Bekryaev 2010, Semenov 2010), and the most recent 50 year period has been the warmest for 2000 years in the composite multi-proxy record (Miller 2010). Atlantic waters entering the Arctic Ocean are now also warmer than at any time over this same period (Spielhagen 2011), whilst the entire Canadian Arctic is also experiencing the highest melt rates in 4000 years (Fisher 2011). This Arctic Amplification (Serreze 2011) is a robust feature of all global temperature data sets, including satellite lower troposphere measurements using microwave, Surface Infrared emission measurements from satellites, as well as radiosonde, weather station and buoy data.
We have examined Arctic ice extent elsewhere and have shown that there is a long-term downward trend which has been accelerating over recent decades. If this is due to the warming trend, we might expect the total amount of ice (the volume of ice) to diminish, as the amount of melted ice is directly related to the amount of latent heat and thermal energy transferred to the ice from the atmosphere and Ocean.
Melting Ice and Global Warming
Temperature, or the thermal energy of the environment, is the main factor that governs seasonal melting and re-freezing of ice. As heat is transferred to the ice as the environment (both atmosphere and ocean) warms in the summer, the thermal energy of the ice increases, resulting in temperature rise. As melting point is reached, the temperature of the ice stops rising and stays at melting point whilst large amounts of heat energy are transferred in order to melt the ice. This latent heat allows large amounts of thermal energy to be absorbed in summer, constraining surface temperature rise whilst any ice remains. This is subsequently released in late autumn when the ice re-freezes. In general the amount of Arctic sea ice can almost be regarded as a self calibrating proxy for regional temperature. If the air temperatures and water temperatures are warming, this should result in a long term trend of ice volume thinning and volume loss. However, there are several inter-related dynamic and thermodynamic factors driving the high latitude weather patterns, currents, air and oceanic temperatures, and these would be expected to modulate the regional energy budget, and thus also affect ice volume in the shorter term (Stroeve 2011, Screen 2011).
The Diminishing Global Ice Reservoir
Viewed in a global context, the amounts of polar sea ice are relatively small compared with the massive total volumes of ice in the land-based ice caps of Antarctica, Greenland, and the Himalayas. If we take into account the observations of recent ice mass loss from these areas, (Zwally 2011, Schrama 2011, Bolch 2011), plus the combined increasing mass loss from the world's glaciers, summarised in Pelto 2011, with details in Shahgedanova 2011, Leclercq 2011, Gardner 2011, and Radic 2011, and even evidence from tropical glaciers Thompson 2011, it is evident that perennial ice loss is ongoing, global in extent, and currently following an accelerating trend (Pfeffer 2011). Although melt rates of the perennial ice vary across the globe, the relatively thin layer of sea ice floating on the Arctic Ocean appears especially vulnerable, and the clear multi-decadal decline in summer ice extent has become one of the most compelling and widely discussed indicators of recent climate change. Coupled with the evidence of significant increases in average length of the ice melt season (Markus 2009, Perovich 2011, Agarwal 2011, Wang 2011) and mean ground permafrost temperatures in all Arctic regions rising towards critical thaw threshold over the past three decades (Quinton 2011, Romanovsky 2010), increasing melt rates across Greenland (Fettweiss 2011, Tedesco 2011), the entire Canadian Arctic (Fisher 2011, Sharp 2011), and Siberia (Okamoto 2011), it is apparent that the Arctic region is going through dramatic changes.
Increasing Loss of Older Ice
The shrinking extent of Arctic sea ice over the past few decades has been widely publicised, but it is also important to monitor changes in the amount of Arctic ice surviving from one year to the next. Satellite radar backscatter (for example QuikSCAT) data can detect textural differences between new first year and older ice (see below). We can also track ice movement and longer term survival through successive melt seasons using satellite data and buoys and cross check this with airborne data records, allowing maps of the age and transport of Arctic ice to be created.
Figure 1. Animation of QuikSCAT 13GHz RADAR Scatterometer data clearly showing build up of new first year ice (darker) and areas of older ice (lighter), and the changes in overall extent and reductions in older ice from 2000-2009. Credit for images David Long, Brigham Young University, JPL NASA.
As ice that survives the melt season tends to accumulate further layers of ice through the winter, older ice also tends to be thicker ice. Observations over the whole Arctic region show that the reducing ice extent has been accompanied by a significant trend of older sea ice loss (Rigor 2004) corresponding to a reduction in overall ice thickness (Yu and Maykut 2004, Lindsay 2009, Wang 2010, Shirasawa 2009). This loss of thicker multi-year ice, which in the 1970s accounted for around three quarters of the total ice cover, has not been constant or uniform over the entire Arctic area. Over the past ten years, older ice around the North Pole towards Siberia has diminished rapidly, whilst the area north of the Canadian coast has remained least affected (Agnew 2010, Haas 2010). The loss of ice more than 5 years old has also continued through 2009 (Nghiem 2010) and 2010 (Nghiem 2011), so that the overall percentage of ice surviving more than 5 years is now the lowest in the satellite record, at around 10% of the total (see below). However there has been a short-term recovery in the proportion of overall two and three year old ice (Maslanik 2011), following the extreme loss of 2007 and the consequent formation of a large area of first year ice in the Winter of 2007/2008. By March 2011 the overall multi-year ice formed around 45% of the total Winter Ice cover, but this was relatively thin, and this has contributed to the rapid loss of ice through the 2011 melt season, culminating in the very low ice minimum extent in September.
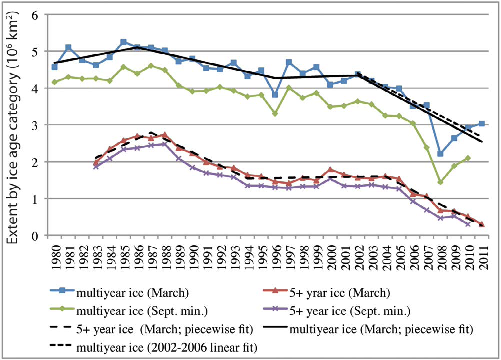
Figure 2. Chart showing trends of extent of multi-year ice in Arctic to Spring 2011, from Maslanik 2011. Note the 5 year ice extent.
Recent voyages have provided direct observational data (Barber 2010, Barber 2009) showing that many areas reported as multi-year ice in 2009 by satellite sensors were in fact “rotten”, containing approximately 25% open water. This implies that the ice coverage as reported by microwave sensors on satellites, which do not have high enough resolution to monitor these small scale features, is likely to be an overestimate. On a larger scale, recent melt seasons and reductions in extent have seen the overall ice cover becoming increasingly “unlocked” from the surrounding coastlines, so that ice once thought to be permanently land fast is now moving. The ice cover is becoming more mobile and susceptible to fracture and break up, and this facilitates more melting. Even above the Canadian Archipelago where sea ice remains thickest, ice shelves which are estimated to be more than 3000 years old have “calved” or fractured since 2000, and 2011 also saw the break up of the Ward Hunt ice shelf.
Figure 3. Animation showing motion and changing proportion of older and younger Arctic ice, colour scale is top right, ice 5 years old or older is in red. Credit Jim Maslanik and Chuck Fowler, Colorado University.
Decreasing Ice Thickness and Volume
Can we say anything else about the amount of sea ice? Extent is the most visible proxy for the total amount of ice, and we have relatively good ice boundary records for many Arctic regions for most of the 20th Century. Ice age can give us a useful indication of thickness, and we can gauge from the animation above that the thicker ice has diminished dramatically, but actual measurements of thickness would allow more accurate estimates of volume. Ice thickness data from before the 1950s is sparse. Recently declassified submarine sonar based data from 1958 onwards, covering more than 38% of the Arctic Ocean, shows that overall ice thickness has almost halved in the past 30 years, and the thinning trend is accelerating (Kwok and Rothrock 2009, Kwok 2011), though the ice thickness is not uniform across the region (Oikkonen 2011). This overall ice thinning, as measured by satellite radar altimetry (Giles 2008) and ICESat satellite laser altimetry (Kwok 2009), continued through 2008 and 2009 despite the slight increase in minimum ice extent. Combined with the loss of older ice it appears that the total amount of sea ice is very much on a downwards trend (Maslowski 2010, Tschudi 2010).
If we look at sophisticated models of the Arctic ice volume such as (PIOMAS), which assimilate of an array of available measurements, we see that the annual ice volume is indeed continuing to diminish, and as with ice extent, the trend is accelerating. As the summer ice (on average) thins, it becomes ever more susceptible to various positive feedbacks, such as the effects of ice motion during storms or high winds, warming from above, from direct solar heating (Perovich 2011a), as well as from below by increasingly warm waters. The water in contact with the underside of the ice can be heated directly through thinner ice and meltponds (Itoh 2011, Sirevaag 2011). Warmer surface water may also have been transported from increasingly ice free areas subject to direct insolation, as well as from areas of the Atlantic and Pacific which are also, on average, warming (Steele 2010, Nguyen 2011). This all contributes to a lengthening melt season (Perovich 2011b). PIOMAS indicates that even accounting for uncertainties, the 2010 summer minimum ice volume was even lower than in 2007 (Shweiger 2011), and the 2011 minimum value is the lowest on record.
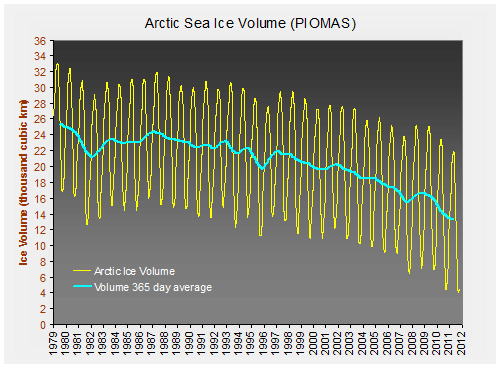
Figure 4. Chart showing estimated seasonal variations and average annual PIOMAS Arctic ice volume. Note that this is absolute volume, (not anomaly) the vertical scale starts at zero (no ice at all).
Summary and Outlook
The longer term trends in diminishing ice extent, plus the more recent data on thinning, older ice loss and reducing volume, show us that the total amount of ice is now dropping at a proportionally faster rate than ice extent. This is consistent with a warming environment. Again, as with ice extent, accounting for recent years has only increased the multi-decadal downwards trends. Modelling clearly indicates that this ongoing rapid Arctic sea ice loss can not be a result of natural variations alone (Kay 2011), and the Arctic region has already been substantially affected by our activities.
Though average ice mass loss from Greenland, Antarctica, the Himalayas and the worlds glaciers amounts to hundreds of billions of tons per year, affecting hydrological cycles and global sea level (Church 2011), the cumulative loss to date is a relatively small proportion of the total global ice volume. However the proportionally huge loss of Arctic Sea ice mass (annual average ice mass loss is greater than 40% over a 30 year period) has in many ways become symbolic of the link between climate change and global ice loss, and is an early indicator that significant and relatively rapid change is already underway. As the Arctic region has warmed, the thin floating shell of Arctic sea ice has (on average) diminished and progressively thinned, making it increasingly fragile and vulnerable to a number of related mechanisms which are likely to further enhance ice loss. This is already having an impact on regional and possibly the wider climate. It is abundantly clear the whole Arctic is in a process of transition. On current trends of CO2 emissions, these changes will not simply stop once the summer sea ice disappears.


Figure 2 only has a downward trend of less than ten years.
How does the trend look now in 2016?