


 Arguments


Climate goes extreme!
Posted on 13 February 2020 by John Cook
An excerpt from the book Cranky Uncle vs. Climate Change, released Feb 25.
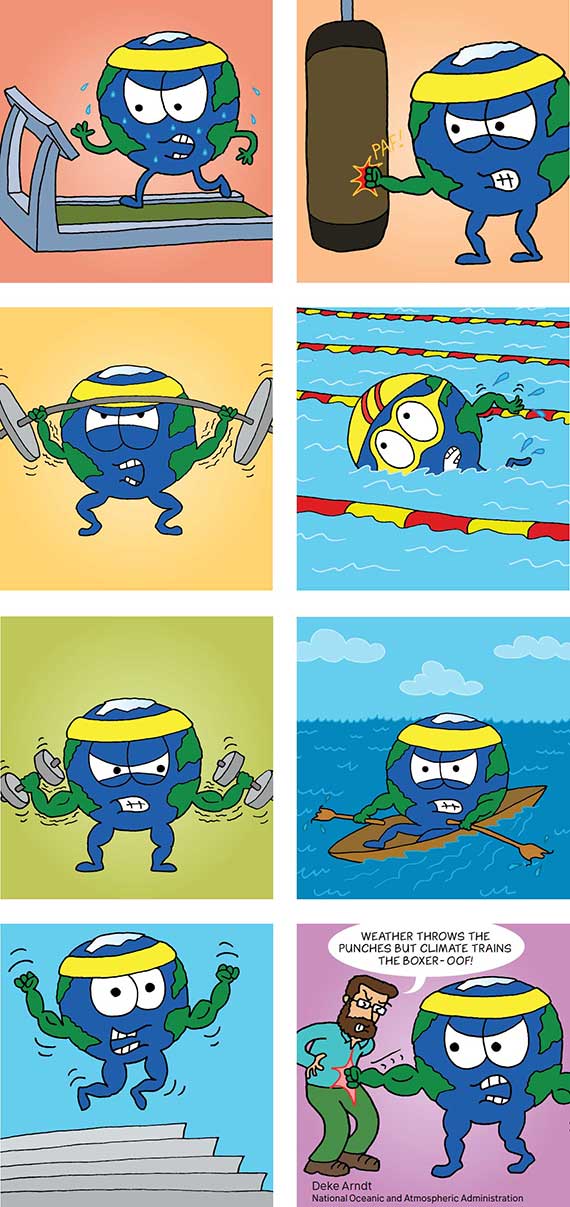
Every weather event is affected in some way by global warming, including the buildup of heat, more moisture in the atmosphere, and rising sea levels. A direct impact of the extra heat is more intense and frequent heatwaves.
Warming also accelerates evaporation of water from the ground and water sources. As the ground dries out, drought intensifies and fire danger increases. Extra evaporation also puts more moisture into the atmosphere, and warmer air can hold more water vapor. Both these factors result in heavier downpours. The warmer oceans also provides additional energy for hurricanes, making them more intense.

Weather is somewhat unpredictable, like rolling dice. Global warming increases the occurence and/or strength of many types of extreme weather. It’s like drawing extra dots on the dice, increasing the odds of a higher roll.
People often ask: “Was a specific weather event caused by climate change?” That’s the wrong question. A more appropriate question is: “Are weather events being affected by climate change?” The answer is yes, global warming is increasing the occurence and/or strength of extreme weather. As NOAA climate scientist Deke Arndt says, "weather throws the punches, but climate trains the boxer."
Heatwaves are getting hotter, lasting longer, and happening more frequently. Globally, heatwaves are happening five times more often due to global warming.
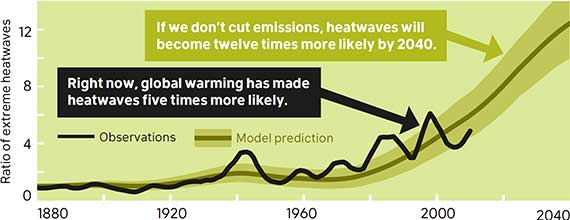
The number of heatwaves is predicted to increase in the future. If we don’t reduce greenhouse gas emissions, heatwaves will become twelve times more likely by 2040. While heatwaves have happened in the past, they are becoming more likely under global warming. Climate scientist Marshall Shepherd (drawn below) explains the difference between climate and weather with the following analogy: "Weather is your mood, and climate is your personality."
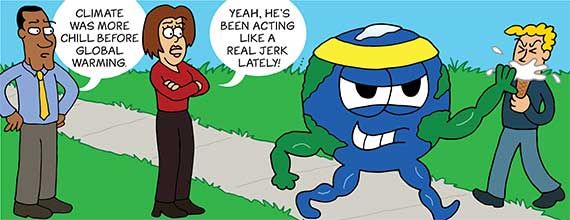
Deniers try to distract from the increasing risk of heatwaves by arguing that they have happened in the past, so today’s heatwaves are not influenced by global warming.
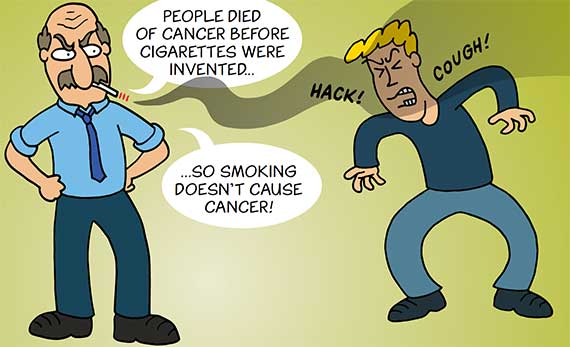
This argument commits the fallacy of jumping to conclusions. It’s like arguing that humans were dying of cancer long before cigarettes were invented, so smoking doesn’t cause cancer. The science is sending us a clear message: Heatwaves have happened throughout history, but global warming is increasing the frequency of heatwaves now and that risk will increase further in the future.
 Cranky Uncle vs. Climate Change uses cartoons, climate science, and critical thinking to make sense of climate denial and misinformation. Guided by psychological research into how to refute misinformation, the book embraces a creative approach, using cartoons and visual analogies to make the science engaging and accessible to readers. The book is written and drawn by John Cook, a former cartoonist who now researches climate communication at George Mason University. Cranky Uncle vs. Climate Change will be published by Kensington Books on Feb 25. Sign up for latest Cranky Uncle news at crankyuncle.com.
Other excerpts from Cranky Uncle vs. Climate Change:
How did climate change get so controversial?
Global warming is happening here and now
Why is the Keeling curve so curvy?


Global Temperature Jazz - Paris Climate Accord Into the Twenties
https://www.youtube.com/watch?v=D_dySw3kP_Q
With more water in the atmosphere causing heavier precipitation but ever reducing snow packs and glaciers to store this water until it is needed, we need a way to hold this water in the upper catchment and slowly release it. Add to this the precipitation coming more intermitently but more intensly, we also need a storage mechanism to mitigate down stream floods. There is a neat, inexpensive solution. https://www.youtube.com/watch?v=wI5AjJd00cM
Wow, this beaver thing really is a serious thing. I wonder if they could be introduced to the streams flowing out of the Himilaya mountains?
Beavers are ecosystem engineers. But there is an even better solution.
We can make those small dams the size of the beaver dams and put small hydroelectric dams on each. Millions of small generators ends up being just as beneficial as a huge hydro dam, but with little to no downside.
“If we don’t reduce greenhouse gas emissions, heatwaves will become twelve times more likely by 2040.”
I’m noticing more and more precise predictions concerning not only heatwaves but the amount of CO2 in the troposphere. My personal research and calculations reveal, as far as I can tell, that CO2 is rising at an unpredictable rate AND the rate of increase is increasing unpredictably. The data I use comes from the Mauna Loa, Hawaii - ESRL Global Monitoring Division. I believe that we are already suffering from having reached a tipping point with CO2. Our crisis is not “coming.” It is here! Please see: Tipping points
skymccain @5,
Your numbers (as set out in the webpage you link to) are in need of correction.
The 74% increase you project is the percentage increase in the rate of CO2 increase. Your 710.3ppm by 2039 is a 74% increase in the level of CO2.
And the way you calculate the decadal rate of increase is very hit-&-miss. If you calculate that decadal rise for every start-year (so 1959-68, 1960-69, 1961-70, etc) and look for a rising trend, you don't find one. All you get is a lot of noise. The percentage rate of CO2 increase has not actually increased. It is the rate of CO2 increase that has been increasing (from 8ppm/decade 1959-68 to 24ppm/decade 2010-19). Projecting that rate of CO2 increase yields 441ppm by 2029 and 478ppm by 2039. That increase in the rate-of-CO2-increase is the equivalent of 71% in 25 years.
The BBC article from 2007 you quoted talks of all GHG emissions saying:-