Climate Science Glossary

Term Lookup

Enter a term in the search box to find its definition.

Settings

Use the controls in the far right panel to increase or decrease the number of terms automatically displayed (or to completely turn that feature off).

Term Lookup

Settings


All IPCC definitions taken from Climate Change 2007: The Physical Science Basis. Working Group I Contribution to the Fourth Assessment Report of the Intergovernmental Panel on Climate Change, Annex I, Glossary, pp. 941-954. Cambridge University Press.

Home Arguments Software Resources Comments The Consensus Project Translations About Support

Bluesky Facebook LinkedIn Mastodon MeWe

Twitter YouTube RSS Posts RSS Comments Email Subscribe


Climate's changed before
It's the sun
It's not bad
There is no consensus
It's cooling
Models are unreliable
Temp record is unreliable
Animals and plants can adapt
It hasn't warmed since 1998
Antarctica is gaining ice
View All Arguments...


Username
Password
New? Register here
Forgot your password?

Latest Posts

Archives

Extreme Flooding In 2010-2011 Lowers Global Sea Level

Posted on 5 September 2011 by Rob Painting

The last 18 months has seen some epic deluges throughout the world, countries such as Pakistan, Sri Lanka, Australia, the Philippines, Brazil, Colombia and the United States have been hammered with extreme flooding. It will take some time for studies about these episodes to appear in the scientific literature, so how the recent spate of massive floods stack up in a historical context is as yet unknown. 

A recent news release over at the NASA Jet Propulsion Lab, which was re-posted here at SkS, helps in putting the extreme flooding into perspective - so much rain and snow has fallen over land in the period from March 2010-March 2011 that it has contributed to a large fall in global sea level. But this is only a temporary effect, as water is swapped back-and-forth between the continents and ocean, and does not alter the long-term rise in sea level which results from warming oceans and the melting of the polar icesheets and glaciers worldwide.

         Color Bar

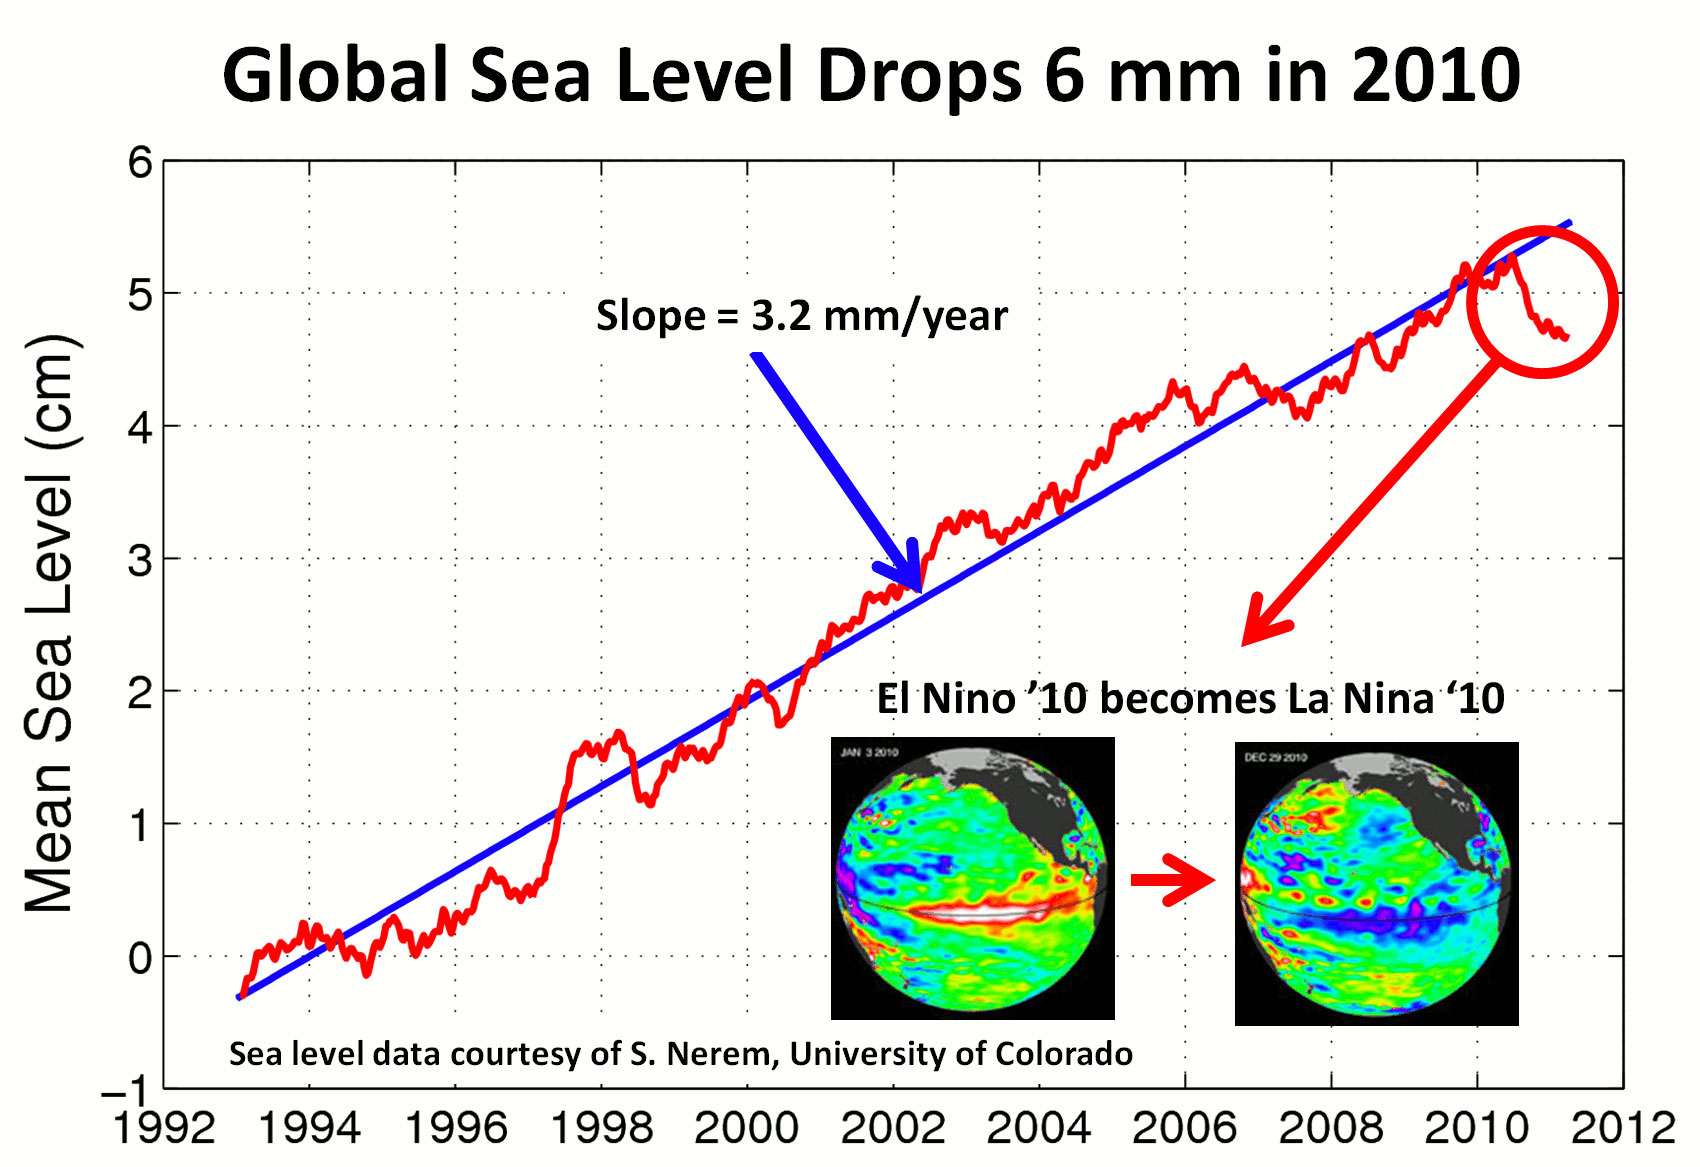
Figure 1 - sea level rise 1993-2011 from satellite altimetry. Image from NASA JPL

Short-term sea level fluctuations

Perhaps a poorly understood process, on climate blogs, is the large exchange of water between the ocean and land over short timescales (months/years), which is illustrated in the NASA JPL article. Tremendous volumes of water are evaporated from the world's oceans, and as the holding capacity of the atmosphere is small compared to the land and ocean, this evaporated water ultimately ends up back in the ocean, or on land in the form of either water, snow or ice.   

Each year there are seasonal fluctuations in global sea level which are caused by water swapping back and forth between the land, atmosphere and ocean, and asymmetric (unbalanced) heating of both hemispheres. Because most of the world's land mass is in the Northern Hemisphere, a large amount of water is stored there in the winter in the form of ice, snow and water, and this results in an increase in land-based water storage. At the same time, the Southern Hemisphere is angled closer to the sun, and because it is mainly ocean, the sun heats a huge pool of water, creating a rise in sea level through thermal expansion. The end result of these two out-of-sync processes is the variation shown below, and which results in seasonal sea level fluctuations of 6-9mms.

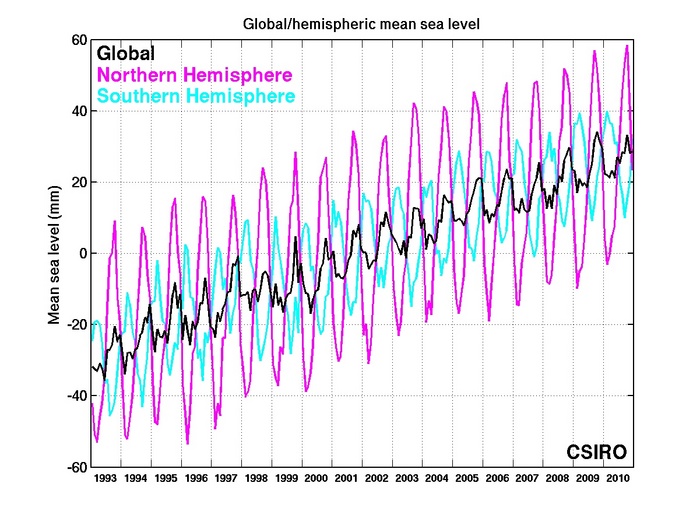
Figure 2 -Global and hemispheric-mean sea level from TOPEX/Poseidon and Jason-1. The two hemispheric signals partially cancel to produce a global signal with smaller amplitude. From www.cmar.csiro.au

The peak contribution of water mass to the global oceans generally occurs in September at the end of Northern Hemisphere summer as water, stored in snowpack, soils, lakes, rivers, soils and vegetation, is fed back into the sea. And the peak thermal component (ocean expansion from warming) occurs in April, at the end of the Southern Hemisphere summer - when the large expanse of Southern Ocean is exposed to greater solar heating. The annual global sea level peak matches the Northern Hemisphere run-off of water back into the oceans, which is the stronger of the two signals on a year-to-year basis. See Willis (2008) and Leuliette & Willis (2011) for an overview.

You will note the difference with figure 1, which has had the 'seasonal signal' removed to show the long-term trend. It should be obvious from both figure 1 & 2, that despite the large short-term fluctuations, these fluctuations are only temporary. Global sea levels continue to rise as the oceans warm and expand, and as more water mass is added to the oceans from the melting of land-based ice sheets and glaciers. 

ENSO and global sea level

Massive water volumes are also exchanged between the land and ocean connected with the ENSO phases, La Nina and El Nino. During La Nina there is typically an increase of rain and snow falling over land, which corresponds with a fall in global sea level. With El Nino, the atmosphere warms, drying out much of the global land surface and shifting rainfall over the ocean. This brings about a rise in global sea level. See image below: 


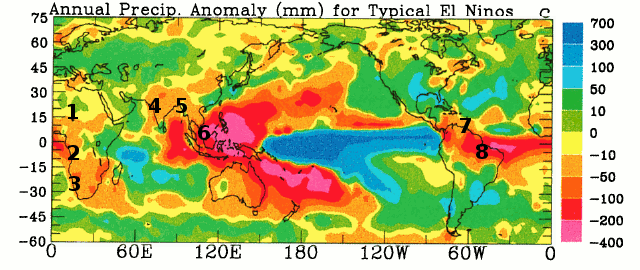
Figure 3 - annual precipitation anomalies (in mm) for typical El Nino. Note that yellow and light-green colors indicate statistically insignificant values. See Dai & Wigley (2000). Numbers represent the 8 largest tropical river basins 1) Niger, 2) Congo, 3) Okavango, 4) Indus, 5) Ganges, 6) Mekong, 7) Orinoco, 8) Amazon. See discussion below.

As mentioned in the Amazon drought posts, the Walker Circulation is shifted over the tropical Pacific during El Nino, causing the moisture evaporated from land and sea to fall back over the ocean, rather than over the Amazon. El Nino also causes serious drought over Australia, and drying of Southern Africa, India and South East Asia, so much of that land-based moisture ends up back in the ocean too.

Recent research, Llovel (2010), has found that tropical river basins, such as the Amazon, are the main contributor to the EL Nino/La Nina exchange of water mass with the ocean, and the Amazon is a major contributor to the seasonal variation too. For clarity, I've labelled figure 3 with the location of the 8 main tropical river basins which contribute to ENSO-based fluctuations in sea level. Note how all the tropical river basins tend to dry out during the El Nino phase. Now compare with the period March 2010- March 2011, which was in the grip of a particularly powerful La Nina:

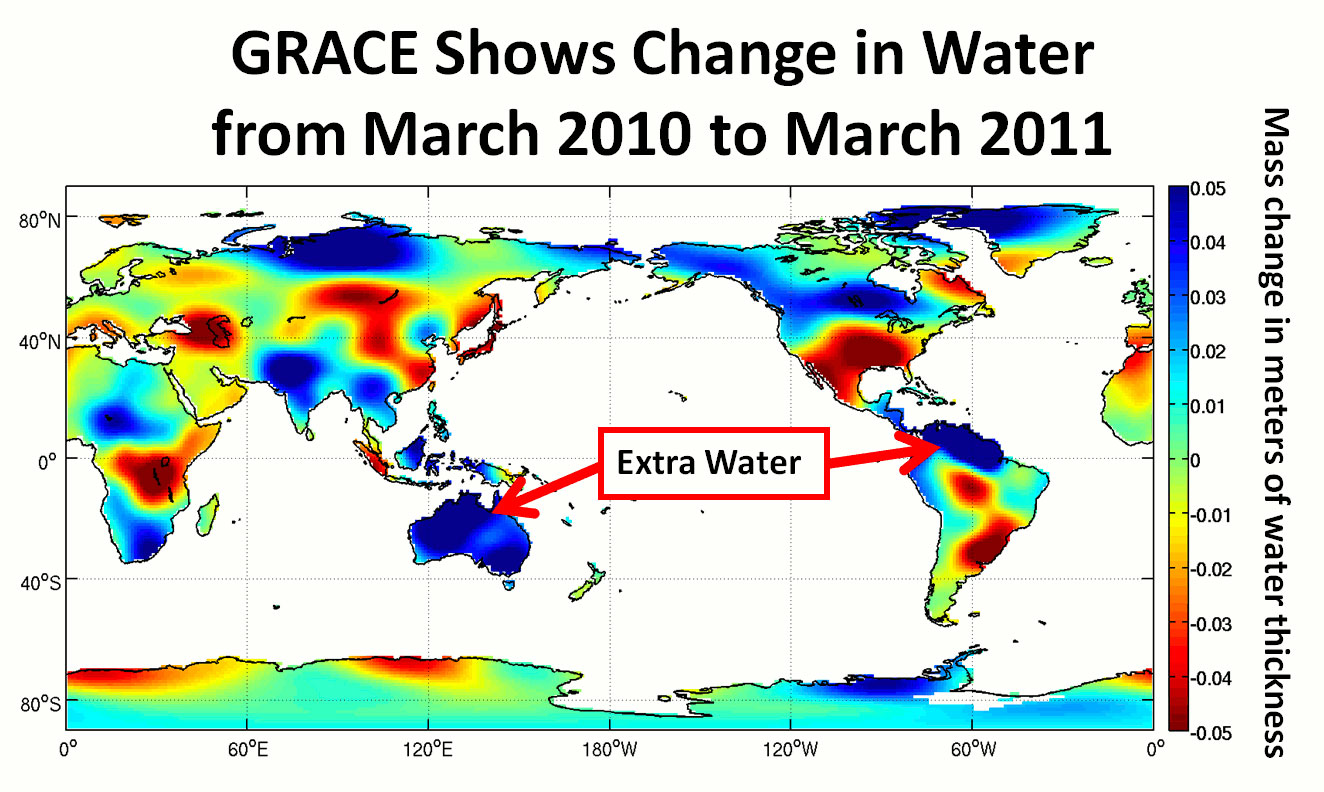
Figure 4 - change in land-based global water storage in the period March 2010-March 2011, as observed by GRACE gravity satellites. Image from NASA JPL.

All tropical river basins, apart from the Congo, have gained extra water throughout the latest La Nina. The huge increase in water mass over the Australian continent is rather hard to miss too. Not surprising given the enormous flooding there in the last year.

This regular fluctuation of sea level (falling during La Nina, and rising during El Nino) has been observed throughout the period of satellite-based sea level monitoring (1993 onwards). This can be seen in the de-trended (long-term trend removed to enable comparison) data in figure 5 below. Note that both the Multivariate ENSO Index (MEI, a measure of ENSO), and the related sea level change, fluctuate about zero. In other words ENSO does not contribute to long-term sea level.


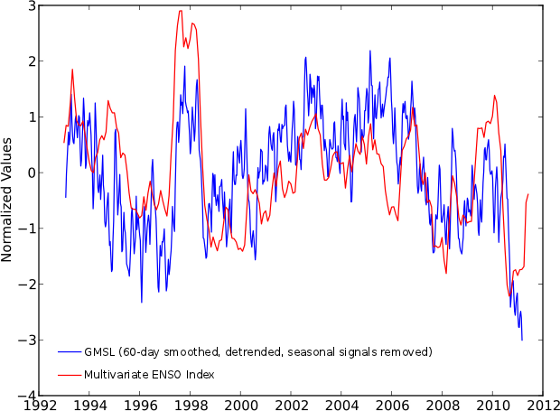
Figure 5 -  To compare the global mean sea level to the MEI time series (a measure of ENSO), the mean, linear trend, and seasonal signals from the 60-day smoothed global mean sea level estimates have been removed, and each times series normalized by its standard deviation. The normalized values plotted above show a strong correlation between the global mean sea level and the MEI, with the global mean sea level often lagging changes in the MEI. Image from the University of Colorado sea level research group page.

Joining the dots

We regularly get "skeptics" posting here, pointing out the large drop in sea level during 2010, however it never seems to occur to them why sea level dropped. That water hasn't just magically disappeared, it's simply found a new temporary home on land, as the residents of Vermont in the USA have sadly just experienced. But it is only temporary, eventually all that water held in lakes, wetlands, rivers, soils and vegetation will find its way back into the ocean, and sea level will rise again. Long-term, expect the sea to continue rising as the oceans warm and melting glaciers and ice sheets constantly add more water to the oceans, but don't be surprised if there's a large pothole, or speed bump, along the way.    

This is the intermediate rebuttal of Sea level fell in 2010

0 0

Printable Version  |  Link to this page

Comments

Comments 1 to 20:

  1. Color code needed for the twin globe insert of first graphic.
    0 0
    Response:

    [DB] Color scale added from the JPL website.

  2. @Badgersouth. Red=warmer, blue=colder; or am I being too logical?
    0 0
  3. How many places received excessive precipitation? Check Colorado Bob's list. Rain isn't everything. Snow is precipitation too.
    0 0
  4. Seems like some duplication from the prior 'pothole' thread. Any way to combine the two so as not to lose the existing comments there? But it looks like some folks were predicting heavier rain and more snow back in 2006. Some scientists predict severe weather events will be even more extreme over the next few decades -- more snow, harder rain, and hotter heat waves. ... Computer models based on nine different countries' climate data indicate every country will be hit with climate change throughout this century. Computer models got it right? Astounding. Oh bad news, the quote is 'every country;' the 'skeptics' will be sure to point to Lichtenstein or Brunei or some equally tiny spot as proof this prediction was 'wrong.'
    0 0
  5. And yet at the same time (note the area of extreme lack of precipitation in the southern USA in the map above) CNN has this to say about the fires in Texas:
    Texas is battling its worst fire season in state history. A record 3.5 million acres have burned since the start of the season in November.
    More extreme whether. But I'm sure the two aren't related at all to climate change. No sir. That would be alarmist.
    0 0
  6. Sphaerica#5: Extremes? Nah, its the new normal. From Jeff Masters, 5 Sept: "I do not believe I have ever seen a site with a long period of record, like Shreveport, where records go back to 1874, break its warmest single month on record by an astonishing 3°. This is unheard of. Usually when a site breaks its single month temperature record, we are talking about tenths of a degree, rarely a whole degree, let alone 3 degrees!" There seems to be a wall shutting moisture out: And that is 'just' a tropical storm.
    0 0
  7. muoncounter: "But it looks like some folks were predicting heavier rain and more snow back in 2006." Muon, It seems that those predictions date back to at least 1994. http://resources.metapress.com/pdf-preview.axd?code=w7q445p545h78g38&size=largest A. M. Fowler, and K. J. Hennessy 23 June 1994 "It is now widely recognised that the most significant impacts of global warming are likely to be experienced through changes in the frequency of extreme events, including flooding. This paper reviews physical and empirical arguments which suggest that global warming may result in a more intense hydrological cycle, with an associated increase in the frequency and/or magnitude of heavy precipitation. Results derived from enhanced-greenhouse experiments using global climate models (GCMs) are shown to be consistent with these physical and empirical arguments. Detailed analysis of output from three GCMs indicates the possibility of substantial increases in the frequency and magnitude of extreme daily precipitation, with amplification of the effect as the return period increases."
    0 0
  8. villabolo#7: "predictions date back to at least 1994" That's clearly a typo; we're told repeatedly that those models don't work. And if we've learned nothing else, we know enough to believe what we are told, not what we observe. Or at least that's what I've been told.
    0 0
  9. Same song, 2nd verse: From Jeff Masters Sept 8: This is the second year in a row Binghamton has recorded a greater than 1-in-100 year rain event ... Binghamton has also already broken its record for rainiest year in its history. Records go back to 1890 in the city. ... The Susquehanna River at Binghamton has risen to 25.69', its highest level since records began in 1847 -- emphasis added
    0 0
  10. The Queensland Australia floods were in south and central QLD, coloured light blue in the graphic above. I'd attribute the water gain across much of central and western Australia to La Nina year rains accumulating in usually dry salt lakes. Lake Eyre being the best example. It has had the largest inflows in more than 20 years.
    0 0
  11. The GRACE Map shows Greenland as much more blue than yellow/red. To me that would indicate mass gain from March 2010 to March 2011. But all the Greenland-specific mass balance papers of late have Greenland trending down hard. What explains this? I suppose very few papers are quite that up-to-date.
    0 0
  12. muoncounter@9: Was there a weather event that caused the 7 day period of rain?
    0 0
  13. GFW - yes, I noticed that too. Interesting that the region (north west Greenland) that was showing 'recent' accelerated ice mass loss, seems to have gained a lot of snow in the last year. And southern Greenland ice loss, which had slowed right down, has lost a lost of ice in the last year. A recent paper on the Greenland ice sheet melt: Interannual variability of Greenland ice losses from satellite gravimetry - Chen (2011) illustrates that even the Greenland icesheet can undergo large year-to-year fluctuations. In other words, there's a natural signal component to the loss of ice - in addition to the melt induced by global warming. Seems to indicate the icesheet can respond very quickly to climatic change. Hopefully one of the SkS authors might want to write about the paper? (hint, hint)
    0 0
  14. camburn#12: "Was there a weather event" Yes: by definition, a tropical storm is a weather event. But that is, of course, an utterly irrelevant question. In case you missed it, the 'normals' changed. Have a look at the graphs of US Climate Extremes Indices, particularly this graph of 'extremes in one day precipitation'. The relevant questions are: What is causing the rise in extreme precipitation events? What is causing the 'normals' to change? Note the use of the word 'extreme' in the title of this post. Why are we hearing that word so frequently? But you seem to cling to the 'its fine' school: Climate change is always in the future. What we are seeing is merely weather. It is in the nature of Climate change that you can never observe it because only weather is observable. So everything is fine...
    0 0
  15. Muon, The question would be, how does this affect global sea level? Looking at the total U.S. precipitation, there was a dip in the middle of the 20th century (1940s, 60s, and 70s), but otherwise recent precipitation is similar to a century ago. Is it a new "normal," or a return to a previous one? One would expect the added precipitation to raise lake levels and advance glaciers, both of which would act to lower global sea level. While the drop is of interest, unless the pattern persists, it will be just a short-term blip.
    0 0
  16. Jonathon#15: "Is it a new "normal," or a return to a previous one?" New. The graph I linked to at Climate Extremes Indices clearly shows an abrupt change in trend starting in the mid-70's - right about when the most recent warming spell ramped up. "unless the pattern persists, it will be just a short-term blip. " Have to agree with you there; short term blips aren't of too much interest. Please be sure to remind anyone who rejects the on-going warming trend with an 'its el Nino' of that point.
    0 0
  17. Muon, Yes, minimum temperatures definitely increased since the mid-70s. Precipitation increased also, but your link to the NOAA graph shows that precipitation decreased from 1910 to 1970, and has increased since. The past decade looks similar to the 1910s in both absolute and filtered values. Can you confidently say that total precipitaion in the U.S. today is significantly different than one hundred years ago? I would be hesitant to proclaim a new precipitation normal if a similar normal occurred a century ago.
    0 0
  18. Hot of the press... "New evidence of sea-level oscillations during a warm period that started about 125,000 years ago raises the possibility of a similar scenario if the planet continues its more recent warming trend, says a research team led by the Woods Hole Oceanographic Institution (WHOI)." Source: "Sea Levels Much Less Stable Than Earlier Believed, New Coral Dating Method Suggests'" Science Daily, Sep 12, 2011 To access this article, click here.
    0 0
  19. Hi Rob, Just to add to the graphics above (figure 3). I think this is what is known as an interesting correlation.
    0 0
  20. Post updated to include figure 5. Some extraneous text snipped.
    0 0

You need to be logged in to post a comment. Login via the left margin or if you're new, register here.


The Consensus Project Website

THE ESCALATOR

(free to republish)


© Copyright 2024 John Cook
Home | Translations | About Us | Privacy | Contact Us