


 Arguments


Falling Cloud Height In the Last Decade: Is It Just ENSO?
Posted on 30 March 2012 by Rob Painting
In the old fable of the same name, Chicken Licken (aka Chicken Little, aka Henny Penny) has an acorn fall on her head and mistakenly believes the sky is falling. Unable to contain herself, she begins to inform all she comes into contact with that the sky is falling. Depending on which version of the fable you may have read, things don't always end so well for Chicken Licken.
The mainstream media, and 'skeptic' climate scientist Pat Michaels have jointly assumed the role of Chicken Licken and have likewise grossly misinterpreted a recent paper by two Auckland University researchers, Davies and Molloy (2012) , which shows cloud height decreased between 2000-2010. This trend is also seen in other papers, Loeb (2012), Laken (2012)(not yet published) and Erlykin and Wolfendale (2010). The most likely explanation is that these cloud changes are simply a response to the ENSO (La Niña/El Niño) trend over the decade, and may have nothing whatsoever to do with a feedback to global warming. Indeed, Laken (2012) state:
"We observe a net increase in cloud detected by MODIS over the past decade of ~0.58 %, arising from a combination of a reduction in high – middle level cloud (-0.31 %) and an increase in low level cloud (of 0.89%); these long term changes may be largely attributed to ENSO induced cloud variability"
The figure below, from Davies & Molloy (2012), also shows a very strong relationship (correlation) between cloud height and the Southern Oscillation Index (a measurement of ENSO) over the decade. The increase of cloud height over Indonesia/Australia/New Zealand (blue), and decrease over the central and eastern Pacific (red), indicates a substantial La Niña influence over the decade. See Figure 1.
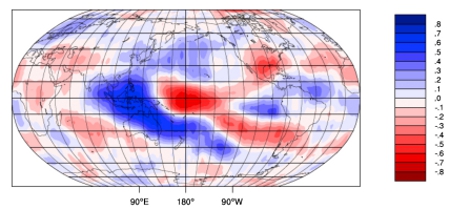
Figure 1 - Correlation of cloud height distribution anomaly with the Southern Oscillation Index (ENSO) over 2000-2010. From Davies & Molloy (2012).
Clouds get in the way
Clouds are one of the real 'wild cards' of global warming, cloud cover is in a constant state of flux, is difficult to measure accurately, and subject to numerous influences. So large is the amount of solar radiation entering the Earth's atmosphere that small changes in the amount, type, and vertical distribution of clouds, can result in large warming or cooling effects on the world's climate. How clouds respond over the long-term to global warming is still uncertain, however it is notable that the cloud response in the Earth's past appears to have done little to halt previous (natural) global warming episodes, when carbon dioxide levels in the atmosphere increased. The last great global warming event, the Paleocene-Eocene Thermal Maximum (PETM) is a case in point.
On cloud feedback
A positive global warming cloud feedback describes changes in cloud properties, such as height or total cloud cover, that further enhance warming. A negative cloud feedback means that the changes result in cooling. A fall in cloud height as a feedback would act in the direction of cooling because clouds would be able to radiate heat away to space at a higher temperature than before. And, obviously, an increase in cloud height as a feedback would enhance warming, as clouds would be less efficient at radiating heat away to space.
A major obstacle in determining whether the net cloud feedback to global warming is positive or negative, is that it is necessary to first disentangle the effects that other factors may have on cloud height, formation and total cover. The largest global natural weather fluctuation affecting clouds is ENSO, a coupled ocean-atmosphere phenomenon more commonly known by its cool/warm phases La Niña and El Niño.
Been this way before - repeatedly
SkS has previously looked at the net cloud feedback here, here and here. What becomes obvious is that 'skeptic' climate scientists repeatedly mistake ENSO-related effects as a negative feedback , so the clamour by 'skeptics' to attribute the decline in cloud height to global warming is not surprising. But it is most likely wrong.
The quick lowdown on ENSO
The changes that take place in the tropics during ENSO are amply demonstrated in this animation. Described very broadly, La Niña is when a large pool of warm water is stored in the surface, and subsurface, ocean in the western tropical Pacific Ocean. The burial of heat in the subsurface ocean, where it cannot interact with, and therefore warm the atmosphere, leads to cooler global surface temperatures. And El Niño is when this large pool of warm water spreads out across the tropical Pacific surface ocean - warming the atmosphere, and raising global surface temperatures.
This ENSO ocean-atmosphere oscillation balances out to zero over the long-term, in other words it does not cause long-term global surface warming or cooling, or long-term global trends in cloud heights. But over decadal time frames it is possible to see warming or cooling trends, depending on the size, intensity and trend of ENSO (whether La Niña, or El Niño-dominant). Clearly such trends can have significant impacts on the temperature of the troposphere (the lower atmosphere where most clouds form), its moisture content, and therefore cloud height formation characteristics, when viewed in the short-term.
To give some idea of the scale of the short-term ENSO-related changes happening over the 'noughties' decade, tropospheric temperature anomalies (2[a]), and water vapour mixing ratios (2[b]), for 2003-2010 are shown below:
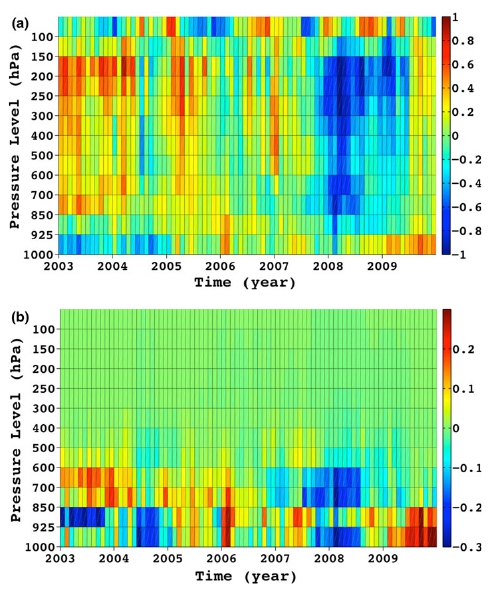
Figure 2 -AIRS (satellite) tropical (30°South-30°North) temperature anomalies (a) in degrees Kelvin, and water vapour mixing ratio anomalies (b) as a function of pressure level (higher pressure corresponds to lower height in the atmosphere). From Loeb (2012).
ENSO in the 'noughties'
The 'noughties' decade started out with quite weak ENSO events, and finished with very intense ones. Not only that, but the trend towards the end of the decade was toward more frequent La Niña. The end result is a negative trend in the Multivariate ENSO Index (MEI), another index which measures the relative strength, duration, and sign (positive=El Niño/negative=La Niña) of ENSO. See figure 3.
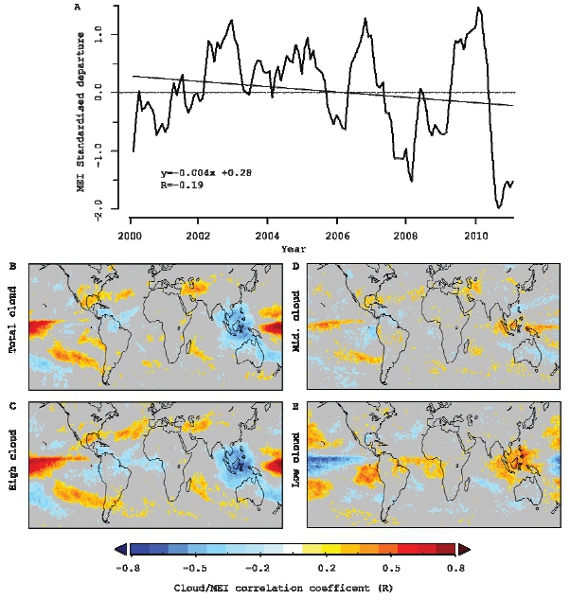
Figure 3 - Monthly changes in multivariate ENSO Index (a) between 2000-2010 with linear trend, regression equation (Y) and correlation coefficient (R) displayed. Shown in (b)-(e) are locally statistically significant correlations to variations in total cloud cover (b), high cloud cover (c). middle cloud cover (d), and low cloud cover (e). From Laken (2012).
Once again we see that the La Niña-dominant trend over the decade has had a large influence on global cloud cover. This is more clearly illustrated for the tropical regions in figure 4 from Davies & Molloy (2012).
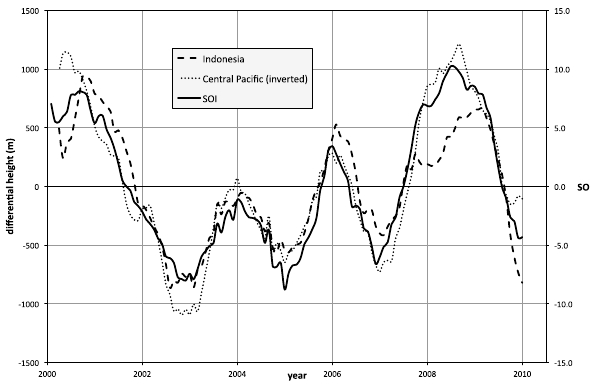
Figure 4 - Ten-year time series of effective cloud height for the Indonesian region (dashed) and the Central Pacific (dotted) compared with the Southern Oscillation Index (solid). The Central Pacific anomalies have been inverted. From Davies & Molloy (2012).
What comes down, must have gone up
Work by Erlykin and Wolfendale has shown that global cloud cover and cloud heights are related to the temperature of the Earth's surface. Warming of the troposphere results in low clouds rising and being reclassified in the category above, and by extension of these results, cooling of the troposphere should result in a decline of low-cloud heights.
The two decades preceding the 'noughties' were an interval where El Niño was the dominant ENSO-related influence on the global climate. See grey-boxed area in Figure 5.
Figure 5 - MEI Index. From NOAA Earth System Research Laboratory.
So if, as Erlykin & Wolfendale contend, low cloud height is greatly affected by the temperature of Earth's surface and its influence on temperatures in the troposphere, then the observations should show low cloud rising in the two decades prior to 2000 and a decline several years afterward. This is exactly what is observed. See figure 6, and note that higher cloud top pressure corresponds to lower cloud height.
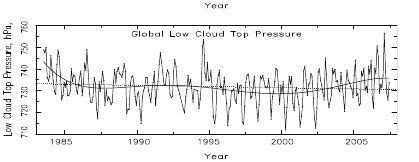
Figure 6 - Behaviour of low cloud top pressure from 1983-2008. Seasonal variations are not removed. Higher cloud pressure=lower cloud height. Cropped from original image in Erlykin & Wolfendale (2010).
We've looked at clouds from both sides now
So to summarize the main points:
- Analysis of satellite-based data by Davies & Molloy (2012) found a decrease in global cloud height between 2000-2010.
- This trend is affirmed by other recent peer-reviewed scientific publications, but there is no evidence that this trend is related to global warming itself.
- Davies & Molloy (2012) also show that the cloud height variation over the period is strongly connected to ENSO -with a La Niña-like trend readily apparent (figure 1).
- Using other satellite-based cloud data, Laken (2012) attributes this cloud height trend to ENSO - which has had a net cooling effect on the temperature of the lower atmosphere (troposphere), over the period in question.
- Erlykin & Wolfendale (2010) show that despite the falling low cloud trend in the 'noughties', the longer-term satellite observations (from 1983-2008) reveal an overall increase of low cloud height of around 40 metres. This contradicts claims of a negative cloud feedback.


 0
0  0
0 The global average of cloud height will likewise be strongly influenced by ENSO, but the secular trend outside of the ENSO variation is unmistakable.


Comments