Climate Science Glossary

Term Lookup

Enter a term in the search box to find its definition.

Settings

Use the controls in the far right panel to increase or decrease the number of terms automatically displayed (or to completely turn that feature off).

Term Lookup

Settings


All IPCC definitions taken from Climate Change 2007: The Physical Science Basis. Working Group I Contribution to the Fourth Assessment Report of the Intergovernmental Panel on Climate Change, Annex I, Glossary, pp. 941-954. Cambridge University Press.

Home Arguments Software Resources Comments The Consensus Project Translations About Support

Twitter Facebook YouTube Mastodon MeWe

RSS Posts RSS Comments Email Subscribe


Climate's changed before
It's the sun
It's not bad
There is no consensus
It's cooling
Models are unreliable
Temp record is unreliable
Animals and plants can adapt
It hasn't warmed since 1998
Antarctica is gaining ice
View All Arguments...


Username
Password
New? Register here
Forgot your password?

Latest Posts

Archives

Hansen etal hit a Climate Home Run -- in 1981

Posted on 24 August 2010 by muoncounter

Guest post by muoncounter

By nature, science is a prediction business.  We analyze what data we have available up to a given time and then we say:  Here is what will happen if ...  It is risky.  The bad news is that everybody will pounce on our failures.  So we need to look back every once in a while and celebrate one that was right.

In August 1981, Hansen, Johnson, Lacis, Lebedeff, Lee, Rind and Russell published a paper in Science entitled Climate impact of increasing atmospheric carbon dioxide, making the following predictions:

It is shown that the anthropogenic carbon dioxide warming should emerge from the noise level of natural climate variability by the end of the century, and there is a high probability of warming in the 1980s.

The predicted CO2 warming rises out of the 1sigma noise level in the 1980s and the 2sigma noise level in the 1990s (Fig 7).  This is independent of the climate models equilibrium sensitivity for the range of the likely values, 1.4 to 5.6 deg C.  Furthermore, it does not depend on the scenario for atmospheric CO2 growth, because the amounts of CO2 do not differ substantially until after 2000.

Nominal confidence in the CO2 theory will reach ~85 percent when the temperature rises through 1sigma and ~98 percent when it exceeds 2sigma.

The paper went on to forecast several effects of this warming:

  • Accelerated surface warming in the Arctic,
  • Global shifts in climate patterns (pronounced droughts in some areas and floods in others),
  • Longer agricultural seasons

The authors were somewhat hesitant to predict ice sheet melting and concomitant sea level rise, based on what they perceived was uncertainty in the thermal response time of large ice masses.  However, they mention that Arctic melting will result in the opening of both Northwest and Northeast passages and a partially ice-free Arctic. This modest recommendation was made:

 ... the degree of warming will depend strongly on the energy growth rate and choice of fuels for the next century.  Thus CO2 effects on climate may make full exploitation of coal resources undesirable.  An appropriate strategy may be to encourage energy conservation and develop alternative energy sources, while using fossil fuels as necessary during the next few decades.

The following figure is the papers figure 7, shown with a plot of smoothed GISSTemp anomalies through 2010 as an overlay.
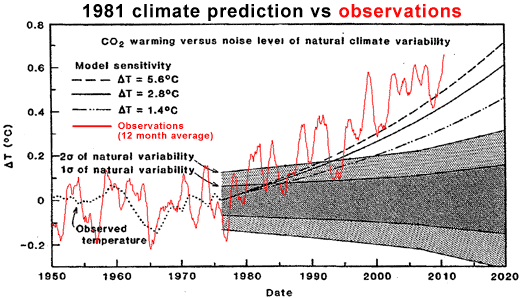
Note that the 1981 forecast was on the conservative side! 

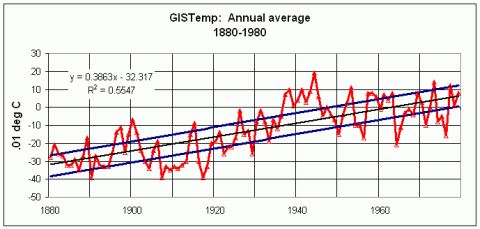
I attempted to recreate what was known at the time in the next figure, showing GISSTemp annual temperature anomalies through 1980.  A straight line trend is used to form a trend line and an envelope for the noise. 
In the final figure, this noise envelope is projected on the seasonal (summer and winter) GISSTemp record through July 2010.
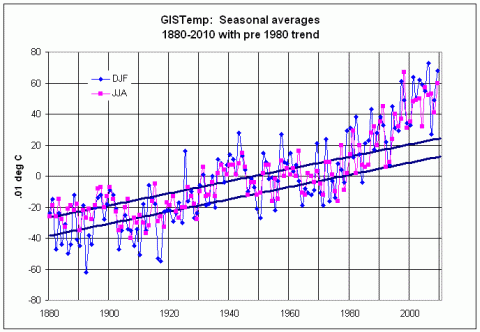

It is clear that the warming trend predicted in the paper was already underway by 1980 -- and that is why the predicted warming of Hansen's  Figure 7 was a conservative estimate. 

Note:  a subsequent Hansen paper (1988) was critically reviewed here.  Much was made of the CO2 growth rate used in the models; 1.5 ppm per year seemed excessive at the time.  The growth rate today is more than 2ppm per year. Guess we should have been paying closer attention.

0 0

Printable Version  |  Link to this page

Comments

Comments 1 to 27:

  1. O-o-o-o-K-k-k-k-k, so when we write up a 'basic' version of this, we need to explain what '1sigma' and 'temperature anomaly' mean. The latter in particular has a somewhat surprising technical sense, differing from the sense you would expect by combining 'temperature' and the usual meaning of 'anomaly'.
    0 0
    Response: Bit of "intermediate whiplash", I see, after all those Basic posts :-)

    There's no plan to write basic versions of every blog post. We're only writing basic versions of the rebuttals of skeptic arguments. Fair point though, even intermediate posts should explain the technical terminology.
  2. #1: "we need to explain what '1sigma' and 'temperature anomaly' mean" Sorry, I thought that 'temperature anomaly' was standard terminology; just about every temp graph you see (including the one in the original Fig 7) is delta T = T - (some average T). As for 1 and 2 sigma, I'm sure subsequent comments will take care of that. BTW, I stumbled on this paper after reading the 'What were climate scientists predicting' thread.
    0 0
  3. Good post ! :) The link for the 'critically reviewed' paper mentioned at the bottom of the post is not working.
    0 0
    Response: Hmm, that link seems to have disappeared into the ether. I've updated it, linking to http://www.skepticalscience.com/Hansen-1988-prediction.htm (muoncounter, if that wasn't the page you were linking to, feel free to update the post).
  4. Thanks for the article, muoncounter. Every one of these "what did scientists predict decades ago" articles I read seems to tell the same story - climate scientists have generally underestimated temperature rise and potential climate impacts. The question I would then ask - are the predictions now being published similarly conservative, or has the methodology changed to be more 'accurate'? It seems the IPCC AR4 predictions are conservative, which may be a cause for concern as authorities are basing long-term planning decisions on those predictions (particularly the sea level rise ones).
    0 0
  5. Bern, my impression is that the IPCC predictions are indeed conservative because of the requirement to reach consensus, which has the result that the most contrarian (philosophically and or economically) member nations force down the predictions so as not to frighten their own populations into asking questions about their policies.
    0 0
  6. The skeptical take on this, of course, will not be that Hansen et al understimated warming. Noooo. They will just say, "See, Hansen was wrong again."
    0 0
  7. John Brookes, but then they go on to assure us there's nothing to worry about (?), so it balances out.
    0 0
  8. Nice timing. Tom Fuller and others over at Bart's place are criticising Hansen for a supposed comment that he made about the West Side Highway being flooded today due to sea level rise in a Salon Magazine article. Fuller goes on to claim that Hansen has been discredited along with Dr. Mann. Going there now to post this link. Touche'
    0 0
  9. Where is the scientific experiments and data proving the existance of the "Greenhouse gas effect" Hypotheses are fairy-tale until we see experimental data. This paper is more circumstational evidence if its true.
    0 0
    Response: "Where is the scientific experiments and data proving the existance of the Greenhouse gas effect?"

    The greenhouse effect has been directly measured for 50 years. Planes measuring the upward spectrum from 20km up find big "bites" taken out of outgoing radiation by greenhouse gases. This is confirmed by surface measurements that find corresponding extra radiation returning to Earth at those same greenhouse gas wavelengths:

    IR spectrum at  the North Pole

    Of course, you might be asking about the increased greenhouse effect. Eg - is rising CO2 levels causing an increase in the greenhouse effect and hence causing global warming. This is also directly observed by independent measuring systems: both satellites and surface measurements find less infrared radiation escaping to space and more radiation returning to Earth.


    Change in spectrum from 1970 to 1996 due to trace gases.
  10. the sigmas are the Standard deviation of the data. An envelope of plus/minus one one sigma includes most of the date +/- 2 sigma is almost all data. In Statistical process control, the term "six sigma" is used (from IBM) to denote the ultimate goal of SPC that application is the inverse of this application as instead of expanding your data pool, it narrows it, which means no variation in output test criteria. Climate researchers have been sounding the alarm for 60 years. If you look at the global temperature data, I can see the effects of both world wars (second more than first) as well as the great depression! That tells me that we humans do have an effect on global temps.
    0 0
  11. factfinder - You ask where's the evidence for a greenhouse effect? Have you looked around on this site, or any others? Wiki on the greenhouse effect Radiative equilibrium Roy Spencer (noted skeptic) describing the GHE Another Spencer posting - "Cooler Objects Can Make Warmer Objects Even Warmer Still" Evidence for global warming Greenhouse effect with observed spectra Science of Doom gedankenexperiment on what would happen without the GHE (-18 C average temps) Introductory part-by-part overview of GHE There's tons more material out there, factfinder - this post was the result of ~90 seconds with Google. It's based on >150 years of spectroscopy, radiation physics, repeated observations, etc. Read up and enjoy the science.
    0 0
  12. #9: See also Dr. Spencer's backyard experiment measuring the greenhouse effect. "This paper is more circumstational evidence" Circumstantial? A model run 30 years ago made a prediction of current events that worked reasonably well. In my old business, that would be called a successful experiment (aka an oil and/or gas discovery) and we would be taking $$$ to the bank. In my new (part-time) business, if I predict earth-surface cosmic ray counts based on 'space weather' observed by satellites, isn't that also a successful experiment? (no $$$ in muons, unfortunately). Why is climate science a field where people get called out whether they are right or wrong?
    0 0
  13. muoncounter... Wow. Just read Spencer's backyard experiment. Am I missing something? Is he actually trying to claim there is NO greenhouse effect?
    0 0
  14. robhon - No, Spencer in that link is demonstrating the presence of backradiation with an (uncalibrated to atmospheric spectra) infra-red thermometer. Spencer feels that cloud cover provides a negative feedback to global warming which minimizes the CO2 effect (something of a minority opinion), but he's well informed enough to speak clearly about how the greenhouse effect. His post on Yes, Virginia, Cooler Objects Can Make Warmer Objects Even Warmer Still is also worth reading; he shows that the greenhouse effect doesn't violate the 2nd law of thermodynamics, and that a cool object can make a nearby warm object warmer (when the cool object is itself warmer than the background temperature).
    0 0
  15. The 1981 paper underestimated warming to a moderate extent. This tends to contradict assertions from the contrarian cult that Hansen is some kind of "alarmist". Regarding the 1988 Hansen paper, RealClimate has an update. Through 2009, the observed trend since projections started is 0.19 C per decade, vs 0.26 C per decade for Scenario B - a little behind but within margins of error. Hansen used 4.2 C for climate sensitivity. The climate sensitivity value for this model that best matches the observed trend is 3.4 C, with large error bars of course. Updates to Model Data Comparisons Annan has a recent post that looks at the 1988 model. While (as noted above) the model drifts a bit on the high side of observations (which Annan attributes to some combination of model characteristics of higher climate sensitivity, low thermal inertia, and lack of tropospheric aerosols), it has clearly demonstrated skill. Annan
    0 0
    Response: Thanks for those links, I've added them to the list of resources on Hansen's 1988 prediction.
  16. factfinder, Certainly not scientific, but a simple but compelling illustration of the infra-red activity of CO2 is shown by Iain Stewart on BBC's 'Earth: The Climate Wars' documentary.
    0 0
  17. A triumphant title ("Home Run") may be warranted, but it may repel visitors who are undecided. Try this instead: "Global temperature has increased, as predicted by Hansen etal in 1981." Or: "... etal 29 years ago."
    0 0
  18. Interesting! But is it a good idea to check Hansen's predictions with his own GISS-data? The fact that GISS-data are so much higher than the other datasets makes me suspicious. What if you do the same analysis with HadCRUT or satellite data?
    0 0
  19. fydijkstra, what are you talking about? Over the past 30 years, the global (land/ocean) surface temperature increase in GISSTEMP is virtually identical to that from HADCRUT, NCDC, and the RSS satellite record -- they're all +0.16C/decade. The only major global temperature index that's noticeably lower is UAH, at +0.14.
    0 0
  20. #18:"GISS-data are so much higher" #19:"GISSTEMP is virtually identical to that from HADCRUT, NCDC, and the RSS" See Ned's excellent summary of these virtually identical temperatures.
    0 0
  21. Thanks, muoncounter... :-)
    0 0
  22. factfinder I think perhaps you, like many skeptics, believe that the greenhouse effect is some new fangled idea dreamed up by liberals, like Al Gore. Here is a brief history of the early years. "These are the fundamentals of climate change science, and they are old hat: Fourier calculates colder earth without an atmosphere (1824) Tyndall discovers relationship between CO2 and long-wave radiation (1859) Arrhenius calculates global warming from anthropogenic CO2 (1896) Chamberlin models global carbon exchange including feedbacks (1897) Callendar predicts global warming increase catalysed by CO2 emissions (1938) Revelle predicts inability of oceans to sequester anthropogenic CO2 (1958) (From Spencer Weart's history of ACC - " http://www.aip.org/history/climate/index.htm)
    0 0
  23. Shouldn't Hansen's prediction be compared to some naive/null prediction?
    0 0
  24. With enough circumstantial evidence we may safely conclude we've accurately described a real circumstance. :-)
    0 0
  25. #23: "compared to some naive/null prediction? " The gray bars in Hansen's fig 7 are bounds on what temperatures would do if all climate variation was within 'the noise level of natural variation'. Temperature anomalies rose out of the noise in the mid-late 80's, as predicted. Isn't that the real key? When a natural phenomenon rises out of its natural range of observations, its time to go looking, via modeling runs or whatever tools are available, for the causes.
    0 0
  26. Shouldn't this article have a "Lessons from Predictions" button and be included in the series?
    0 0
  27. Confidence in CO₂warming today must be... what, 99.9999%, or something? - Maybe we could say 1 in 1,744,277 chance of the warming being due to natural climate variability.
    0 0

You need to be logged in to post a comment. Login via the left margin or if you're new, register here.


The Consensus Project Website

THE ESCALATOR

(free to republish)


© Copyright 2024 John Cook
Home | Translations | About Us | Privacy | Contact Us