Earth's Climate History: Implications for Tomorrow
Posted on 26 July 2011 by James Hansen
This a re-post of an article by James E. Hansen and Makiko Sato
The past is the key to the future. Contrary to popular belief, climate models are not the principal basis for assessing human-made climate effects. Our most precise knowledge comes from Earth's paleoclimate, its ancient climate, and how it responded to past changes of climate forcings, including atmospheric composition. Our second essential source of information is provided by global observations today, especially satellite observations, which reveal how the climate system is responding to rapid human-made changes of atmospheric composition, especially atmospheric carbon dioxide (CO2). Models help us interpret past and present climate changes, and, in so far as they succeed in simulating past changes, they provide a tool to help evaluate the impacts of alternative policies that affect climate.
 Humans lived in a rather different world during the last ice age, which peaked 20,000 years ago. An ice sheet covered Canada and parts of the United States, including Seattle, Minneapolis and New York City. The ice sheet, more than a mile thick on average, would have towered over today's tallest buildings. Glacial-interglacial climate oscillations were driven by climate forcings much smaller than the human-made forcing due to increasing atmospheric CO2 -- but those weak natural forcings had a long time to operate, which allowed slow climate feedbacks such as melting or growing ice sheets to come into play.
Paleoclimate data yield our best assessment of climate sensitivity, which is the eventual global temperature change in response to a specified climate forcing. A climate forcing is an imposed change of Earth's energy balance, as may be caused, for example, by a change of the sun's brightness or a human-made change of atmospheric CO2. For convenience scientists often consider a standard forcing, doubled atmospheric CO2, because that is a level of forcing that humans will impose this century if fossil fuel use continues unabated.
We show from paleoclimate data that the eventual global warming due to doubled CO2 will be about 3°C (5.4°F) when only so-called fast feedbacks have responded to the forcing. Fast feedbacks are changes of quantities such as atmospheric water vapor and clouds, which change as climate changes, thus amplifying or diminishing climate change. Fast feedbacks come into play as global temperature changes, so their full effect is delayed several centuries by the thermal inertia of the ocean, which slows full climate response. However, about half of the fast-feedback climate response is expected to occur within a few decades. Climate response time is one of the important 'details' that climate models help to elucidate.

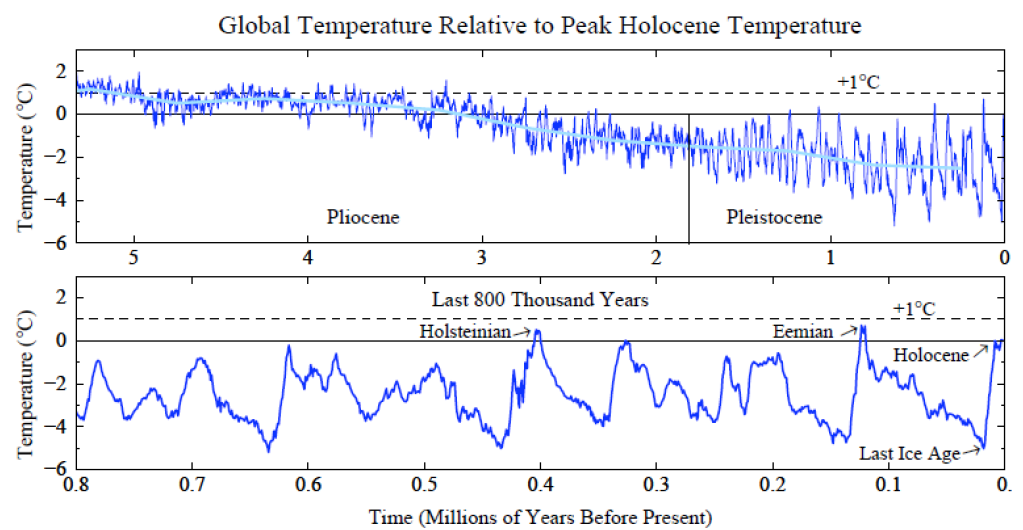
Fig. 1. Global temperature relative to peak Holocene temperature, based on ocean cores.
We also show that slow feedbacks amplify the global response to a climate forcing. The principal slow feedback is the area of Earth covered by ice sheets. It is easy to see why this feedback amplifies the climate change, because reduction of ice sheet size due to warming exposes a darker surface, which absorbs more sunlight, thus causing more warming. However, it is difficult for us to say how long it will take ice sheets to respond to human-made climate forcing because there are no documented past changes of atmospheric CO2 nearly as rapid as the current human-made change.
Ice sheet response to climate change is a problem where satellite observations may help. Also ice sheets models, as they become more realistic and are tested against observed ice sheet changes, may aid our understanding. But first let us obtain broad guidance from climate changes in the 'recent' past: the Pliocene and Pleistocene, the past 5.3 million years.
Figure 1 shows global surface temperature for the past 5.3 million years as inferred from cores of ocean sediments taken all around the global ocean. The last 800,000 years are expanded in the lower half of the figure. Assumptions are required to estimate global surface temperature change from deep ocean changes, but we argue and present evidence that the ocean core record yields a better measure of global mean change than that provided by polar ice cores.
Civilization developed during the Holocene, the interglacial period of the past 10,000 years during which global temperature and sea level have been unusually stable. Figure 1 shows two prior interglacial periods that were warmer than the Holocene: the Eemian (about 130,000 years ago) and the Holsteinian (about 400,000 years ago). In both periods sea level reached heights at least 4-6 meters (13-20 feet) greater than today. In the early Pliocene global temperature was no more than 1-2°C warmer than today, yet sea level was 15-25 meters (50-80 feet) higher.
The paleoclimate record makes it clear that a target to keep human made global warming less than 2°C, as proposed in some international discussions, is not sufficient – it is a prescription for disaster. Assessment of the dangerous level of CO2, and the dangerous level of warming, is made difficult by the inertia of the climate system. The inertia, especially of the ocean and ice sheets, allows us to introduce powerful climate forcings such as atmospheric CO2 with only moderate initial response. But that inertia is not our friend – it means that we are building in changes for future generations that will be difficult, if not impossible, to avoid.

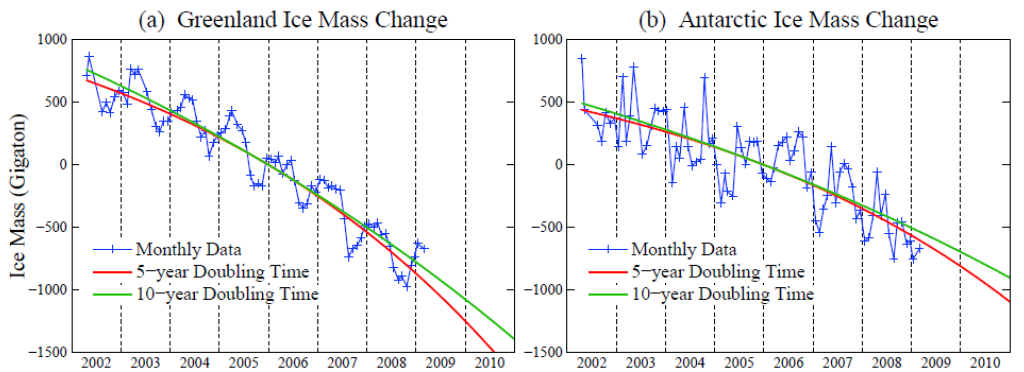
Fig. 2. Greenland (a) and Antarctic (b) ice mass changes deduced from gravity field measurements by Velicogna (2009) and best-fits with 5-year and 10-year mass loss doubling times.
One big uncertainty is how fast ice sheets can respond to warming. Our best assessment will probably be from precise measurements of changes in the mass of the Greenland and Antarctic ice sheets, which can be monitored via measurements of Earth's gravitational field by satellites.
Figure 2 shows that both Greenland and Antarctic ice sheets are now losing mass at significant rates, as much as a few hundred cubic kilometers per year. We suggest that mass loss from disintegrating ice sheets probably can be approximated better by exponential mass loss than by linear mass loss. If either ice sheet were to lose mass at a rate with doubling time of 10 years or less, multi-meter sea level rise would occur this century.
The available record (Figure 2) is too brief to provide an indication of the shape of future ice mass loss, but the data will become extremely useful as the record lengthens. Continuation of these satellite measurements should have high priority.
A copy of this web page is also available as a PDF document.
References
Hansen, J., M. Sato, 2011: Paleoclimate implications for human-made climate change, Accepted for publication in "Climate Change at the Eve of the Second Decade of the Century: Inferences from Paleoclimate and Regional Aspects: Proceedings of Milutin Milankovitch 130th Anniversary Symposium" (A. Berger, F. Mesinger, and D. Šija?i, Eds.)
Velicogna, I., 2009: Increasing rates of ice mass loss from the Greenland and Antarctic ice sheets revealed by GRACE, Geophys. Res. Lett., 36, L19503, doi:10.1029/2009GL040222.


 Arguments


 0
0  0
0


Comments