Climate Science Glossary

Term Lookup

Enter a term in the search box to find its definition.

Settings

Use the controls in the far right panel to increase or decrease the number of terms automatically displayed (or to completely turn that feature off).

Term Lookup

Settings


All IPCC definitions taken from Climate Change 2007: The Physical Science Basis. Working Group I Contribution to the Fourth Assessment Report of the Intergovernmental Panel on Climate Change, Annex I, Glossary, pp. 941-954. Cambridge University Press.

Home Arguments Software Resources Comments The Consensus Project Translations About Support

Bluesky Facebook LinkedIn Mastodon MeWe

Twitter YouTube RSS Posts RSS Comments Email Subscribe


Climate's changed before
It's the sun
It's not bad
There is no consensus
It's cooling
Models are unreliable
Temp record is unreliable
Animals and plants can adapt
It hasn't warmed since 1998
Antarctica is gaining ice
View All Arguments...


Username
Password
New? Register here
Forgot your password?

Latest Posts

Archives

Has Arctic sea ice returned to normal?

Posted on 24 April 2010 by John Cook

An argument gaining popularity in 2010 is that Arctic sea ice has recovered from its long-term decline. Winter sea-ice extent bounced back strongly in the cold Arctic winter of 2010. Anthony Watts tells us that Arctic sea ice is returning to normal. However, this argument only looks at one piece of the puzzle while neglecting the full picture of the Arctic sea ice. Consequently, I've added a new rebuttal to the argument 'Arctic sea ice has recovered' (the 108th skeptic argument). This is basically a simplified version of Peter Hogarth's comprehensive review of peer-reviewed research into Arctic sea ice (and also includes useful information from the comments).

When people talk about the state of Arctic sea ice, they most commonly refer to sea ice extent. This is the area of ocean where there is at least some sea ice (the most common cut-off is 15%). Sea ice extent shows a strong seasonal cycle as Arctic ice melts in the summer, reaching a minimum in September, then refreezes in the winter, peaking in March. Temperature is the main factor driving changes in sea ice extent, although other factors like wind patterns and cloudiness play a part. While sea ice extent has been steadily declining in recent decades, it fell to a record low in 2007 due to a combination of factors.
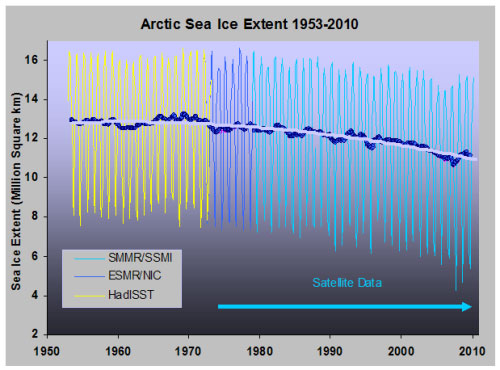
 
Figure 1: Sea ice extent with trend from 1953 onwards.

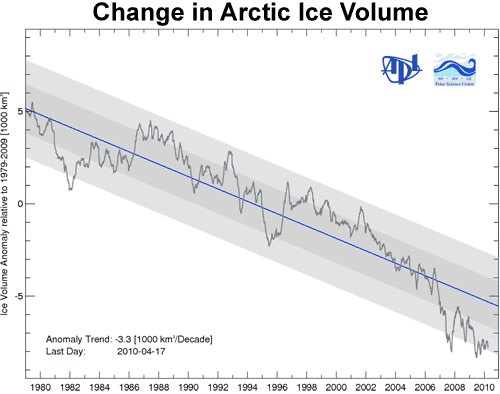
Sea ice extent gives us a reasonable indication of the amount of Arctic sea ice but does have its limitations. Extent tells us about the state of the sea ice at the ocean's surface, not what's happening below. A better metric for the total amount of sea ice is, well, the actual total amount of sea ice, measured by sea ice volume. Satellite radar altimetry (Giles 2008) and satellite laser altimetry (Kwok 2009) find that Arctic sea ice has been thinning, even in 2008 and 2009 when sea ice extent showed a slight recovery from the 2007 minimum. So while some claimed Arctic sea ice was recovering after 2007, the total volume of Arctic Sea ice through 2008 and 2009 were the lowest on record (Maslowski 2010, Tschudi 2010).
Arctic sea ice volume anomaly
Figure 2: Continuously updated Arctic Sea Ice Volume Anomaly Polar Ice Center.

Currently, websites such as Watts Up With That are using sea ice extent in 2010 to claim Arctic sea ice has returned back to normal. A few days ago, Watts claimed that we had "more ice than any time on this date for the past 8 years". On the contrary, in March 2010, the total Arctic sea ice volume was 20,300 km3 - the lowest March value for total sea ice volume over the 1979-2009 period. Those who claim Arctic sea ice has returned to normal are focussing at the thin shell at the top and neglecting the steadily thinning sea ice below.

0 0

Printable Version  |  Link to this page

Comments

1  2  Next

Comments 1 to 50 out of 73:

  1. As I understand it, one of the key problems with a reliance on sea-ice extent is-whilst you may have one good year of ice recovery-that this ice will be relatively new & thus more prone to melting come the next Summer. As I also understand it, what concerns scientists is the lack of multi-year ice. For my part, when non-specialized trade vessels can sail the extent of the North-West Passage-in late Autumn-then there is something to be concerned about!
    0 0
  2. Also, I do find it amusing that the skeptics leap on a single years worth of "good" news to prove their point, yet they're the quickest to dismiss even a few years of *bad* news, claiming its insufficient to prove a trend. They certainly score zero points for consistency ;)!
    0 0
  3. A genuinely puzzling question. If ice volume is a better gauge of arctic sea ice and if the trend is more worrying why is this not regularly used as the standard for measuring arctic sea ice condition? The way you word things it sort of suggests that WUWT are cherry picking the ice extent to tell a certain story. But most of the serious science website that provide day-to-day arctic sea ice coverage focus on ice extent as well (NSIDC, arctic roos, DMI, cryospere today etc). Are there uncertainties with measuring ice volume?
    0 0
  4. Watts -as most deniers- is a cherry picker. I remember when he cheerfully tried to capitalize on the 2008 La Niña temperature drop, and now totally ignores the recent temperature rise. Many people believe him, but that's just the human problem of sticking to anyone that says what one wants to listen. It does not have anything to do with the quality of data, or accuracy of analysis.
    0 0
  5. When you look at graphs of Arctic sea ice extent plotted against time, graphs like the one John posted above, two conclusions seem visually obvious. There are very large random fluctuations, and there is a very clear long term decreasing trend. Because of the large short time variations, I don't think that one shoud be too impressed by either the sea ice minimum of 2007 or by the alleged recovery. These could be random events, and do not touch the long term trend. The available data on ice thickness are strongly suggestive, but they only span about 5 years. Because we already know that we have to deal with strong short time variations, it is not clear to me that they do represent a long term trend. Zhang's thickness graph above goes back to 1980, but it seems to be based on models, so we only believe it if we believe in those models. Still, the data on ice extent very clearly points to a trend towards less ice. The most obvious explanation would be global warming. But is it certain that this decrease is linked to that - yes, it does sound like a very foolish thing to say, but after all, we know that the situation in the Antarctic sea is very complicated. The sea around Antarctica is warming, but the extent of ice in that warming water is increasing. There are several interesting attempts to explain this, including a subtle model by Jinlun Zhang et al., but I don't think that we really understand what is going on there. If we don't understand the dynamics of ice around Antarctica, how can we be sure that we understand the dynamics of ice around the North Pole?
    0 0
  6. I agree that sea ice extent may not be the best metric of a warming Arctic, and I imagine the choice of the 15% cut-off adds to this, while sea ice volume should be better (given that it can be measured well). But sea ice area is quite important mechanistically in terms of albedo. Therefore I'm fine with skeptics focusing on extent. It will come back to bite them in the end, though, since you can only spread a given volume so thin.
    0 0
  7. Marcel Bokstedt said:
    Zhang's thickness graph above goes back to 1980, but it seems to be based on models, so we only believe it if we believe in those models.
    However, if you read the linked information you will see that Zhang's model has been confirmed by recently released US Naval measurements from it's under polar ice submarine patrols.
    PIOMAS has been extensively validated through comparisons with observations from US-Navy submarines, moorings, and satellites.
    0 0
  8. Marcel #5 Scientific papers often use the expression "this is consistent with..." instead of categoric assertions like "this is proof that...". There are lots of evidence pointing to AGW. Arctic ice loss is just one of them. Is it possible that other factors concur (as you rightly pointed out)? Sure. Do we have any evidence of that? Hardly. I think of it like a crime investigation. The accused was seen entering the victim's house before the estimated time of the murder, and a car like his was seen leaving the neighborhood an hour later. The crime weapon was his property, and his hand had the chemical marks of firing the gun. He had the gun when the cops searched him afterwards. The victim had an affair with the accused's wife (there was a motive). Does it prove beyond refutation the accused is guilty? Not quite. We can imagine some unlikely story in which he practiced shooting in his backyard and went to a friendly visit to the victim, and a third party stole his gun for an hour just to make him look guilty. But there's no evidence of this made-up story. On the other hand, do we have enough information to take concrete measures about it (eg convict the accused)? Most likely. Your question is a good one, and maybe some other commenter here knows a cause attribution study about this ice loss. I just feel it's important to keep the issues in perspective.
    0 0
  9. Ian Forrester> Yes, the submarines give a point in favour of the model. It does not look like a strong confirmation; there seems to be deviations on the order of meters of thickness. Also, it's hard to evaluate the quality of the submarine measurements from the web page. Maybe someone knows more about this? Alexandre> My question was not about AGW or not, but about the connection between the warming of the Arctic and the loss of ice. I just wanted to make the point that this connection might be more complex than what one would immediately assume.
    0 0
  10. Marcel #9 Understood. Answering this good question of yours would be the role of a cause attribution study. I think I already saw one about this issue somewhere.
    0 0
  11. #3 HumanityRules, measuring sea ice extent is a fairly simple mapping problem given satellite imagery. I would expect that the extent measurement is largely or totally an automatic process given the input images. Measuring volume requires you to measure the thickness of the ice as well, and until the last several years that required making thickness measurements by direct sampling, submarine, or some other method. Even now, I think it takes more work than measuring extent. In the past, it would have taken a lot of work to make that estimate. So there is nothing wrong with reporting extent or discussing it. You just have to keep in mind what extent is, and what it is not. It is sea ice cover, and not sea ice volume. If you have ever watched the ice break up on a frozen lake, you will know that cover and volume can have very little to do with each other. If Watts is trumpeting a claim that sea ice has returned to normal because extent has returned to normal, while at the same time volume data show the lowest volume yet recorded, then cherry-picking is about the kindest assessment you can make of that.
    0 0
  12. During winter sea ice extent (or area) is largely determined by the weather at the margin of the ice sheet, i.e. at relatively "low" latitudes. Last winter has been cold at these low latitudes but the arctic at higher latitudes was warmer. This is an example of the interannual varibility that says nothing about the trend. And this is why it makes no sense to say that from 2007 arctic sea ice has recovered. Unless one means that the this year number is higher, which no one doubts, a recovery or reversal of the trend cannot be assessed nor we have (at the moment, at the very least) reasons to believe it's going to happen.
    0 0
  13. Every year in March the skeptics claim everything is fine. Every year, in September the pro-AGW sides claims things are not going well. I think it argues against looking at any year or short span of years. While volume does seem the superior measure, the 5 years of consistent data available are insufficient to make a solid claim (although even at 5 years the data is a notable counter to "ice extent is recovering").
    0 0
  14. One reason the NSIDC uses the extent is because it is easy to defend. It is a simple measurement and they have 30 years of data. To obtain the ice area you need to massage the data. Cryosphere Today displays the ice area because they think it is a better measure. Good scientists can disagree on small points. WUWT criticizes the NSIDC for using the SSM/I sensor instead of using the similar AMSR-E sensor. The NSIDC website states that the SSM/I sensor is more precise (the year to year variation is less) but the AMSR-E sensor is more accurate (the measured value is closer to the true value). The difference between the two sensors is small, but WUWT still complains about not using the more accurate value (WUWT does not seem to understand precision versus accuracy). NSIDC values the long term precision for their records. The volume data require even more processing (including a model!) so WUWT would have a fit if a change to that measure was made. In the end the long term trend will win out. If the ice volume is really that much lower the next summer that has conditions favoring melt will really melt. If the volcano in Iceland goes on for a long time it might affect sea ice this summer. We will have to wait until September to see what happens this summer. WUWT will always spout off when there is a small shift toward recovery, even if it is just noise in the data. They will quiet down when the cycle goes back to the long term trend.
    0 0
  15. This report may be of some relevance. Apologies if it has been posted before. http://www.jamstec.go.jp/frsgc/research/d2/masayo.ogi/2009GL042356-pip.pdf Abstract Based on a statistical analysis incorporating 925-hPa wind fields from the NCEP/NCAR Reanalyses, it is shown that the combined effect of winter and summer wind forcing accounts for 50% of the variance of the change in September Arctic sea ice extent from one year to the next ( Δ SIE) and it also explains roughly 1/3 of the downward linear trend of SIE over the past 31 years. In both seasons meridional wind anomalies to the north and east of Greenland are correlated with September SIE, presumably because they modulate the export of ice through Fram Strait. Anticyclonic wind anomalies over the Beaufort Sea during summer favor low September SIE and have contributed to the record-low values in recent summers, perhaps by enhancing the flux of ice toward Fram Strait in the trans-polar drift.
    0 0
  16. Another issue with sea ice extent that seems to me to be of importance for its use as a proxy for more relevant metrics like volume as well as for its policy uses derives directly from its low cut-point definition (at least 15% ice covered). Just in terms of coverage itself, two years with equal over-all total sea ice extent, say X million square km, could represent very different amounts of equivalent amount of surface area covered 100% with ice (i.e. what might be called ‘full-ice equivalent’ sea ice extent): say, 0.80 × X million square km in one case and in another, say, 0.40 × X million square km. This would obviously have very different implications for the albedo effect, among other policy-relevant considerations. Indeed, this ‘full-ice equivalent’ sea ice extent metric may well be declining even as the over-all total sea ice extent is gaining, depending on conditions, etc.
    0 0
  17. It appears to me that the skeptics confuse average with normality. They suggest that an average extent recorded for March from 30 years of data represents normality. It does not. Normal sea ice extent is probably better taken as the extent in 1970 or earlier where the records show a long period of steady not declining cover. After that the extent declines so any average of recent data is below the starting point and not useful as a definition of normality. Sometimes average can be used to mean normality and arguments are made where the two terms are interchangeable. This is not the case here. The skeptics deliberately make a false argument by exploiting the fact that these different concepts may be treated as equivalent by the unwary reader.
    0 0
  18. 11.Jeff Freymueller and others Honestly the way you talk you would think Watts invented sea ice extent. All the international and national bodies that concern themselves with Arctic sea ice generally use ice extent as their primary measure. For example NSIDCto make their monthly assessement and daily measurements in terms of ice extent, and I'm not cherry picking NSIDC to make a point either. It's just a ridiculous claim to say Watts cherry picks ice extent. I checked his blog he's been reporting this metric back to 2007 when it was showing the all time low. In fact you could actually accuse SkepticalScience of cherry picking by changing from ice extent, which no longer shows what it would like to report, to ice volume which is more convinient. I actually don't believe this I understand John's wish to show the full story but I equally think you can't really blame Watts for using the 'standard' metric. I still wonder why all the international and national bodies don't use ice volume as their standard metric?
    0 0
    Response: NSIDC and other organisations use sea ice extent but none of them use sea ice extent to say "Arctic sea ice has returned to normal". It's entirely appropriate to refer to sea ice extent and citing sea ice extent is not the issue here.

    The issue is the conclusions you draw from the sea ice extent data. It's inappropriate and misleading to say sea ice has returned to normal based on extent data because this is decidedly not the case - the total amount of sea ice is at record low levels.

    So the major point here is that citing sea ice extent data needs to be interpreted in proper context, being aware that the thicker ice below the surface is thinning and that total sea ice is at record low levels at the moment.
  19. HumanityRules #18 I'm not sure that you understand what cherry picking is. It's to select carefully just the fraction of data that supports what you want to be true. Like picking Germany and Austria in Europe and say "my sampling shows that virtually all Europe speaks German". Watts does not "cherry picks sea ice extent" (as a parameter). He just picks a moment of near-average sea ice extent and shouts "it's back to normal!", as if the problem, if once existed, would be gone now. He does not analyse the whole dataset - he cherry-picks the convenient moments. If he did analyse the whole thing, he would find this near-average blip is as insignificant as the Jan 2008 cool spell as far as the trend is concerned.
    0 0
  20. I would hardly expect sea ice to 'normalise' so rapidly as to be back to normal within a year. The problem here is that both sides of the debate love cherries :-). I do recall recent arguments on this site suggesting that the recent extreme cold weather in Europe and Northern hemisphere generally was effectively a result of warmer weather in the Arctic - perhaps counterintuitive if we have evidence of new ice formation. Moreover, any recovery in ice cover can only begin with newer ice - you can't expect old ice to appear save with the passage of time. Marcus @ 1 points out that new ice is more vulnerable to melting - well, of course. But we don't know how much will melt and how much will eventually form part of old ice until we see the impact of the coming summers and the following winters. Steve L @ 6 notes the possible relevance of albedo with increased ice extent. Steve seems to believe this will ultimately be cold comfort (dreadful pun, I know) to the sceptical camp. John D @ 15 speaks of the contribution of wind forcings. The reality is that we're dealing with highly complex systems. Marcel Bökstedt @ 5 highlights this well. Extrapolations from one winter's data mean little irrespective of where you stand in the warmist - sceptical spectrum.
    0 0
  21. The increase albedo that Steve L refers to should actually help cooling (looking forward in time). On the other hand, thinner ice is more than a proxy (referring to Gestur's use of the word), as it actually influences climate acting as buffer (energy storage sink) to maintain a cooler planet.
    0 0
  22. Sorry about my post 21. Very ambiguously written sentence. I meant that ice in general keeps things cooler, so thin ice is not going to help. The thicker the better, obviously.
    0 0
  23. #18 HumanityRules: "In fact you could actually accuse SkepticalScience of cherry picking by changing from ice extent, which no longer shows what it would like to report, to ice volume which is more convinient." I'm sorry, HR, but this is a really silly statement. If you want to talk about the AMOUNT of sea ice, you really should be talking about the VOLUME of sea ice (or the MASS, if you like). Extent is useful, but it is not volume. The point is that volume has always been more important than extent, but the continuous time series of extent estimates goes back a lot longer. So there is value in measurements of both extent and volume, but they need to be interpreted based on what they are.
    0 0
  24. #20 chriscanaris, warmer than average weather in the Arctic is still plenty cold enough to result in the formation of more sea ice, because the surface air temp is well below 0C. In any case, during the cold spell in North America, the area that was much warmer than average was more like the Hudson's Bay area -- well south of the Arctic Ocean and not really "Arctic". So I'm not sure why it seems "perhaps counterintuitive" that when a cold air mass moves south, it is replaced by other air that in this case was warmer (as opposed to leaving a vacuum in the north?), and in any case the "warm" temperatures in that area were still below freezing, and not in the Arctic Ocean. I don't remember the situation north of Europe -- that may have been more relevant for Arctic sea ice formation, but I just don't recall.
    0 0
  25. There is something a little bit extraordinay about this years Arctic ice. The following show ice concentration, i.e. the % of sea covered by ice. Almost all the Arctic Ocean is covered by 100% ice (dark purple). Shown here are 1st Jan, 1st Feb, 1st Mar and 1st Apr 2010. Compare this with the earliest winter on record, 1980. You can see much more pale purple regions, suggesting areas with as little as 80% coverage. 2007 didn't look great but then neither did 1986, most years seem to look like 1980. The images are generated using a tool on the Cryosphere Today website where you can check as much of the intervening years as you wish. 2010 looks so good you can't help thinking it's a data error. Since we're after the full picture I thought it was worth throwing this into the mix.
    0 0
  26. 23.Jeff Freymueller I agree. Therefore the quality of the ice volume data has to be highlighted because this is the drawback of that particular metric. I don't see any of this in the article and given we're after the full story then maybe it should. For example from what I can tell Figure 2 is MODELLED data based on ice concentration.
    0 0
  27. "Figure 2 is MODELLED data based on ice concentration." and much more ...
    0 0
  28. Jeff Freymueller @ 24: warmer than average weather in the Arctic is still plenty cold enough to result in the formation of more sea ice, because the surface air temp is well below 0C. Fair point. However, most of the Arctic was warmer last winter - not just Hudson Bay. As I recall, the argument on this site relating to Northern Hemisphere snowstorms suggested they arose in the context of increased precipitation due to warmer weather. Indeed, we have just had the warmest March since 1979 as per the satellite record. Even if much of the Arctic has temperatures below 0 degrees, I would expect the overall area below 0 degrees to be smaller and for 0 degree conditions to persist for shorter periods hence leading to less by way of new ice formation. This is what I consider counterintuitive - hence, my wondering (naively perhaps) just how direct is the dependence of sea ice on temperature. Given all this, Humanity Rules @ 25 sums it up well saying, 'There is something a little bit extraordinary about this years Arctic ice.'
    0 0
  29. I looked at some links from Peter Hogarth's excellent post. It seems that there is a lot of evidence that the Arctic ice has been getting thinner. The quality of the data can be questioned, but they do pile up. First, there are the submarines. They did measure ice thickness from below, using sonar. Kwok and Rothrock report that there were two periods of submarine voyages under the ice. The first one was 58-76, the second 93-97. The reported difference in thickness is 1-2 meters, which is a lot. The problem with those data is that there were not that many voyages, it seems to have been about 10 in all in either period. Then there are early direct observations 1955-2002, and buoys. Rigor and Wallace report on those. They show a decline in ice thickness. R&W state that this happend very fast in 1989-1990, and blame it on the Arctic Oscillation which was in an extreme "positive" state at this point. A positive AO index means low pressure at the pole. This would be compatible with the submarine observations. They predict (in 2004) that the trend will soon reverse, and the ice thickness will build up again. This prediction has not come true, but on the other hand, the AO index has stayed on the positive side. There are additional data from satellites and observations from locals, that all point to a decrease in ice thickness since about 1955. The conclusion seems to be that we have had a decrease in both extent and thickness, giving an even bigger decrease in ice volume. Humanity Rules> Yes, I noticed that darkening of the purple too, but I don't know what it means. Maybe we should mail the guys at cryosphere today and ask if it is real or an artifact?
    0 0
  30. HumanityRules #25 - As far as a whole picture of the trend goes, I don't think you can get much wholer then Figure 1. It shows the full series, as opposed to the snapshots. Marcel Böksted #29 - It is very reasonable to assume that the AO index has some influence in arctic sea ice. On the other hand, there is also some debate whether this oscillation is in some way influenced by the anthropogenic sea temperature rise. The math (ie the models) predicted Arctic Sea Ice would melt under AGW. It is actually melting faster than that. I still want to find that paper about sea ice loss cause attribution. I was hoping some other commenter could help us here...
    0 0
  31. Marcel Böksted I've just done a quick research myself. This Francis 2005 looks like something I meant before. They basically say direct longwave radiation (ie GHE) accounts for the largest part of sea ice loss (40%). Solar variation in the region is negative. Positive feedback due to albedo variation is also important, and there's some discussion (a bit outside the scope of the paper) about other factors, such as increased precipitable water. About winds: "Anomalies in meridional winds also explain significant variance in most areas except for the Barents and Beaufort Seas, but the influence is much weaker than expected." (I did not read it all, just a quick look at the abstract and conclusions)
    0 0
  32. An important current research aim is to improve forecasting sea ice abilities. The 2010 forecast model is available at Polar Science Center They show a slow start to the season, and a greater development of the Northwest Passage than Northeast Passage. The key will be the fine tuning of the model for future years based on its experiences this year. Forecasting a season ahead is tricky of course, what will summer conditions be? It is important just as it is to forecast glacier mass balance before the summer is underway. 2010 Mass balance forecast
    0 0
  33. The ice maps at Cryosphere Today frequently change in color from day to day. Their sensors have difficulty telling open water from melt pools on top of the ice. That means that if it is warm for a few days and pools form on top of thick ice, they show it as broken ice or open water. When it gets cold again the pools freeze and it shows as ice again. It is better to wait for a month to see what melts, rather than speculate how thick the ice is from some small changes in color. The NSIDC uses monthly averages to remove much of this type of error.
    0 0
  34. Also, I don't understand why a high value of AO would lead to less ice, while a high value of the corresponding index in the South hemisphere is supposed to lead to stronger winds, more polynyas and more ice. This is probably related to the overall geography around the poles, but not so intuitive. Alexandre> I find the paper by Francis et al. confusing. It is mostly about statistical correlations, and it is not so easy to figure out what is cause and what is effect. As you say, they don't believe that winds are important - the polynyas don't matter. But they must be there, after all that word is Russian. michael sweet> That's good to know. But it still does not explain why the maps from this year look different from the maps from previous years.
    0 0
  35. This fake argument about a bit of Seasonal (and Weather-related) ice formation being the "return to normal" was in Canada's Globe and Mail a couple of weeks back and generated plenty of the usual arguments. Interestingly, the article itself was MOSTLY about Mark Serreze (NSIDC)'s frustration that his research was being misappropriated by the usual suspects among the climate skeps/deniers. What really impressed upon me was that most of the ice in question was in the Bering Sea, not noted as a site for Perennial Ice! This really does illustrate the confusion that persists in many people's opinions between long-term and weather-related trends. It has been a spectacularly aberrant Winter this past year, according to many regional expectations for normal weather. It is important to argue and defend a more circumspect perspective e.g. in this case that cold air masses get pushed around by the warmer, especially in a Season characterized by El Nino and a strong NAO, and that persistent cold temperatures WILL yield more Seasonal Ice. In contrast to the dearth of Ice Pack in Eastern Arctic/Canada of course. Anyway I'm new posting here, mostly here to be better informed given that I am not a Climate Scientist, so my contributions to the discussion are pretty much rhetorical. I do want to help combat the ignorant, pasted blogtrotting that goes on in commentary in Mass Media however. So I'll be checking in more or less irregularly!
    0 0
  36. Steve #6 points out the importance of sea-ice extent relative to a positive ice-albedo feedback. This is underlined by a recent report from the Pew Environment Group concerning the “climate services” provided by arctic snow and ice and the potential economic costs of their disappearance. From a summary of the study: “The report calculates that this year alone, Arctic melting [of sea-ice, snow-cover, and permafrost] may warm the Earth an amount equivalent to pumping three billion metric tons of CO2 into the atmosphere. 'That’s equal to forty percent of all U.S. industrial emissions this year or bringing on line more than 500 large coal-burning power plants,' said Dr. Eugenie Euskirchen, co-author of the report and a scientist from the University of Alaska at Fairbanks’ Institute of Arctic Biology.”
    0 0
  37. #28 chriscanaris: "Even if much of the Arctic has temperatures below 0 degrees, I would expect the overall area below 0 degrees to be smaller and for 0 degree conditions to persist for shorter periods hence leading to less by way of new ice formation. This is what I consider counterintuitive - hence, my wondering (naively perhaps) just how direct is the dependence of sea ice on temperature." The average winter temperature in the Arctic Ocean is not just below 0C, it is far below 0C. In Barrow, Alaska (Arctic coast), the winter average temp is around -25C (Dec through March), that's the daily mean not the low. I don't know how much this varies across the entire Arctic Ocean basin, but the bottom line is that air temps are far below freezing and this will favor the production of sea ice everywhere in the Arctic Ocean all winter. I would bet that the answer is known to your question about how direct is the dependence on temperature -- but I don't know it. I don't think the question is naive. Simple physics says that everywhere there is open water and air at -20C or -25C will mean there is significant heat loss from the water and this will favor sea ice formation, but the water doesn't just sit there in place so wind and waves causing water to mix will also have an impact, and the formation of some ice will also change the rate of heat flow out of the water+ice to the air.
    0 0
  38. HumanityRules #18 And the upshot of what Alexandre explains in #19 is that amateur skeptics, Republican politicians and right wing media take what people like Watts say, and turn it into another global warming skeptic/denier meme, which then becomes more proof to them that AGW is hogwash. It then is a new "proof" in their littany of arguments, which get repeated endlessly in the skeptic echo chamber. An example of this are the claims in Febuary that global warming is over because a big part of the U.S. got a lot of snow. Actually one of the snowstorms that hit Washington DC happened on the warmest Febuary 6th on record, globally that is. But this nonsense was repeated in every right wing media outlet, the blogosphere and by Republican polticians. Donald Trump even said Al Gore's Nobel Prize should be taken away because this was proof against AGW. It was a record warm winter. Another example is the fallacious claim that IPCC scientist Phil Jones said there has been no warming since 1995. He never said that. But it is now another proof for skeptics,- another phony argument in their littany. And Watts feeds and encourages this nonsense. And so it goes.
    0 0
  39. In the Polar Science Center, how I can get the month-by-month Arctic Sea Ice Volume Anomaly and Total Volume data, so that I can plot it in EXCEL?
    0 0
  40. #38 sailrick If climate alarmists would denounce Al Gore's "proof" being melting ice caps (poor lonely polar bears) and freezing cold winters, then skeptics wouldn't use his own examples against the climate alarmists when those examples reverse.
    0 0
  41. Karl (#40), The Arctic ice *is* melting though, and it has been declining for decades. Polar bear habitat *is* threatened. The situation has not reversed at all. It gets tedious as well that every denier thinks that attacking Al Gore is the same as attacking climate science. He's irrelevant to the science.
    0 0
  42. The amount of ice that forms in winter is related to the temperature and also to ocean currents. The central arctic entirely freezes over. In the Atlantic Ocean and Bearing sea, currents and winds interact to form ice. This year unusual winds in March and April have caused a lot of ice to form. We will have to see how if affects the summer melt.
    0 0
  43. "Normal" is very hard to determine, especially when dealing with anything that changes or evolves over time, the climate and all living things for example. This may be off topic slightly, but perhaps if we are to find a basis for establishing "normal" conditions on our planet, and that includes Arctic ice, we need to establish a bench mark of some relevant indicator that all else can be measured against. As humans we should know what a normal diet is, too little food and we waste away, too much and we become obese, a "normal" diet should be one that allows our bodies to grow and perform close to their full potential. In the natural world plants also have their diet that allows them to grow and perform close to their full potential, and part of that diet is that basic building block of all life, carbon. It is known that many plants need nearly 3 times the present concentration of CO2 in order to reach their optimum growth, and this knowledge is widely used by enriching the immediate atmosphere of the plants with CO2. Therefore should the establishment of a "normal" bench mark for all things related to climate be based on what conditions would be, including Arctic ice, with an atmosphere containing 3 times the present levels of CO2? It seems rather absurd to look for "normal" in time frames so ridiculously short as what are being used.
    0 0
  44. From Peru #39 There's lots of data in the nsidc.org website, like this for instance. I requires some work to dig out the information you need, though.
    0 0
  45. As we have had accurate measures of "Ice Extent" for less than 40 years it is a little premature to suggest that we know what "Normal" is. Ditto only more so for "Ice Volume".
    0 0
  46. Jeff Freymueller @ 37 'Simple physics says that everywhere there is open water and air at -20C or -25C will mean there is significant heat loss from the water and this will favor sea ice formation...' I'm relieved that my question wasn't totally naive :). The other variables such as wind and waves are obviously important. However, heat lost from water has to go somewhere - presumably into the troposphere and detectable as a rise in winter temperature. Thus, so long as winter temperatures within the Arctic do not transgress critical boundaries, ice will form regardless even if the overall temperature in the Arctic is recorded as increased. Hence, consideration of summer temperatures may be more relevant. The complicating factor as far as I can tell is precipitation, which is predominantly snow. This is very difficult to measure (see the Wikipedia article on ‘Climate of the Arctic’). Increased temperatures, as we know, lead to increased winter precipitation (snowfall), which would predispose to better preservation of winter ice in summer months due to increased albedo. Does anyone know whether there was increased Arctic precipitation over the last winter? It may be that arguments over ice cover in the Arctic may be a red herring in that increases or decreases may tell us little about world climate at least in the short term. From my very limited understanding, one could plausibly argue for warming even in the presence of increases in Arctic ice cover. The converse - global cooling despite decreased ice cover - may therefore also apply though clearly we have a significant raft of evidence from other sources that the world is not cooling. I suspect that the iconic status of the Arctic and Antarctic ice caps may distract us from less glamorous but more robust climate signals. However, the world at large gets excited by headlines - hence, the need to address the complexities.
    0 0
  47. Incredible that volume is the same now as during the 2007 summer.
    0 0
  48. chriscanaris at 13:52 PM, your last two paragraphs make valid points. Both ice caps make it difficult to determine when things are in balance simply because of basic logistics. Energy takes the long road in and the short road out. Anything that forces a change on one side of the ledger may not be balanced by an equal and opposite force on the other side, at least within the region. It may well not tell us much about the global climate because the balance desired is to be found elsewhere in a different form.
    0 0
  49. Any single short term (i.e. weather) event is, by itself, not that significant. It is significant only when summed up to a previous trend. For Arctic sea ice it's definitely downward and one or two years of presumed "recovery" are not going to change this. Personally, I'm not interested in any climate "icon" if considered outside the global changes, we always need to put things in the proper context. So I'm happy to leave these icons to the media. But I have to admit that climate changes are more evident in some variable or process than in others; the Arctic sea ice shrinking is one of these.
    0 0
  50. HumanityRules is correct that the 'Polar Ice Center' graph in the article shows modeled results... we don't have sufficient data to accurately calculate Arctic ice volume for the entire timeframe. Thus, what they have done is taken measurements in an attempt to determine a general relationship between ice extent, concentration and volume... which they then project with the model based on observed extent and concentration data. However, from 2003-2007 ICESat gathered data on Arctic sea ice which provided sufficient detail to compute volume... and those results match the model quite well; There are certainly uncertainties around the model values. Ice extent has been the de facto standard for decades simply because it was the only data available. For ice volume we've only got five years of reliable data (and even that has some uncertainties) which cuts off since ICESat broke down. The recently launched CryoSat II and forthcoming ICESat II should give us much more precise data for a longer period going forward. All that said, the claim that Arctic sea ice is recovering or has recovered based on just two years of extent data is plainly absurd. Both because it ignores basic statistics and because extent is only one of three variables needed to compute volume (the others being concentration and thickness)... which makes it a poor proxy for determining total ice amount.
    0 0

1  2  Next

You need to be logged in to post a comment. Login via the left margin or if you're new, register here.


The Consensus Project Website

THE ESCALATOR

(free to republish)


© Copyright 2025 John Cook
Home | Translations | About Us | Privacy | Contact Us