Climate Science Glossary

Term Lookup

Enter a term in the search box to find its definition.

Settings

Use the controls in the far right panel to increase or decrease the number of terms automatically displayed (or to completely turn that feature off).

Term Lookup

Settings


All IPCC definitions taken from Climate Change 2007: The Physical Science Basis. Working Group I Contribution to the Fourth Assessment Report of the Intergovernmental Panel on Climate Change, Annex I, Glossary, pp. 941-954. Cambridge University Press.

Home Arguments Software Resources Comments The Consensus Project Translations About Support

Twitter Facebook YouTube Mastodon MeWe

RSS Posts RSS Comments Email Subscribe


Climate's changed before
It's the sun
It's not bad
There is no consensus
It's cooling
Models are unreliable
Temp record is unreliable
Animals and plants can adapt
It hasn't warmed since 1998
Antarctica is gaining ice
View All Arguments...


Username
Password
New? Register here
Forgot your password?

Latest Posts

Archives

Impacts of a melting cryosphere – ice loss around the world

Posted on 9 June 2011 by Verity

This is a cross-post from the Carbon Brief.

With delicately balanced ecosystems, weather patterns and a lot of ice, the planet’s frozen areas (collectively known as the ‘cryosphere’) are some of the most sensitive to climate change. As the cryosphere warms, we can expect to see a range of knock-on effects. This briefing runs through what we know about how the cryosphere is reacting to climate change, and what the likely consequences of continued warming are.

The warming cryosphere

The cryosphere comprises of the Earth’s ice – notably the Arctic, the Antarctic, and the world’s glaciers.

Historical records suggest that Arctic sea ice began to decline around 1900, with a more accelerated ice loss since the 1950s. Since 1979, satellite records have confirmed an overall decline in summer sea ice coverage of around 13% per decade. Although fears that Arctic sea ice would reach a ‘tipping point’ and rapidly disappear currently seem to be unfounded, the mainstream view of scientists is that we will see ice-free summers in the Arctic ocean within the next few decades.

The major body of land ice in the Arctic - the Greenland ice sheet - has been found to be thickening inland. Nearer the coast, however, the ice sheet is thinning and shrinking, at an accelerating rate. Overall, the Greenland ice sheet has been found to be losing ice mass over the last twenty years, and this ice loss is becoming faster.

Antarctic ice consists of a land mass topped by an ice sheet and surrounded by sea ice. Antarctic sea ice extent is increasing at around 1% per decade, thought to be caused by shifting weather patterns reacting to changes in ozone, high in the atmosphere.

The 2007 IPCC report concluded that the Antarctic ice sheet was most likely losing ice overall – with the Antarctic Peninsula (in the west of the continent) warming and the eastern continental interior cooling slightly. The range of uncertainty in this assessment was large, with ice loss assessed as 24 gigatonnes per year, plus or minus 25 gigatonnes – i.e. somewhere between gaining 1 gigatonne and losing 49.

This considerable uncertainty is due in large part to the difficulty of obtaining measurements in such a harsh environment. However, recent research suggesting the whole of Western Antarctic is warming in winter and spring, while controversial in the media, has been supported by a subsequent borehole study.

Around the world, mountain glaciers are also losing ice mass. For example, a study of the Patagonian ice fields found that the rate of ice loss in the area has increased over the 20th century. Another group of scientists modelled around 120,000 glaciers around the world, concluding that they are likely to lose around a fifth of their ice volume over the next century.

The impacts of melting

The picture emerging from the scientific research is one of accelerated ice melting in every part of the cryosphere. Research has found that the environmental changes at both poles cannot result from natural climate change alone, and is directly attributable to man-made climate change.

This has knock-on effects. The cryosphere is an important part of our water cycle. Ice locks water out of the cycle for long periods of time – with large-scale melting, a vast amount of water can be released back into the water cycle in a relatively short amount of time.

Unsurprisingly, water from the current cryosphere melt is contributing to global sea level rise. As shown in the graph below, the observed increase in global sea level is currently at the upper limit of projections made by the IPCC in 1990.

Sea level rise over time is close to upper limits of IPCC projections

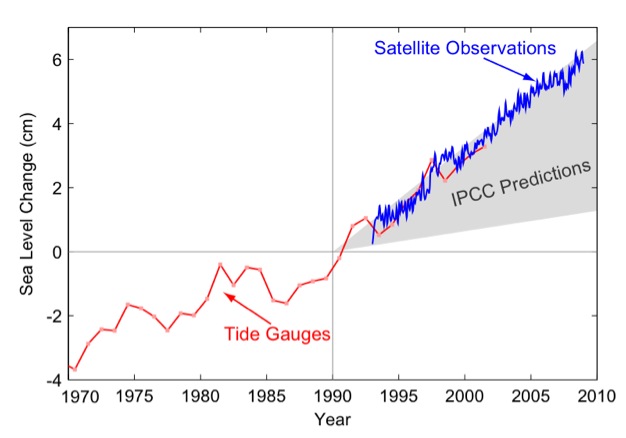
Credit: The Copenhagen Diagnosis Report

As ice loss from both the polar ice sheets and mountain glaciers accelerates, global sea level rise is also set to increase. One recent study suggests that the Greenland and Antarctic ice sheets are likely to be the dominant contributor to sea level rise in the 21st century, providing around half of all sea level rise over the next 40 years. Ice melt from glaciers is also likely to play an important role.

Given current melting rates, and taking thermal heat expansion of the oceans into account, total sea level rise is estimated to be around 32 cm by 2050.

Melting ice also has implications for water supply, with many millions of people around the globe dependent on rivers fed by mountain glaciers. For example, in the Indus and Brahmaputra basins alone around 60 million people rely on glacial meltwater for their water supply.

With glaciers melting faster, the IPCC has suggested that in the short term summer river flow is likely to increase - but further into the future river flow is likely to decrease as the ice feeding rivers disappears.

Other impacts

Permafrost – ground frozen for at least two years - ­contains large amounts of carbon, stored as frozen methane or organic material unable to decay in its frozen state.

Researchers from the National Snow and Ice Data Center (NSIDC) estimate that if permafrost melt continues, around 190 gigatonnes of carbon could be released into the atmosphere by 2200, further warming the planet. To put this figure in context, in the year 2010 manmade greenhouse gas emissions were at around 30 gigatonnes.

Scientists are also warning of a more immediate potential threat from melting permafrost, suggesting that methane released from seafloor permafrost in the Arctic Ocean could enhance ocean acidification in that region over the next century.

For more information about the melting cryosphere & sea level variability:

0 0

Printable Version  |  Link to this page

Comments

Comments 1 to 50:

  1. About this paragraph: Researchers from the National Snow and Ice Data Center (NSIDC) estimate that if permafrost melt continues, around 190 gigatonnes of carbon could be released into the atmosphere by 2200, further warming the planet. To put this figure in context, in the year 2010 manmade greenhouse gas emissions were at around 30 gigatonnes. Actually, it's worse. 2010 emissions of CO2 were 30.6 GT. To compare this to the NSIDC data, we have to convert it to carbon and get 8.5 GT. Those 190 GT mean some 22 years worth of human emissions, then.
    0 0
  2. #1: Is it not also even worse as the 190GT of carbon released from the permafrost will contain a significant proportion of methane, which is of course a more effective greenhouse gas than CO2 in our current atmospheric composition?
    0 0
  3. Thanks to Alexandre and Skywatcher for ruining my morning tea...jeez. Excellent points though.
    0 0
  4. Jay... To put that into a more current context... try this.
    0 0
  5. Jay... What is being projected by pretty much everyone is ice free summers in the coming 10-15 years. And that has all kinds of implications from habitat loss issues for a wide range of Arctic species, loss of summer ice albedo, warming Arctic ocean, methane release... it's extremely concerning and it's happening right now.
    0 0
  6. skywatcher at 00:32 AM on 10 June, 2011 You're right. So 190 GT of methane carbon would actually mean 4750 GT of the equivalent in CO2 (25x). Or 558 years worth of human emissions, considering a 100 year CH4 time span. Is this right? Feel free to correct me if anyone sees a mistake in my calculations. I remember David Archer claiming that no model showed a self-sustained warming from permafros emissions alone. So my figures here seem too high to be true...
    0 0
  7. Recommend adding a "links" tab to other relevant SkS postings on this topic.
    0 0
  8. Rob @5, Did you source those Arctic ice volume data from here? Also, for more context, we have this from Polyak et al. (2010): "Historical records indicate that Arctic sea-ice extent has been declining since the late 19th century. Although this decline was accompanied by multidecadal oscillations,the accelerated ice loss during the last several decades lead to conditions not documented in at least the last few thousand years. Taking together the magnitude, wide geographic distribution,and abruptness of this ice loss, it appears to be anomalous in comparison with climatic and hydrographic variability observed on sub millennial timescales and longer-term insolation changes." And if I may take the liberty of directing those in denial about the rapid loss of ice to the video featured here.
    0 0
  9. Clive and Dirk Cussler do not pull any punches about climate change's impact on the Arctic in their Dirk Pitt nove, "Arctic Drift" If the Climate Denial Spin Machine can tout novels, so can we. BTW: I really enjoed reading "Arctic Drift" Much of the novel is based on the ill-fated Frankin expedition. The fate of the crews of the HMS Erebus and the HMS Terror is retold in gruesome detail.
    0 0
  10. It’s interesting to note from the NSIDC that the area of ice dropped considerably between 1997 and 2007, since when the melt has levelled off with the ice remaining at a significantly reduced level. The last 4 years has seen this low level stabilisation which cannot be seen as a recovery, but how long would it be before this is seen as the norm? I strongly suspect the ice will once more resume it’s overall melt, but it would be great to see some opinions on why this low level stabilisation has occurred.
    0 0
  11. Badgersouth - Using the "Search" box with "Christy Crock #" will locate all of them.
    0 0
  12. garethman: "It’s interesting to note from the NSIDC that the area of ice dropped considerably between 1997 and 2007, since when the melt has levelled off with the ice remaining at a significantly reduced level. The last 4 years has seen this low level stabilisation which cannot be seen as a recovery, but how long would it be before this is seen as the norm?" It's almost as though garethman isn't aware that the three years following 2007 are *all* lower in minimum extent than any other year in the satellite record, and that two of the three were well below the long-term trend, and the third right on the trend, isn't it?
    0 0
  13. I'm perplexed why Arctic Sea Ice should have but two futures – either a tipping point & rapid disappearance of summer ice or a gradual decline into this state over 20 years. The former “seems to be unfounded” according to this post. Certainly the dramatic melt of 2007 proved not to be a tipping point being not followed by more drama in 2008. Yet the dramatic output of the PIOMAS model (see link @ #4) suggests ice free summers at least before 2020. My own humble efforts at extracting this PIOMAS data are graphed here & are just as dramatic. If this is anything near reality, an ice free summer Arctic surely has to be years away, not decades.
    0 0
  14. Not a good link @#13. It's URL is:- https://1449103768648545175-a-1802744773732722657-s-sites.googlegroups.com/site/marclimategraphs/collection/G14.jpg
    0 0
  15. garethman, the sharp drop in sea ice extent in 2007 was due to a confluence of rare weather events. The subsequent years have had more 'normal' weather yet still shown similarly low extents because of the ongoing decline in sea ice. Basically, at the time the 2007 extent was anomalously low (due to conducive weather) for the amount of ice in the Arctic ocean. However, since then the amount (i.e. volume) of ice has continued to decline and extents that low are now 'normal'. In another few years the same extent will be considered 'high'. Nothing particularly mysterious about it... just the normal progression of random variability around a declining trend.
    0 0
  16. "just the normal progression of random variability around a declining trend." Even with his cherry-picking, the 2007-2010 minimum has been showing variability *under* the trend, in contrast to the years (eyeballing) 1995-2006. His "leveling off" simply doesn't exist, and if anything we're seeing a slight acceleration in the declining trend, as argued by tamino here. His fit with two std deviations is given in this graph, with the red dot endpoint being his fit's prediction for 2011: Some "flattening" ...
    0 0
    Response:

    [DB] Nice.  In addition, how about L. Hamilton's research showing extent has declined in every month of the year:

    Monthly extent change

    And the southern sea ice edge of the Arctic Sea Ice has retreated northward in every month of the year:

    Latitude Change

    No flattening here.

  17. "In addition, how about L. Hamilton's research showing extent has declined in every month of the yea" Yes, the NSIDC trend graphs published in each monthly summary show this, too, though they're not gathered in one nice place like L Hamilton's graph.
    0 0
  18. Surprised the article doesn't touch on the impact on weather patterns...been some good stuff on how a warming Arctic is affecting mid-latitudes and storm tracks. Overland et al - my news article: http://stephenleahy.net/2010/09/13/arctic-melt-down-is-bringing-harder-winters-and-permanently-altering-weather-patterns/
    0 0
  19. Consider the wide swings of our climate caused by ENSO. This is caused by changing ocean temperatures over a portion of the Pacific by a couple degrees, and the effect of the changed temperature and moisture input into the atmosphere on global circulation patterns. Now consider that changing the Arctic from ice to water will probably have at least a profound impact on the temperature and moisture interactions between this area of the globe's surface and the atmosphere, and speculate on what this may do to atmospheric circulation patterns. We are already seeing small patches of ocean in the Arctic that are 5 degrees warmer than normal in late summer as they've spent a large portion of the summer absorbing solar radiation instead of sitting under a coating of ice.
    0 0
  20. For entertainment purposes only: Arctic ice decline stopped 5 years ago. Most of the Thick Ice Was Lost Between 1988 and 1996.
    0 0
    Response:

    [DB] Fixed link.

  21. In the top link @#20, half the agrument put is the 5% rise in the proportion of winter-maximum multi-year ice since 2009 as per the NSIDC graphic. What the NSIDC graphic fails to show is the decline in Ice Extent over the same period. Multi-Year ice in sq km has not risen much if at all. Yes, I do rather dislike those NSIDC multi-year ice graphics.
    0 0
  22. Dhgoza It's almost as though garethman isn't aware that the three years following 2007 are *all* lower in minimum extent than any other year in the satellite record, and that two of the three were well below the long-term trend, and the third right on the trend, isn't it? Aplogies Dhgoza, I was led astray by that well known denialist site Cryosphere today. Have a look at the sort of information they are brazenly publishing to lead all good men astray and lead to the sort of post which you have quite rightly criticised. We must accept that this chart is just propaganda and there is in fact no stabilisation of ice at a substantially lower level than average. http://arctic.atmos.uiuc.edu/cryosphere/IMAGES/seaice.anomaly.arctic.png
    0 0
  23. garethman:
    We must accept that this chart is just propaganda and there is in fact no stabilisation of ice at a substantially lower level than average.
    It's not consistent with your point as the september area minimums there are totally consistent with the NSIDC extent graph I showed above. You really need a graph like the Hamilton posted above by DB that shows month-to-month comparisons as it's almost impossible to do month-to-month comparisons on the cryosphere today graph you're showing. The fault isn't with cryosphere today, the fault is with your eyeballs, and possibly the fact that you're unaware that variability at maximum and during the early melt season is much smaller than the september minimum in the first place due to geographical constraints (in much of the arctic, freeze-up is right up to the continental shores and of course it's impossible for further sea water to freeze afterwards because continents are made of land, not water). There's a reason why researchers and amateurs alike focus on the september minimum, when geographical boundaries play a minimal role in the extent and area of sea ice. Nice try, though.
    0 0
  24. Of course, garethman, there's this informative and easier to read graph from cryosphere today, which shows their area data is totally consistent with the extent data from NSIDC: That's one hell of a flattening off we're seeing there, dude. Of course this doesn't show the linear regression but the summer (green) line in particular shows clearly that the area minimum for each of the last four years lies well below the linear trend, just as it does for NSIDC, and I'm certain that analysis done on this data would show an accelerating trend, just as it does for NSIDC extent data. Maybe not such a nice try, garethman, it was more lame than I first thought given the wide variety of data available at cryosphere today.
    0 0
  25. A new study out documenting the loss of snow pack in the northern Rockies by Pederson et al. (2011): "In western North America, snowpack has declined in recent decades, and further losses are projected through the 21st century. Here, we evaluate the uniqueness of recent declines using snowpack reconstructions from 66 tree-ring chronologies in key runoff-generating areas of the Colorado, Columbia, and Missouri River drainages. Over the past millennium, late-20th-century snowpack reductions are almost unprecedented in magnitude across the northern Rocky Mountains, and in their north-south synchrony across the cordillera. Both the snowpack declines and their synchrony result from unparalleled springtime warming due to positive reinforcement of the anthropogenic warming by decadal variability. The increasing role of warming on large-scale snowpack variability and trends foreshadows fundamental impacts on streamflow and water supplies across the western United States." More here.
    0 0
  26. Hi Dhogaza, I think your more detailed chart shows essentially the same thing? You are correct in that the loss of sea ice has remained constant, but logically, if it has stabilised at a lower level that goes without saying? Though as I have previously mentioned I strongly suspect the reduction will again start in the near future. I happy to be proved wrong by the way! I’m not sure what the “nice try" refers to? Rugby perhaps? Are we in a competition? I also personally don’t think these charts are “lame”, they are all useful. Some focus in some areas, some in others. But to get the overall picture it’s important to look at as many as possible and not ignore those you don’t like, which is why I appreciate seeing yours or any other useful indicators you may be so kind as to direct me to.
    0 0
  27. Albatross A new study out documenting the loss of snow pack in the northern Rockies......... Over the past millennium, late-20th-century snowpack reductions are almost unprecedented in magnitude across the northern Rocky Mountains, and in their north-south synchrony across the cordillera. Both the snowpack declines and their synchrony result from unparalleled springtime warming due to positive reinforcement of the anthropogenic warming by decadal variability. Garethman Thanks for that, looks interesting, unfortunately it is behind a paywall so I could not look at the article. If you have read it I would be interested in the tree rings. Were these aged in terms of Millennia in being used to compare with contemporary tree rings, in other words, were these trees a thousand years old? or were the current tree rings compared to snowfall data from other sources?
    0 0
    Response:

    [DB] Try here.

    Poking under rocks sometimes yields useful results.  ;)

  28. Garethman - obviously you don't understand post #16 and the inline addendum by DB.
    0 0
  29. #6 Your estimate may be too high, depending on both the proportion of methan e to CO2 in the carbon released, and also the shorter lifetime of methane in the atmosphere - ~12 years as opposed to hundreds of years for CO2. But I don't know the physics enough to be sure. The basic idea of extra greenhouse gases being released due to warming of the Arctic does not make happy reading however you slice it though.
    0 0
  30. Cheers DB, got it.
    0 0
  31. dhgaza. Garethman - obviously you don't understand post #16 and the inline addendum by DB Garethman Apparently the reference is with regard to your charts you posted, not mine. It’s an accurate observation it must be said. What is the comment on my chart, or should we set this to one side as being beyond the Pale? Do you think the chart I posted is inaccurate in some way? I still think your chart shows the same thing, it’s scale that is the difference. Great info though, please keep up the supply. Cheers G
    0 0
    Response:

    [DB] The point is, the focus (yours) on a short period of time in a noisy time series means...absolutely nothing.  Some Most would call that a cherry-pick.  The lack of any statistical analysis to support your "flattening" claim means you used the old Eyecrometer Mk 1.

    A professional time series analyst examining the issue would conclude that there is indeed a clear trend.  And it ain't flattening:

    NHSeaIce

    [Source]

    Tamino has many other great pieces in just the last year.  Relevant ones to this discussion include this, this, this, this, this and this.

    Apologies for the information overload, but you're touching upon one of the most-studied areas in all of climate science.

  32. Interesting how it ebbs and flows.
    Except, that, of course, human emissions of GHGs aren't going to ebb if you have your way. It's all "flow". At its most basic, you're arguing that since natural variation exists and has caused problems in the past, human contributions can't overwhelm natural variation, therefore there's nothing to worry about problems caused by anthropogenic GHGs. Which is a garbage argument ...
    0 0
  33. It’s all downhill, I agree. But sometimes it’s steeper, sometimes less so. We could draw a straight graph from one point to one point showing a consistent slope which excluded say summer melt and winter freeze, It would be correct, it would show a decline. But it would miss out variations in the rate of decrease which I believe are important in an understanding of why those variations occur. You are right in that we can gloss over the detail of 3 years worth of data in a background of 31 years, but is that not what reactionaries and dissidents do when they place the last 30 years of data against 3000 years? Does the chart I linked to show a flattening? Is it wrong? If so we must not trust info from that source. If it is correct, but shows a timescale to short to be of significance I fully accept that, but then it begs the question, what is a reasonable timescale for significant data to be accumulated? The last 30 years has shown a drastic reduction in ice cover. What does data over the last 300 years, 3000 or even 30,000 years suggest? It may be felt that anything outside the 30 year period is irrelevant due to the advent of satellite technology etc, but could that also not be seen to be Cherry picking? If 3 years is irrelevant, saying 30 is OK, but not 300 is odd. Note I am not saying the ice has not melted, it obviously has, I am just suggesting that from the data it looks like there is variation in the melting rate, which appears to have slowed over the last 3 years, but not recovered. I’m sure you have a reasonable answer for non experts like myself. Here is the link again to save time searching. http://arctic.atmos.uiuc.edu/cryosphere/IMAGES/seaice.anomaly.arctic.png
    0 0
  34. The chart you linked to is pretty noisy - because it's a lot of readings over that period. For something to clearly show a trend try the daily graph at NSIDC. Most importantly, it shows the 2 sigma range as well as the simple trend line. When you look at this one, you see clearly that any apparent 'flattening' is much less important than the fact that the ice extent can't get itself anywhere near the outermost limit of the steeply declining trend.
    0 0
    Moderator Response: [Dikran Marsupial] linked in pitcure (click to go to source)
  35. garethman It is not correct to define a trend by drawing a line between two points, it would be a recipe for cherry picking. That is why climatologists use least squares trends. It is a logical fallacy to think that looking at a thirty year trend rather than a 3000 year trend means that looking at a three year trend rather than a thirty year trend is justifiable. Over short timespans, the data are dominated by chaotic variability, and thus tell you virtually nothing about climate. There is very little information about the effects of forcing in three years of data compared to a thirty year trend. Over timescales of 30+years, you are looking mostly at forced climate change, and that is true for 30 years ot 3000 years. Of course if you look at 3000 years the trend won't be sensitive to anthropogenic forcing as it has only been significant for the last 150 years or so of that 3000 years, so it has little effect on a least-squares trend. I can see why a denialist would want to concentrate on a 3000 year trend rather than a 30 year one.
    0 0
  36. Thanks Dikran, that’s useful.I suppose reactionaries and the AGW community will always tend to focus on data that supports their side of the argument. So reactionaries or skeptics would tend to use the following: http://www.iup.uni-bremen.de:8084/amsr/ice_ext_n.png which show exactly the same thing, but against a different background giving a different feel. Again, it’s the subjective interpretation of objective observations. However, it just so happens that the vast majority of data supports the AGW side of things. Interestingly this data regarding ocean heat shows this similar blip in the relevant timescale. http://www.nodc.noaa.gov/OC5/3M_HEAT_CONTENT/heat_content55-07.png . I guess we could ignore the data as being far too short to be of any real significance, but both sets of data show something standing out against the general trend and any ideas as to why it is occurring would be great.
    0 0
  37. garethman O.K., so you aren't here for rational discussion of the science, just rhetoric (as your first sentence clearly demonstrates). I have explained why a 30 year timescale is relevant (any shorter it is dominated by weather noise and tells you nothing about forcings, much longer and it no longer has sufficient resolution to detect the effects of anthropogenic changes in forcing) and all you can manage is an inflamatory attack accusing those with a mainstream scientific view of scientific dishonesty (concentrating on only those datasets that suit their position). Not very persuiasive I'm afraid. Look further back in the data, you will find that after each record high or low, there will be a "recovery" towards more average conditions over the next year or two. This is called "regression to the mean", and is a well known statistical phenomenon. It doesn't mean anything now, just like it didn't signal a signficant recovery following any of the previous record minima.
    0 0
  38. Clearly you're not here for rational discussion garethman, but by all means use ther Uni of Bremen chart - though it only shows the past eight years of data, it shows 2011 at the 'bottom of the pack' as it were, and also shows (which IJIS does not) the long-term mean, and how far below that, every single year in the Bremen graphs. It's not a graph for establishing trends, however, as it is not easy to see the pattern of how the extent on this year on this date compares to the ordered sequence of extents on previous years of the same date. But that is of course exactly the data you want to hide. Equally, the Cryosphere Today anomaly graph technically shows pretty much exactly the same data as in Tamino's graphs, the NSIDC graph or the IJIS/Bremen graphs, but in that one it is even harder to see the trends as you cannot visually pick, say which point represents 11th June 2010, 2009, 2008, 2007, and so on. If you could, you would of course see very clearly the declining trend. What is interesting is that although the rapid and accelerating decline is clearly going on, as shown by the relevant charts from NSIDC or Tamino's linked above (or you can generate them yourself from IJIS data), the CT chart shows the emergence of something like an annual cycle in the anomalies, as the September anomalies decline more rapidly than the March anomalies. But there's nothing much subjective about any of these graphs, you just need to understand clearly what it is you are looking at on the graph, and do the relevant analysis. If you have any proper data that gives us sound cause for hope in the Arctic, which the extent charts cerainly do not, I would like to see it. I'd like to see some good news about the Arctic.
    0 0
  39. Thanks for the extra info Dikran it makes sense of what I am looking at, If I understand you correctly, the highs and lows even out into a trend, and this temporary slowing of decrease will be evened out by an increase at some point? Thats useful to know. However, that was not my question, my question was related to why it happened, what were the factors involved which caused the variations. Helpfully it has now been answered on another thread. Apparently it is variations in sea temps and wind direction. Warmers waters accelerate melt, winds break up and distribute ice, and these factors either enhance the rate of melting or slow it down. I know it may be pretty obvious to most of you, but it took a lot of queries to arrive at the info. By the way it’s a fair cop, I love rhetoric. It has great tradition dating from classical Greece. It’s a good way of arriving at information, especially when any question is met with a barrage of aggression or odd allegations. To me, coming from a qualitative or even phenomenological background, what I post is a scientific discussion. It just does not seem like that to many Scientists on this site who are schooled in the more quantitative philosophy of objectively measurable phenomenon. Sometimes your deductions are as perplexing to me as mine must be to yourselves. Nevertheless I appreciate your responses which wonderfully illustrate the variation in human responses to such critic issues and hope that maybe you are learning something about human nature in the same way as I am learning the details of anthropogenic effects on climate.
    0 0
  40. garethman It is rather arrogant of you to assume that I am in some way lacking in my understanding of human nature (a rhetorical trick I have seen before, a subtle ad-hominem). One of the purposes of scientific method and practice is to overcome some of the less helpful aspects of human nature, in doing so, it is helpful to have a good knowledge of those human failings actually are. Rhetoric on the other hand tends to appeal to them (especially our natural confirmation bias). I would avoid rhetoric if I were you, if you want to engage in scientific discussion; science looks for the truth, rhetoric looks for a victory in a debate, and truth or logical consistency are generally only secondary considerations (if that). I doesn't work as well in written communication as there is time to check for cherry picking and logical consistency etc. There was a good essay by Schopenhauer lampooning rhetoric ("the art of always being right" or something like that), well worth reading so you know the tricks to look out for in others and avoid using yourself. Rhetoric is a hallmark of denialism, it really isn't something to be proud of. If you think it is a good way of arriving at information, you are profoundly mistaken.
    0 0
  41. garethman I am not interested in a rhetorical debate with you. I have clearly stated why. If you want your posts to be better received, just drop the rhetoric as I advised, you will find you get your questions answered in a measured tone. I suspect the last few posts will be deleted as off-topic (I would do so myself were I not a participant), but hopefully you will get the message that your rhetorical tone is doing you no favours here. Note that my first response to one of your questions was perfectly reasonable. Note I said a denier would want to look only at a 3000 year trend, not a skeptic (there is a difference). A denier would want to use data that could not possibly reveal any anthropogenic influence on climate, whether it was there or not. That was not implying that you were a denier, just pointing out how useless a 3000 year trend would be for the discussion at hand (albeit obliquely).
    0 0
  42. Hi Skywatcher. Sadly I cannot give you any cause for hope, like you, I would like to see some good news. You will also note all my posts state I fully agree with the fact the ice is declining rapidly. My apparent sin was to ask why the ice declined at varying rates, and to show charts which demonstrated a temporary slowdown in melting rates. Obviously a very sensitive area which I was unaware of and which has upset many people. I’m still unsure why, but in my behavioural science you don’t ask why people behave in some ways, you just have to accept. So there we are, I will try and carefully avoid posting any material which is likely to offend or cause upset in the future.
    0 0
    Response:

    [DB] This is a forum wherein like-minded people discuss the science of climate change from the perspective of what the science actually says, not what the media represents it as.  Participants took exception to some unscientific statements you made and attempted to make you aware of a more appropriate context and methodology to examine those situations.

  43. garethman, and everyone, You said this, and things like it a number of times in the past:
    ...in my behavioural science you...
    I see this sort of thing a lot. Electrical engineers analyze climate using electrical engineering concepts and terms. Statisticians make everything revolve around statistics. Chemists look at the chemistry. I certainly flavor my own thoughts with systems thinking (being a software developer and systems analyst), but I think I have a slight advantage because the real key to success in my job is breaking that mold, and getting in tune with the real world and the real problem, from many angles, not just my own, narrow, computer-specialist perspective. In fact, a lot of computer systems fail because of this habit of people to look only from their own perspective, and so computer systems too often reflect the computer considerations, and not the realities of the problems they are trying to solve. Hammer/nail syndrome ("if all you have is a hammer, every problem is a nail") is human nature. But I think climate is a particularly broad, varied, and complex problem. It includes systems, and feedback loops, and behavioral components, and statistics, and chemistry, physics, biology, politics, economics, everything. Everyone needs to make every effort they can to break the hammer-nail syndrome and expand their thinking in uncomfortable but necessary ways. If you ever find yourself falling into your comfort zone, realize that you are falling away from the answers and solutions, not closer to them. You feel more comfortable with your understanding, because it is familiar and fits into a complex box that you have spent a lifetime and a career constructing, but in fact that box is a prison, not a prism. It keeps you from seeing the whole picture and the truth, rather than helping you to do so (which is how it feels, but not how it is). This isn't a criticism of garethman, or anyone. It's just an observation. Avoid hammer-nail syndrome. The climate problem is far too complex to be handled by a single specialist, or even a team of specialists. To repeat a favorite quote of mine from Robert Heinlein:
    "A human being should be able to change a diaper, plan an invasion, butcher a hog, conn a ship, design a building, write a sonnet, balance accounts, build a wall, set a bone, comfort the dying, take orders, give orders, cooperate, act alone, solve equations, analyze a new problem, pitch manure, program a computer, cook a tasty meal, fight efficiently, die gallantly. Specialization is for insects."
    0 0
  44. Sphaerica There is a difference between garethmans brand of behavioural science and the way an electrical engineer or a chemist or a statistican would approach climate change, which is that the latter are constrained by the truth. Rhetoric isn't. There is plenty of scope for discussion of behavioural science in climate change (although perhaps not on this thread). There is no place for rhetoric in the scientific discussion of climate change. As a statistician/electronic engineer, I find the physics far more convincing, but my comments tend to be about statistics as that is my primary expertise. I generally read the discussions about physics and chemistry rather than participate. I suspect I am not alone in this, so on-line appearances can be deceptive. I have also pitched manure and written a sonnet ;o)
    0 0
  45. 44, Dikran, Yes, I probably should have added that I believe that my observation almost always applies to skeptics (not meaning all skeptics, but rather, it rarely applies to people who do already understand the science, and far more often applies to skeptics, especially vocal skeptics who are so confident in their position that they feel they can openly and confidently recant a scientific position). Skeptics are the ones who tend to try to mold climate science to fit into their own boxes, and this is often what leads them astray. Because they are only seeing things from a very limited (and inaccurate) perspective, but it is also a perspective that they have spent years fine tuning, and through which have achieved a lifetime of personal success and achievement, it is very easy for a skeptic to Dunning-Kruger himself, and to believe that of all people, he has the tools to unravel the great climate mystery, and if not to find the solutions that have eluded the professionals, to at least understand it as well as he needs to make a final, authoritative (Dunning-Kruger) judgment. So, while my observation and advice was and is directed at everyone, it's particularly applicable to those who have already made up their minds that climate change is not an issue, and that look at every single aspect of climate change -- be it melting ice, drought, temperature records, climate sensitivity, the physics whatever -- but in every aspect, they feel they have achieved understanding but always through their own best avenues, tools, and limited perspective -- with their own, best hammer-- and so have convinced themselves that their position is valid. I think for many of these people, the simple recognition that they are one of the blind men describing an elephant is the starting point to getting out of the box which they have constructed that defines their skepticism, and prevents them from learning the science and finding the truth.
    0 0
  46. While soome of this discussion is indeed interesting, there has been a subtle shift in this thread away from the focus on ice loss. In particular, garethman's successful avoidance of accepting that there is a very clear downward trend, which has not in the least bit slowed in recent years. Dikran's point in #37 about the variability around the trend is worth noting again. It's also disingenuous for garethman to get a helpful answer on another thread pointing to additional factors affecting ice loss, and then post here pretending that wind and ocean temperatures are the only story. They are not, and if he has read the two threads in question, he would know this. Wind in particular causes much of the variability about the accelerating downward trend, with poor wind conditions in 2007, and favourable winds for ice retention in 2010 (still the 3rd lowest on record). But we can't blithely blame interannual variations for a downward trend in extent and thickness that is over 30 years old and accelerating.
    0 0
  47. 46, skywatcher,
    But we can't blithely blame interannual variations for a downward trend in extent and thickness that is over 30 years old and accelerating.
    Sure we can. But not forever, and not even for long. I really think the denial crew stuck their heads on the chopping block with this one... like Goddard last year. The Arctic truly is the canary in the coal mine, in that no one is going to be able to hold the pretty little bird up, in the end, and say, "No, it's alive, see? See that? Its chest moved. It's still breathing! Trust me! He's fine..." The inter-annual variability just isn't as great as with the temperature records, the arguments about observation correctness don't really exist, and the trend is undeniable. Really, there's little the deniers can do except say "Look, it went back up (this year)" or "Well, but it's because of wind, it's not really melting". They will even some day say "Look, the trend is totally flat" (because it's all gone, and there's no more ice left to melt). But I love the Arctic, because the Arctic is and will be undeniable. It is, I think, the barometer that will ultimately turn public opinion before anything else. Then they'll look at the glaciers, and the droughts, and the extreme weather events, and the ecosystem changes... and people will finally start to seriously listen, or rather, they'll finally start to look askance at the "don't worry, it's nothing" crowd. So they can make bizarre predictions and dismiss it as much as they like. In fact, I encourage them to, because it will make it look that much more comical, and also demonstrate that they are that much less trustworthy, when the canary is clearly lying at the bottom of its cage, with its feet sticking straight up in the air, and they are still trying to claim that they can see it breathing.
    0 0
  48. Indeed, Sphaerica, and to drag out the avian analogy further, the Goddards and Watts' of this world will then be just like the pet-shop owner in the classic Monty Python 'Dead Parrot' sketch.
    0 0
  49. Any rational for truncating the tide comparison with the satellite info? Seems it would help noting how well the two compared, beyond a mere 10 years.
    0 0
  50. Sphaerica, I will agree with you on this one. The changes in the Arctic are both more rapid and greater than changes elseware. This will make for an excellent barometer.
    0 0

You need to be logged in to post a comment. Login via the left margin or if you're new, register here.


The Consensus Project Website

THE ESCALATOR

(free to republish)


© Copyright 2024 John Cook
Home | Translations | About Us | Privacy | Contact Us