Just Science app shows climate change is happening in pictures anyone can understand
Posted on 11 January 2012 by norenstein
Guest post by Nick Orenstein
We find ourselves at a time where advances in scientific discovery and information gathering have accelerated faster than the general public’s understanding of issues equally vital to everyone on Earth. As a result, many non-scientists among us are: confused by too much math, politically biased by convenient half-truths, or somehow religiously opposed to the consequences of the scientific data.
The topic of “climate change” carries with it a slew of cultural connotations that often overshadow the fact-based science when the subject is discussed outside the laboratory and in the public commons. The world is torn, figuratively and literally. Someone needs to step in as the bridge between Science with a capital S, the General Public, and the Body Politic.
Last year, as a team of world-class scientists conducted the Berkeley Earth Surface Temperature study to independently analyze global land temperature data, I set out to build that bridge–or at least one of its lanes. Taking its slogan and running with it, Novim (the nonprofit group that sponsored the BEST study) began work on the “Just Science” mobile app to visualize the results of the study. Here was a chance, at last, to use modern technology in the pockets of millions to share the science–most importantly, to share the results as broadly and as visually as possible.

To quote Einstein, “Everything should be made as simple as possible, but not simpler.” A successful app, in other words, must enable anyone, regardless of scientific training, to grasp what climate change really looks like. It should be as pretty as it is scientifically accurate, as easy-to-use as it is complex in underlying information.
On the one hand, the public status quo of elusive climate change information at best and misinformation at worst could remain. On the other hand, Just Science and other educational apps like it could successfully get us to a point where everyone finally agrees that yes, something is happening. We can spend the next decade arguing about why climate change is happening, what to do about it, when the trends will spell disaster. But it’s right time to arrive at a state where the science is respected and agreed upon because everyone has seen, and grasps the data.
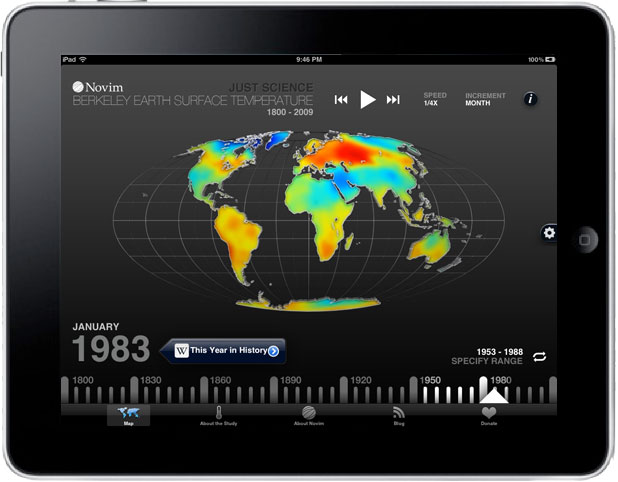
Just Science features an interactive picture of the world which displays how the Earth’s land temperature changed between 1800 and 2009, compared to local averages between 1950 and 1980. Users are provided a color-coded video map, and they can explore details by zooming into geographic regions, changing playback speeds to search for trends, and visiting Wikipedia to reference concurrent world history.
To ride in our lane of the bridge, I suggest watching this promo video:
and then downloading the Just Science app from iTunes.
Educational mobile applications are the shiny new tool to enable discovery by the masses. When a user curls up with his iPad on the couch or pulls out her iPhone at a coffee shop, their attention is focused and their mind is open for information input. Do it right, and the result is a “eureka” moment of lasting understanding that no politician, pundit, or preacher could refute.
Enlightening experiences like this have happened in front of me continuously since I began developing Just Science, and more so since its release last month. The young barista at my go-to coffee shop in the Mission district of San Francisco got it. The old Republican Texan Judge from Wichita Falls at a fancy Dallas wedding got it. The lawyers at a birthday party got it. The exoplanet scientists at NASA’s recent Kepler mission conference got it. The middle school teacher got it. The Army Cadet got it. The outdoorsy father and daughter at the Ice Bar on the side of Mt. Crested Butte got it. The university professor referencing it in his NSF grant got it.
Everyone can get it, and should get it. It’s just science, y’all, and if taught properly it ain’t that hard to understand the fundamentals. The pictures speak for themselves.
Please download the app and share its message widely. Design your own apps, borrowing lessons you learned from your favorite teachers. Teach others around you. Help make it easier to understand the compelling science around us everywhere, everyday.
By building a stronger bridge between science and the Public, we can succeed in accomplishing the greatest goal I’ve ever known – first introduced to me by my 8th grade math teacher Dr. Keyton in his geometry course. One day, Dr. Keyton drew two circles in chalk on the blackboard. One was very large, the other about medium sized and fully contained within the larger one. “The larger circle,” he told us, “represents All Knowledge. The smaller circle represents Human Knowledge.” He remarked on the fact that they were not yet equal and challenged us as I challenge now you:
What does it take to grow the inner circle, and what are you doing to help the cause?


 Arguments


 0
0  0
0


Comments