Climate Science Glossary

Term Lookup

Enter a term in the search box to find its definition.

Settings

Use the controls in the far right panel to increase or decrease the number of terms automatically displayed (or to completely turn that feature off).

Term Lookup

Settings


All IPCC definitions taken from Climate Change 2007: The Physical Science Basis. Working Group I Contribution to the Fourth Assessment Report of the Intergovernmental Panel on Climate Change, Annex I, Glossary, pp. 941-954. Cambridge University Press.

Home Arguments Software Resources Comments The Consensus Project Translations About Support

Twitter Facebook YouTube Mastodon MeWe

RSS Posts RSS Comments Email Subscribe


Climate's changed before
It's the sun
It's not bad
There is no consensus
It's cooling
Models are unreliable
Temp record is unreliable
Animals and plants can adapt
It hasn't warmed since 1998
Antarctica is gaining ice
View All Arguments...


Username
Password
New? Register here
Forgot your password?

Latest Posts

Archives

Dead Ahead: Less Rainfall for Drought-Sensitive Southern Hemisphere Regions?

Posted on 27 May 2012 by John Hartz

This is a reprint of a news release posted by the National Science Foundation (NSF) on May 18, 2012.

Increasing aridity could lead to major problems for societies and ecosystems in already-arid places
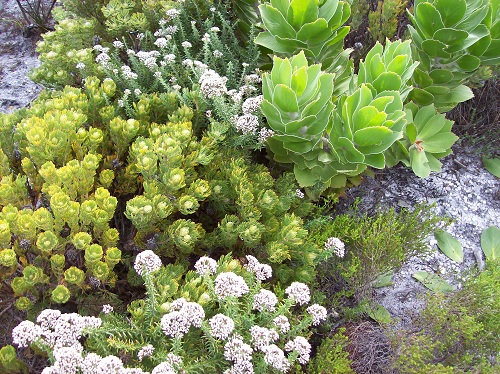
 Photo of South African plants

Hundreds of species of unique South African plants may be affected by increasing drought.

Credit: Kary Johnson


Warming climate may mean less rainfall for drought-sensitive regions of the Southern Hemisphere, according to results just published by an international research team.

Geoscientist Curt Stager of Paul Smith's College in Paul Smiths, N.Y., and colleagues found that rainfall in South Africa during the last 1,400 years was affected by temperature--with more rain falling during cool periods and less during warm ones.

The findings, published in the journal Climate of the Past, are supported by the National Science Foundation (NSF).

"The link between climate change and rainfall in certain latitudes can have large effects on ecosystems," said Paul Filmer, program officer in NSF's Directorate for Geosciences.

"Plants, for example, may be able to grow in a wider area, or conversely, be squeezed up a mountain or onto a peninsula. When the affected ecosystem supports a food crop, that can mean a bonanza--or a famine."

Theoretical climate models have shown that global warming could push storm tracks southward "and away from the mainlands of southern Africa, South America and Australia," said Stager.

"This research supports those predictions of increasing aridity, which could lead to major problems for societies and ecosystems in these already-arid places."

A poleward shift in winds could also affect the flow of marine currents around the tip of Africa, changing air and water temperatures farther afield, including in the Atlantic and Indian Oceans.

Stager, lead author of the paper, collected sediment samples from Lake Verlorenvlei in South Africa. By analyzing the diatoms--tiny, glassy-shelled algae--preserved in sediment cores from the bottom of the lake, he and other researchers were able to reconstruct rainfall patterns dating back to 600 A.D.

Two Paul Smith's College undergraduate students, Christiaan King and Jay White, also participated in the study, along with scientists from the University of Maine and from institutions in South Africa and Europe.

Rainfall at the southernmost tip of Africa is governed by a sinuous belt of eastward winds that migrate like a meandering river, depending on the season.

In summer months, these winds drift closer to Antarctica, carrying rain clouds over the ocean; in winter, the winds move over the African continent.

The shifting winds bring rains that provide much of the annual water supply.

"A poleward retreat of these winds would have serious consequences for cities like Cape Town, for farms and wineries, and for local animal and plant communities," Stager said.

"The same also appears to be true for the semi-arid winter rainfall regions of South America and Australia-New Zealand."

Michael Meadows, a scientist at the University of Cape Town who co-authored the paper, said that hundreds of species of rare flowering plants native to the area's fynbos ecosystem are threatened by the changes.

"These plants are tough, and are already used to dry conditions," Meadows said. "But more aridity could make fires more frequent, which could damage the soils and make it even harder for the plants to survive.

"Unfortunately, this is their only native habitat, so such a change might threaten their existence."

According to Stager, such links to mobile storm tracks make these regions exceptionally vulnerable to the effects of greenhouse gas build-up.

"When it comes to climate change, there's more to consider than warming alone," he said. "In places like these, increasing drought could bring far-reaching challenges."

Related Websites
Ancient Catastrophic Drought Leads to Question: How Severe Can Climate Change Become?: http://www.nsf.gov/news/news_summ.jsp?cntn_id=118718
Link Between Sunspots, Rain Helps Predict Disease in East Africa: http://www.nsf.gov/news/news_summ.jsp?cntn_id=109789

0 0

Printable Version  |  Link to this page

Comments

Comments 1 to 37:

  1. OTOH, the expansion of Hadley cells as the evaporation in the tropical oceans increases could make the rainy season of tropics occur more widely and for a longer period. But as this expansion would occur on locations that are currently deserts there would be no more soils for irrigation. Speedy check on the map would indicate that movement of 1200km (~width of the subtropical desert belt) would be required to continue farming on these locations. In the Northern Hemisphere things could change quicker as the polar cell will be destroyed by the abolition of Arctic ice at least in summer. And is the Hadley circulation constrained by the tilt of the Earth, so it cannot expand so much? Some sort of simple model might be enough to answer this question, as these are large-scale structures of the atmosphere that are shifting locations.
    0 0
  2. A minor nitpick but it is Verlorenvlei (often also spelt Verlorevlei) not Lake Verlorenvlei. Vlei is an Afrikaans word derived from the Dutch vallei (valley) with a meaning that has shifted to mean a marsh, lake or other wetland, and is widely used in (South African) English. I'm not sure about lack of soils for irrigation - I believed that many arid and semi-arid lands provided good crops if provided with artificial irrigation.
    0 0
  3. bath_ed @2, I am no expert, but my understanding is that semi-arid regions still retain soil, ie, fine grained dirt including some humus, which can be the basis of agriculture with more water. Even then, many semi-arid soils are poor quality, and will quickly become exhausted with ordinary agricultural practices. In contrast, in truly arid areas, the dirt often consists of coarse sands, or is salty, or covered in rocks; and will require substantial preparation to be suitable for agriculture. Consequently, I would expect expansion of the Intertropical Convergence Zone into the Sahel would give an immediate boost to agriculture, but expansion into the Sahara would not.
    0 0
  4. The article says: Theoretical climate models have shown that global warming could push storm tracks southward "and away from the mainlands of ...Australia," said Stager. "The same also appears to be true for the semi-arid winter rainfall regions of ...Australia ... "When it comes to climate change, there's more to consider than warming alone," he said. "In places like these, increasing drought could bring far-reaching challenges." After a very short Google search I found this page and the data. And a few minutes to plot it out I get: http://www.bom.gov.au/climate/change/rain03.txt Why should I believe that "Global Warming" is going to lead to Australian drought when the last 100 years of rising temperatures appears to have done the opposite? In fact, the trend shows a little acceleration.
    0 0
    Moderator Response: [DB] Fixed formatting issues.
  5. I don't know why my links don't work, here's the one for the data: http://www.bom.gov.au/climate/change/rain03.txt and the web page: http://www.bom.gov.au/climate/change/rain.shtml
    0 0
  6. Steve see here for how to do hyperlinks. As to rainfall total map of Australia, you will note the prediction is for the north to get a lot wetter. I dont think this is inconsistent. In a warming world, you should get more rainfall, but this is expected to be much heavier in many existing wet regions while many dry regions get drier.
    0 0
  7. Steve Case @4, coming as I do from Australia, and in particular from Queensland where most rain falls during the summer months, I cannot help noticing that not all of Australia is "the semi-arid winter rainfall regions of ...Australia", and have to wonder why you plotted rainfall for the whole of Australia rather than just for the relevant region. The relevant region is, of course, Southern Australia, particularly South Western Australia, which is not influenced by the complicating factor of ENSO: As noted, in South Eastern Australia, the picture is complicated by ENSO oscillations. In particular, heaving flooding over the last two summer/spring seasons in Victoria related to the most recent La Nina have resulted in a slight positive trend, although there is still a clear decline over the last 30 years: However, the declining trend is clear in Winter: and Autumn: Of course, South Eastern Australia is not semi-arid, so technically does not come under the prediction in the paper. Given that monsoons are predicted to increase in strength with increased warming, and that averaging across monsoonal,and winter rainfall regions precipitation is predicted to increase; I again have to wonder why you are quoting an area which includes monsoonal rainfall as a counter example to a claim about semi-arid areas with predominantly winter rainfall. All images from the Bureau of Meteorology, where you can play around with the graphing tool to get a more detailed picture.
    0 0
  8. Steve, I would also note that you know about prediction of wet getting wetter and dry getting drier, because you were informed about it here. Did this slip your mind when you decided to show rainfall for all of Australia?
    0 0
  9. Scaddenp #8 Yes, I know what the catechism is, I just don't believe it.
    0 0
    Moderator Response: [Sph] Please review the comments policy. Subtle efforts to violate it are still efforts to violate it.
  10. Steve Case @9, let me remind you that the hypothesis you were testing was:
    'Theoretical climate models have shown that global warming could push storm tracks southward "and away from the mainlands of southern Africa, South America and Australia"'.
    Regardless of whether you believe it or not, there was no justification for using data which is dominated by northern, monsoonal rainfalls when testing a hypothesis about a shift of the prevailing westerlies further south.
    0 0
  11. "I know what the catechism is, I just don't believe it" Then you had better try harder in presenting us with some credible evidence why you don't (aside from ideology), rather presenting in effect disinformation.
    0 0
  12. 9, Steve Case, Your argument has been proven to be invalid. Regardless of what you believe or want to believe, the facts in this case seem clear.
    0 0
  13. Steve Case @ 4: The clue is semi-arid winter rainfall regions that the article speaks of. In South Africa (and Australia too I believe) there is a strong distinction between the winter rainfall regions of the far west and south west and the rest of the country which receives most of its rain in the summer. It is also important to note that the winter rainfall zones are small compared with the summer rainfall zones, so any rainfall trend for the whole country is going to be dominated by the summer rainfall regions; rainfall in the Western Cape has declined in recent decades. In the winter rainfall regions, rain is brought by the westerlies and cold fronts rather like in the Atlantic edge of Western Europe. Unlike Atlantic Europe, the southern tip of Africa is at a sufficiently low latitude that it only gets the westerlies in the winter and in the summer they retreat further south, while Atlantic Europe being nearer the pole stays in their path all year. Rainfall in the rest of South Africa (and Australia) has little to do with Atlantic (Indian Ocean) westerlies and falls mainly in the summer, which makes an enormous difference to the vegetation, agriculture and appearance of the country. You will find that in January the region surrounding Cape Town will typically be parched and brown while Johannesburg, Pretoria etc are green. By July the situation is reversed. Going back to the plants of the area, I believe sadly that they may be especially vulnerable to any changes. This winter-rainfall zone supports the Cape Floristic Kingdom, by far the smallest of the world's six floristic kingdoms. Covering only 0.5% of Africa it contains 20% of the continent's plant species and more than all of North America. As well as occupying such a small area, many of the plants had the misfortune of growing on land suitable for growing wheat and other crops, or land now taken for urban development. Some now grow only at a single site or a handful of sites, or even only in cultivation. Given this, it would be difficult for them to shift ranges in response to drying.
    0 0
  14. The 'wet get wetter, dry get dryer' means that if you look at too large an area, you're averaging together drought and flooding: Trends in annual total rainfall for three time periods, 1900-2005, 1950-2005 and 1970-2005 -- source (2006) It is clearly incorrect to look only at continent-wide averages.
    0 0
  15. #14 muoncounter, The graphs you picked to illustrate your point all end at 2005, over six years ago. And they show East Australia getting drier. So I thought I'd take a look at East AU and see if I could find up-to-date data and I found this page. So I graphed out the precipitation for East Australia for 1900-2011, 1950-2011,
    1970-2011 and 1970-2005 and it looks like this: East AU Rainfall Looks like precipitation is up overall in East Australia since 1900, but because of some spikes mid-century trends with start points at those times show a decline and if 2005 is picked as an end point, the decline becomes quite exaggerated.
    0 0
  16. Steve Case @ 15: This article is about declining rainfall due to weakening/poleward retreat of the westerlies affecting the winter rainfall region of South Africa and by analogy Australia. The winter rainfall regions of Australia, like South Africa are in the far south on west facing coasts. You can see them and their relative small size here shown in blue and blue-grey: Eastern Australia is a red herring as it doesn't get its rainfall from the westerlies and therefore is of little relevance to the issue. Here are the winter rainfall zones of southern Africa, (top left) with estimated distributions in past glacial periods. Note how they were more extensive when the Earth was cooler:-
    0 0
    Moderator Response: [Sph] Image widths adjusted. Please remember to keep images to 450 pixels wide or less.
  17. Once again, we see amply demonstrated the factual impoverishment of denial's meritless arguments. Devoid of supportive basis, denial relies upon strawman arguments, goalpost shifting and the ol' reliable misdirection ploy to advance their agenda.
    0 0
  18. bath ed, Do you have similar maps that show where wheat is grown in Australia?
    0 0
    Moderator Response: TC: Wheat is grown in Australia in both winter rainfall, and summer rainfall regions, with different times of planting. Consequently I cannot see how your request can be on topic. If you have a specific on topic point to make, then make it. Otherwise discussion of wheat growing in Australia is off topic on this thread.
  19. Daniel Bailey #17, What I amply demonstrated with all of the data 1900-2011 not merely 1970-2005 is that rainfall in East Australia has trended upwards contrary to Muonconter's post. I object to your assertions without supportive basis.
    0 0
  20. Steve: muoncounter's comment was not about Eastern Australia in and of itself, and neither is the OP. Rather, muoncounter's comment was criticizing exactly the sort of thing your comment on Eastern Australia rainfall appears to be doing: obscuring a small-scale phenomenon (the projected drying up of specific regions whose primary source of rain comes from the westerlies) by pointing at other, unrelated information (large-scale rainfall anomalies in other countries/regions). The OP was not claiming that Australia, as a whole, was going to suffer drought as a result of warming. As such your interpretation of the OP smells of straw.
    0 0
  21. A potentially relevant study attempting to determine cause of declining rainfall in SW Australia is here: http://journals.ametsoc.org/doi/pdf/10.1175/JCLI3817.1. The model matches temperature trends when anthropogenic forcing is included and does not when it is not. So the model seems valid enough. But the rainfall decline is much more difficult to attribute. My conclusion for that location would not be that the "dry get drier". That truism will only apply in some cases (perhaps not even 50%?) . A more fitting conclusion for SWA is that this area with highly seasonal rainfall got drier, consistent with anthropogenic influences added to the model. My best guess comes from some hints here: http://www.oceanclimatechange.org.au/content/images/uploads/Leeuwin_Current.pdf In particular the weakening of the westerlies and decrease in intense rainfall events. Eyeballing some of the data from bom.gov.au seems to show that what is missing now is the really wet winter months that used to show up regularly at the beginning of the 20th century (with all other months staying about the same). So perhaps it is actually the extremes that used to bump up the yearly average are missing now.
    0 0
  22. Eric (skeptic) @21, I disagree with your final conclusion. If you look at the rainfall anomaly for South Western Australia during the southern wet season (April-November), you will see that not only are the extremely wet seasons absent in later years, but dryer than average seasons become more frequent, whereas wetter than average seasons were more frequent in the early twentieth century. Further, very dry seasons (> 100 less than average) are more frequent toward the end of the twentieth century as well. If you look at the 15 year average, it shows a steady decline approximating in slope to the linear trend. This to me suggests a more or less consistent decline with increasing global temperature. The apparent dominance of a few very wet years in the early record that you see is just a product of the variability which follows from extreme events in a region with low average rainfall (around 700 mm per year).
    0 0
  23. Steve Case, Muoncounter @14 merely demonstrated the folly of using Australian average figures to test a prediction about rainfall patterns in a particular region of Australia. Rainfall patterns in Australia are very different in different locations. That means your argument @4 was about as sensible as arguing that Death Valley is verdant because the average annual rainfall of the contiguous US is 29 inches. Your argument has been thoroughly rebutted, in particular by myself @7 and by bath_ed @16. Some acknowledgement that the data actually contradicts your view, and your initial argument would be nice. Failure of such acknowledgement makes it reasonable to conclude that your views are not driven be evidence.
    0 0
  24. Thanks for the reply Tom. I was looking at graphs like this from BOM for 1917: http://goo.gl/xBCZG It's obviously not systematic or rigorous, but the monthly charts seem to bring out variations that are not as apparent in recent years, e.g. 2007 http://goo.gl/U3lrZ
    0 0
  25. Eric (skeptic) @24, if you are going to check individual stations, it would be better to compare the data for each month over the entire period, rather than year by year. It is also preferable to check a number of stations. In this case, in addition to Cape Naturaliste (33.5 south; 9519), I checked Woodburn (34.7 south; 9621) and Armadale (32.1 south; 9001). If you do so, the first thing you notice is that years of peak rainfall in a give month do not tend to correlate between stations. The second is that the pattern you claim to find is not at all evident. Given that, I think the regional data, by eliminating some of the noise, gives a better picture. Edited to add: For those who want to explore the detailed data themselves, here is the site. I am sorry, but the site is currently butchering the links to the graphs I originally provided. I have included station numbers so that you can look up the graphs for yourselves.
    0 0
  26. What we have witnessed here on this thread is a textbook case of fake-skepticism erecting strawman arguments, fomenting off-topic ideology and employing goalpost shifting & misdirection to drive yet another thread off-topic in the wild-goose-chase of flailing at straw. All the while denial fails to ever acknowledge its errors (as amply illustrated by Tom Curtis, bath-ed, muoncounter, Sphaerica and scaddenp), let alone correct them. Just moves on to the next mission thread. BAU... Fascinating, the ideological underpinnings that drives denial. For there clearly is no basis in the science.
    0 0
  27. Let's test your hypothesis, DB. Steve Case, do you acknowledge that you made an error in using the graph of annual mean rainfall for the entire continent in order to attempt to discount the possibility of global warming-related shifts in regional precipitation patterns and accumulations?
    0 0
  28. DSL #27, Did I make an error using rainfall for all of Australia instead of the regional precipitation patterns? Yes, I would have been better off if I had found the page with all the data first. But now that I've found it, and at your prompting, and some more work on my part shows that most of Australia since 1900 has enjoyed more rain. Tasmania and South Western Australia did indeed trend down over the last 110 years. Depending on your definition of South West Australia that's a little over 5% of the country. Here's the numbers, in cm/yr, and change since 1900, that I get from that page:  It would be nice if TT/TT worked (-: That Australian rainfall has gone up 18% since 1900 I find very surprising. My editorial comment, and there's been plenty of that in this discussion is that drought is brought up over and over and over again, when the dominant change that has occurred and will probably continue to occur in a future warmer world is more rain.
    0 0
  29. Steve #28, As one of a couple of million people living in that "5% of the country", allow me to point out that absolutely nothing you have said contradicts the original post in any way. As it very clearly stated, rainfall in these regions is dominated by cold fronts passing through in winter. As the temperature has risen, those fronts have move further and further south, to the extent that a significant amount of rainfall that would have made landfall in past decades now falls on the ocean to the south of the continent. The decline in rainfall and dam runoff in this region since the 1970s is well-documented and shown again by your own figures, proving the original post is correct. Before getting carried away with the importance of "averages", whether over the whole continent or even a single state like WA, you also might want to take a look at the population distribution and land usage. The north of Australia is tropical, so of course it gets a lot of rain. But most people live in the south. According to your table, WA as a whole has had an increase in rainfall of 22% -- but the south west had a decline of 17%. Guess where the people live? The largest town in the top 3/4 of that image has about 14,000 people. The state as a whole has over 2.3 million. Now look at WA in Google Maps and turn on the satellite view. Have a look at the area in WA that has recorded the biggest increase in rainfall according to the image posted by muoncounter in #14. Compare it to the area that has recorded the biggest decrease. Do you notice how the first area basically looks like desert, while the second is agricultural land? That's because the first area is basically a desert. (I grew up in that area, and in one particular two-year period the only rain we had was during cyclones.) While the rainfall might have increased, it's still not good enough (or reliable enough) to be agricultural land, whereas the area that is suffering the decrease is agricultural land -- the bread basket of the state, basically. Location matters. The problems caused by drought in one region do not disappear because there is increased rainfall in another.
    0 0
  30. Steve, Why do you insist on going back to 1900? Modern AGW is recognized to have taken hold starting in the late 70s. The site to which you linked actually has a map for that. Just click the "Trend" link.: So in the past 42 years, Australia looks not so good. I find it interesting that you bypassed this obvious and very relevant bit of information in your quest for knowledge.
    0 0
  31. Steve,
    ...the dominant change that has occurred and will probably continue to occur in a future warmer world is more rain.
    Look at the facts (particularly when the change to more rain -- beginning of the 19th century -- versus less rain -- last half of the 20th century -- occurred) and what the recent (past 40 years) trend has been, and please more accurately recast your statement concerning "and will probably continue to occur in a future warmer world."
    0 0
  32. Sphaerica @30, precipitation trend maps of Australia started in 1970 are potentially misleading on three counts. First, Australia's wettest three year period on record is 1974-76, due to a strong La Nina; while among its driest periods on record is the period is the early twenty-first century, where a series of El Nino's lead to extensive droughts, and in some areas a 10 year drought. Second, as you will probably have noted, Eastern Australia's rainfall is dominated by ENSO, with El Nino's bringing drought, and La Nina's floods. The intensity of that transition has increased, ie, the floods are wetter and the droughts drier, but as the long term effects of warming on ENSO are uncertain, the apparent recent trends are not projectable. Third, while anthropogenic global warming has taken of since 1975, the Earth responds to temperature change regardless of origin, and the early twentieth century saw significant warming - although not as marked in the SH as in the NH. Therefore to the extent that changes in rainfall pattern are the consequence of global warming, some of that change will have occurred between 1910 and 1940. Consequently, while the use of the 40 year trend graph was valid to show the fallacy in using Australia wide averages in testing hypotheses about regional effects, using them to predict future trends is ill advised for Eastern Australia.
    0 0
  33. steve, I may be wrong but I get the impression you're from the USA - in any event not from Australia. One thing that outsiders, and more than a few Australians, have trouble with is the sheer size of Australia as a whole and the gigantic expanse of desert within. Personally, I have a mental picture of Texas, probably a relic of films half-remembered from childhood, as being a dry and dusty place similar to South Australia's mid-North & Flinders Ranges region. I now know that there are 2 distinct climatic regions and probably several other smaller local climate regimes in Texas. Western Australia is a smidgen less than 4 times the size of Texas (or 150% of Alaska) but with only one southern region of good wheat growing agricultural soil that has traditionally had regular winter rainfall. In fact, Alaska might be a better comparison than multiples of Texas. Most of the interior is unsuitable for agriculture or large settlements. Only particular sub-regions have both climate and soil suitable to support agriculture. South Australia is 'only' half as big again as Texas and it lacks the tropical area that WA has in its north. We also get little to no direct benefit from increased rain in the east. Lake Eyre might be full, but that's only good for a couple of hundred locals and a few thousand seasonal tourists. The benefits to SA accruing to orchards and vineyards from increased flows into the Murray-Darling system are delayed because of its slow flows and, in any event, are of no value at all to grain growers. They need rain - from the sky, in the right quantities, at the right time for seeding, and definitely not in summer at ripening or harvest.
    0 0
  34. Sphaerica #30, Why do I go back to 1900 instead of choosing the 1970-2005 time frame? Because I don't believe in cherry picking. The rise in CO2 due to human activity started well before the 1970's I don't believe that the effect some how lay dormant for nearly a century.
    0 0
  35. Steve @ 34... But if you go back to the 1900's you have a much more complex question on your hands due to other forcings on the climate system. You'll note that climate scientists generally use 1970 and beyond, not because they're cherry picking, but because that is the point where anthropogenic forcing sufficiently asserts itself and becomes distinguishable over the natural system.
    0 0
  36. Back to the topic at hand - the many unique plants of the winter-rainfall zones of South Africa and Australia and the effect on them of a possible southerly retreat of the rain-bearing westerlies - it will be of no comfort to them if rainfall increases in other climatic zones. The endemic plants of the Cape aren't going to derive any benefit if the Lowveld or Kalahari etc get wetter and neither will the plants of south-west Australia suddenly move to the tropical savannas and semi-deserts of the north. I think this illustrates the problems of glib, sweeping contrarian statements such as 'a warmer world is a wetter world' which may be true in a very general sense but are used to distract from the specific problems different regions, ecosystems and species face. A small point: the rainfall maps of Australia and South Africa have a significant difference in that the Australia one separates out the arid zones and the South Africa one doesn't - only the far southwest of the winter rainfall zone is relatively well-watered; the north especially (such as the RSA/Namibia border) is fully arid, just what little rain it gets falls mainly in the winter half of the year. Therefore rain-fed crops and many plant species are restricted to only the southwest.
    0 0
  37. 34, Steve, But choosing 1900 is a convenient cherry pick, because it obscures the effects of AGW, which are known to have really taken hold in the 1970s, with other climate events. In fact, if you look at the data you can very clearly see that rainfall increased in the first half of the century. 32, Tom, Your points are valid, except that: 1) If they computed proper trends then the impact of an early event like that is not going to impact the curve as strongly. You can also, if you prefer, go from 1950 forward: 2) You can not necessarily say that all warming is equivalent. In particular, the changes in rainfall patterns have a lot to do with the expansion of the Hadley Cells and the movement of the ITCZ. Admittedly, greater evaporation has something to do with it, but even that doesn't say anything about where the rain will fall. We had a discussion similar to this one about the Texas drought, and Australia is the flip side of the coin. Here is a diagram of the expansion and poleward movement of the Hadley cell in the Southern Hemisphere. This may well be responsible, now or in time, for adding more seasonal rainfall to the north and drying out the rest of the continent. From Observed poleward expansion of the Hadley circulation since 1979 – Hu & Fu (2007): The ITCZ from various sources:
    0 0

You need to be logged in to post a comment. Login via the left margin or if you're new, register here.


The Consensus Project Website

THE ESCALATOR

(free to republish)


© Copyright 2024 John Cook
Home | Translations | About Us | Privacy | Contact Us