Climate Science Glossary

Term Lookup

Enter a term in the search box to find its definition.

Settings

Use the controls in the far right panel to increase or decrease the number of terms automatically displayed (or to completely turn that feature off).

Term Lookup

Settings


All IPCC definitions taken from Climate Change 2007: The Physical Science Basis. Working Group I Contribution to the Fourth Assessment Report of the Intergovernmental Panel on Climate Change, Annex I, Glossary, pp. 941-954. Cambridge University Press.

Home Arguments Software Resources Comments The Consensus Project Translations About Support

Bluesky Facebook LinkedIn Mastodon MeWe

Twitter YouTube RSS Posts RSS Comments Email Subscribe


Climate's changed before
It's the sun
It's not bad
There is no consensus
It's cooling
Models are unreliable
Temp record is unreliable
Animals and plants can adapt
It hasn't warmed since 1998
Antarctica is gaining ice
View All Arguments...


Username
Password
New? Register here
Forgot your password?

Latest Posts

Archives

Monckton Myth #14: Monckton's Hunt for the H-spot Leaves me Unsatisfied

Posted on 24 February 2011 by MarkR

Monckton Myths (200 x 70 pixels)For some time Monckton has been making claims along the lines of:

“In particular, the models predict  that  if and only  if Man  is the cause of warming, the  tropical upper air, six miles above the ground, should warm up to thrice as fast as the surface”

And suggesting that since this hasn’t been directly measured by satellites or weather balloons, Man can’t be causing warming. Let’s detour one at a time to the graphs he uses, with the first one showing computer models' expected temperature changes across the atmosphere from 1890 to 1990 from greenhouse gases alone. Blue/purple meaning cooling since 1890 and yellow/red meaning warming:


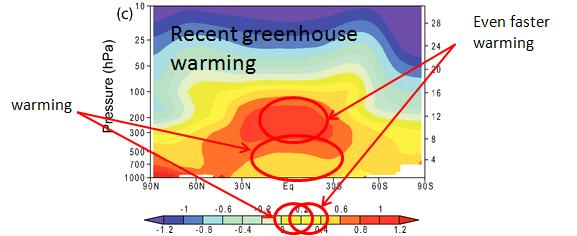
The y-axis is atmospheric height and the x-axis is latitude – left is North and right South. 

The middle of the horizontal axis is the equator and the big red circles show that the lower atmosphere around there (orange, lower down) is expected to warm less strongly than the upper atmosphere (red, higher up at ~200 hPa on the y axis). This isn't a greenhouse only jig, here's the modelled change in temperatures caused by the Sun since 1890:


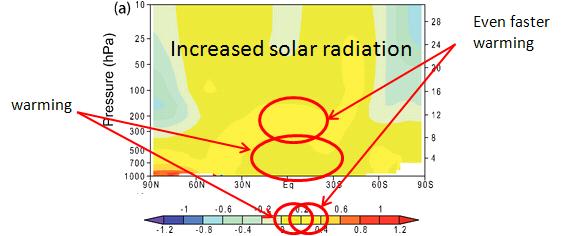
The big red circles show, once again, we expect the tropical upper air to warm faster from solar heating too: Monckton said that this was a human-only jig but his graphs say that it isn't.

This ‘hot spot’ happens because any warming means more evaporation, which cools the surface. The vapour then travels up the atmosphere and condenses higher up, releasing latent heat and boosting warming there (Soden & Held, 2006). The 'hot spot' is the signal that the surface is cooling by sweating like we expect it to.

Temperatures high up are rising and changing wind patterns suggest that the tropical upper air is warming much faster than the surface (Allen & Sherwood, 2008), but temperature sensors have only found a similar rate of warming to the surface. Scientists know there are problems with measurements at this height (e.g. Randel and Wu, 2006), so can't be sure that the temperature measurements are good enough here to rule out the 'hot spot'.

However, if it isn't there then Monckton is pointing out that we're mainly missing a cooling feedback. He realises that it's a cooling effect because he also says;

"the models predict that every Celsius degree of warming should increase evaporation from the Earth’s surface by 1-3%, but the observed  increase  is more  like 6%. From  this  it  is simple  to calculate  that  the  IPCC has overestimated  fourfold  the amount of warming we can expect from adding greenhouse gases to the atmosphere."

Which dodges an important point: if this is causing surface cooling by evaporation it must cause warming higher up when it condenses. Either there is more evaporative cooling and a hot spot higher up or there isn’t and the hot spot doesn't exist.

Monckton implies that the hot spot is a human only response (it isn't) and claims it isn't there (it might be) before saying that in fact we should have a much bigger one than most models predict. Confused?

0 0

Printable Version  |  Link to this page

Comments

Comments 1 to 11:

  1. I hope that I explained this in a clear and correct way; the 'hot spot' is quite a difficult concept and every article I've read has just talked about conserving the moist adiabat, which makes about as much sense to a non-specialist as when a professor of ancient languages starts babbling in Babylonian... If anyone picks out mistakes, let me know so I can correct them. I kept it shorter than I'd like to try and encourage people to read: I didn't properly cover 2 side points: 1) the 'hot spot' also encourages positive water vapour feedback because of Clausius-Clapeyron... but it is a signature of the lapse rate feedback and net modelled water feedback isn't too strongly dependent on that. Plus direct measurements suggest the WV longwave feedback is significant. 2) there could be more evaporation lower down and subsidence leading to it condensing lower down. In that case the lapse rate feedback (negative/cooling) is still weaker.
    0 0
  2. The final sentence is an excellent summary of the whole article. It is a great example of how to summarize the point of an entire article in one simple, memorable, powerful antithesis. Cicero would be proud!
    0 0
  3. Oh, and when I say "last sentence", I am not counting "Confused?", for which I now make the excuse that it is not a full sentence;)
    0 0
  4. I'm not sure how Monckton relates evaporation to climate sensitivity in your last quote. Can someone fill me in on what train of thought he was using? Probably regarding the "fourfold" part too, but I think that might just be him taking a figure form the lower end of that range of 1-3%. I also wonder if anyone will try to write off the hot spot in the second graphic as being too small to be definite or outside of error (i.e. a glitch in the model matrix). Props for the title too, very funny!
    0 0
  5. Alex: I think I know how you can massage out that 'fourfold' figure. Assume that the IPCC climate sensitivity is 4.5 C. Therefore the climate feedback parameter (definition here) = 3.7/3 = 0.8. If you look at the Soden and Held values can be seen in a graph here then pick the highest estimated lapse rate feedback (~-1.2) and treble it then you get a feedback factor of 3.2. This makes your climate sensitivity = 3.7/3.2 = 1.1-1.2 K and yes, you've almost cut the value to a quarter. That's one way of doing it, but it's so far wrong I refuse to believe that's how Lindzen did it... so I'm going to try and find out how he did. It's the sort of thing that would turn up on WUWT.
    0 0
  6. Alex C: The model 'guess' is a reasonable one if you're not at all familiar with the models. Thankfully RC put up the effect of a 2% solar increase and it shows it very clearly: h/t to thingsbreak's post here. I've emailed Lindzen to ask how he calculated the fourfold response, I'm stumped. Perhaps he used a more complicated model, but there's not much point me running through more complex models until I know there's an answer there. I've wasted enough time doing detailed checks of 'facts' quoted as evidence against AGW that I think the onus is definitely on the accuser to support their point now.
    0 0
  7. Thanks for the reply Mark and for trying to follow through. I read Things Break's post (well, the copy here) too and noted the striking similarities (and striking hot spots) in those circumstances. I think that it does clearly show the expected response due to increased forcing, though perhaps the figure above does not so much, as the model output is based not on an assumed 2% increase in solar output but the increase measured over the past century. I'm curious though, this fourfold figure came from Lindzen? I had assumed it was one of Monckton's conjurings as he was the one quoted saying it above, and it doesn't seem as though Lindzen is mentioned in the article.
    0 0
  8. I wish I seen these posts prior to submission but I guess I can use the comments to clarify some matters. I'd do my own post here but I think the hotspot issues are starting to exhaust themselves on the blogs. A rather robust response in global warming simulations is that toward the surface, the pole-to-equator temperature gradient is decreased, and at higher altitudes, the gradient is increased. From the perspective of a vertical-cross section, the temperature tends to be enhanced near the surface in the polar regions and in the upper atmosphere in the tropics (as Fig.1 shows in this post). This behavior as a wide range of dynamic implications, and while it may not be the best behavior to look at for linking GHG's to climate change, much of the literature on responses to climate change (for example, precipitation impacts or hurricane activity) relies closely on the moist stability of the tropics. In the tropics, the coriolis effect is weak and the result is that waves and mixing maintain (roughly) a horizontally uniform temperature profile over the entire tropics (gravity waves spread heat pretty efficiently over an extremely large Rossby radius). In the deep convecting regions, the atmosphere adjusts to stay rather close to the moist adiabat (which is determined by the moisture content in the boundary layer). In non-convecting regions, the free-tropospheric temperatures must also be close to the same moist adiabat. The moist adiabatic lapse rate is not an esoteric concept-- it's just the rate at which temperature declines with height in an atmosphere where you have the typical effects of gas expansion at lower pressure but also a condensing gas releasing its latent heat. The moist adiabatic lapse rate is not a constant value, but is related to the way the saturation vapor pressure increases with temperature (which is not linear). It is easy to show that the steepness of the moist adiabat declines in a warmer atmosphere. See e.g. http://en.wikipedia.org/wiki/File:Emagram.GIF The dashed lines are the slopes of interest, which become roughly dry adiabatic at very cold temperatures and shallow out at warmer temperatures. The amount of latent heat released by condensation by a saturated parcel that moves up the atmospheric column depends on the temperature, which is increased slightly for warmer starting conditions, so the effect is to have enhanced atmospheric warming relative to the surface. Thus the temperature signal discussed in the post doesn't necessarily imply increased “convective activity” or evaporation, but a reduction in lapse rates. The reason the lapse rate feedback is negative is because a warmer parcel of air can radiate more efficiently than a colder one, so the planet can radiate away more from middle atmospheric layers than from the surface (compared to a case with no amplification aloft), which implies a cooler surface temperature. The lapse rate itself is intimately tied to the way the greenhouse effect works. The infrared absorption is only half the story, you need the right vertical profile to get a strong greenhouse effect, and inversions (for example in Antarctica or during the winter in a snowball Earth where there is little convection) can inhibit the ability for GHG's to do much. Regarding Monckton's claim about evaporation, it's usually tough to make sense of anything he says. There's absolutely no clear cut indication the models are doing anything systematically worng with respect to evaporation anyway. There's some studies which suggest global precipitation might be increasing faster than models (starting from Wentz et al 2007 I think), but like the tropical hotspot issue, is an issue that is data problematic...I've also not seen any work that connects this to climate sensitivity at all. In any case, over moist surfaces, what evaporation does is make the surface energy budget "stiff" so that the surface temperature does not deviate substantially from the overlying air temperature. It comes out that the top of the atmosphere energy balance rules the roost in determining the maximum allowed temperature. It should also be noted that theoretical exercises that respect the surface energy budget (or sometimes the tropospheric energy budget), as well as GCMs, indicate that evaporation (and precipitation) increase much less rapidly than the the water vapor actually in the atmosphere (which scales with the Clausius-Clapeyron equation). It's the water vapor content that stays in the atmosphere that determines the water vapor feedback, which itself has little to do with the increase in evaporative flux from the surface. In fact, evaporation could easily decrease in a warmer climate if the wind speeds were to reduce, or if you somehow turned down the solar radiation but kept the temperature increasing (say, by increasing GHG's). Finally, the water vapor feedback is not independent of the strength of the lapse rate feedback. The two feedbacks are connected, so feedback specialists usually talk about a water vapor+lapse rate combined feedback, and the uncertainty in the combined term is less than the individual uncertainties in the individual feedbacks.
    0 0
  9. Thanks for the added details Chris; a lot of that is more complicated than I wanted to put here. Ultimately I think 'cooling by sweating' is a perfectly good analogy. If you construct the energy balance at the surface then it's the latent heat transfer that ultimately leads to the 'hot spot'. I looked at some papers discussing the difference in water vapour content vs precip, and there are some long term series suggesting the walker circulation has weakened which is one of the predictions of how to decouple precip from the C-C response... but again, I thought this was too complex and off topic to cover here. The WV+LR interdependence was why I said my above calculation of how to cut warming by a factor of 4 is 'so far wrong I refuse to believe that's how Lindzen did it'.
    0 0
  10. Hi and first of kudos to all in putting this website together. I've learned a great deal reading it. Who put the circles in the first figure indicating "Even faster warming"? It seems to be pointing to the wrong part of the scale bar. Shouldn't it be closer to the .8 to 1.2 values?
    0 0
  11. Thanks for the pointer explorer, it's a mistake and I'll fix it when I have time!
    0 0

You need to be logged in to post a comment. Login via the left margin or if you're new, register here.


The Consensus Project Website

THE ESCALATOR

(free to republish)


© Copyright 2024 John Cook
Home | Translations | About Us | Privacy | Contact Us