


 Arguments


Why is the Keeling curve so curvy?
Posted on 4 February 2020 by John Cook
An excerpt from the book Cranky Uncle vs. Climate Change, released Feb 25.
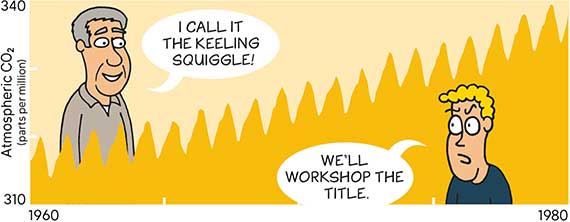
In 1958, Charles Keeling began measuring atmospheric carbon dioxide (CO2) levels in Mauna Loa, Hawaii. He found CO2 rising and falling from year to year. This graph became known as the Keeling Curve.
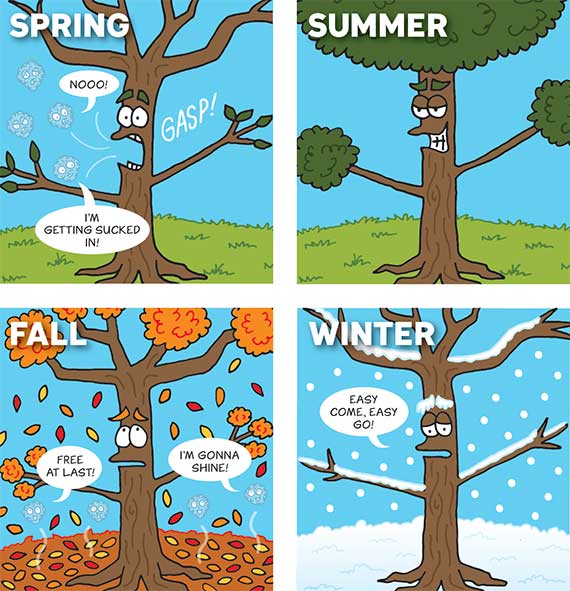
This yearly cycle is due to CO2 moving between the atmosphere and vegetation. In spring, plants convert CO2 into foliage. In autumn, the leaves fall and rot, emitting CO2 into the atmosphere.
Keeling also found that over time, the amount of CO2 in the air was increasing. All our fossil fuel burning is causing a rise in atmospheric CO2.
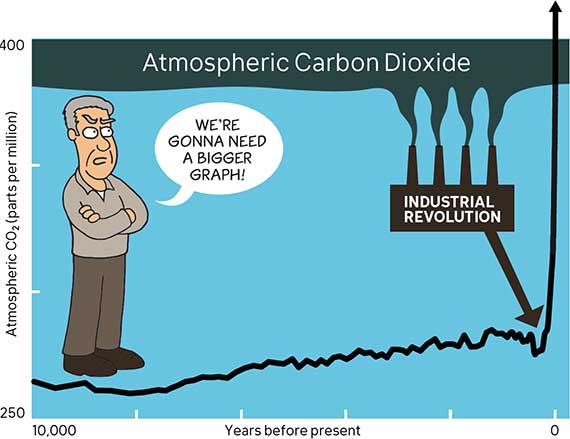
Over thousands of years, atmospheric CO2 levels remained relatively steady. Nature was in balance, with natural emissions equal to natural absorptions. Humans upset the balance during the Industrial Revolution, when we began burning fossil fuels. This sent large amounts of CO2 trapped underground as coal, oil, or gas into the atmosphere. Now atmospheric CO2 has increased to levels not seen in millions of years.
Deniers try to minimize our role in disrupting the carbon cycle through a crafty piece of cherry picking. They argue that human emissions are small compared to natural emissions. For example, humans are emitting around 33 billion metric tons of carbon into the air every year, while nature is emitting around 740 billion metric tons of carbon.
This argument ignores that natural emissions are balanced by natural absorptions. Each year, nature emits approximately 726 billion metric tons of CO2 but also absorbs close to the same amount.
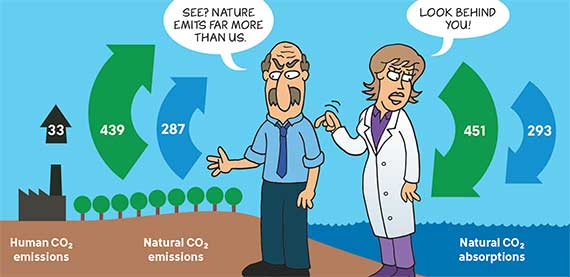
By failing to consider the full picture, this cherry pick distracts from the fact that human CO2 emissions have upset the natural balance. It’s like boasting about your gambling wins while ignoring your losses.

 Cranky Uncle vs. Climate Change uses cartoons, climate science, and critical thinking to make sense of climate denial and misinformation. Guided by psychological research into how to refute misinformation, the book embraces a creative approach, using cartoons and visual analogies to make the science engaging and accessible to readers. The book is written and drawn by John Cook, a former cartoonist who now researches climate communication at George Mason University. Cranky Uncle vs. Climate Change will be published by Kensington Books on Feb 25. Sign up for latest Cranky Uncle news at crankyuncle.com.
Other excerpts from Cranky Uncle vs. Climate Change:
How did climate change get so controversial?
Global warming is happening here and now
Climate goes extreme!


Very nice explanation of the Keeling Curve John and why our seemingly insignificant CO2 emissions matter.
The maxim I learned is "Spring comes in May in Siberia" to explain the shapes of the wiggles. Because yes, the two hemispheres have opposite cycles, but the land masses in the northern hemisphere dominate, and the bulk of Siberia dominates the whole.