


 Arguments
Software
Resources
Comments
The Consensus Project
Translations
About
Support
Arguments
Software
Resources
Comments
The Consensus Project
Translations
About
Support
![]()
![]()
![]()
![]()
![]()
![]()
![]()
![]()
![]()
![]()


![]()


Latest Posts
- 2026 SkS Weekly Climate Change & Global Warming News Roundup #25
- Cooking up the Climate Stripes, with Ed Hawkins
- Skeptical Science New Research for Week #25 2026
- How ‘balcony solar’ could help fight rising utility costs
- Fact brief - Does solar energy need subsidies to compete with fossil fuels?
- Plateauing CO2 emissions have slowed atmospheric growth
- 2026 SkS Weekly Climate Change & Global Warming News Roundup #24
- Skeptical Science New Research for Week #24 2026
- June update: Help still needed to get translations prepared for our website relaunch!
- How many people does heat actually kill?
- Check out the brand-new hurricane ‘cone of uncertainty’ graphics arriving this season
- 2026 SkS Weekly Climate Change & Global Warming News Roundup #23
- SkS Housekeeping: Updating the Comments Policy
- Skeptical Science New Research for Week #23 2026
- Nobody knows the future of energy
- Fact brief - Do electric vehicles almost always have a lower carbon footprint than gasoline-powered cars?
- Solar, wind, and EVs have knocked out a doomsday climate scenario
- 2026 SkS Weekly Climate Change & Global Warming News Roundup #22
- Skeptical Science New Research for Week #22 2026
- The next era of Atlantic hurricanes could be far more destructive
- On the death of RCP8.5
- RCP8.5 Update
- 2026 SkS Weekly Climate Change & Global Warming News Roundup #21
- Skeptical Science New Research for Week #21 2026
- What’s a ‘super El Niño’? And other El Niño questions, answered
- Fact brief - Does electromagnetic radiation from wind turbines pose a threat to human health?
- Five things you need to know about El Niño’s likely comeback
- 2026 SkS Weekly Climate Change & Global Warming News Roundup #20
- Skeptical Science New Research for Week #20 2026
- Higher warming predictions for 2026 and 2027
Archived Rebuttal
This is the archived Intermediate rebuttal to the climate myth "IPCC overestimate temperature rise". Click here to view the latest rebuttal.
What the science says...
|
The IPCC surface temperature projections have been extremely accurate thus far. |
1990 IPCC FAR
The Intergovernmental Panel on Climate Change (IPCC) First Assessment Report (FAR)was published in 1990. The FAR used simple global climate models to estimate changes in the global-mean surface air temperature under various CO2 emissions scenarios. Details about the climate models used by the IPCC are provided in Chapter 6.6 of the report.
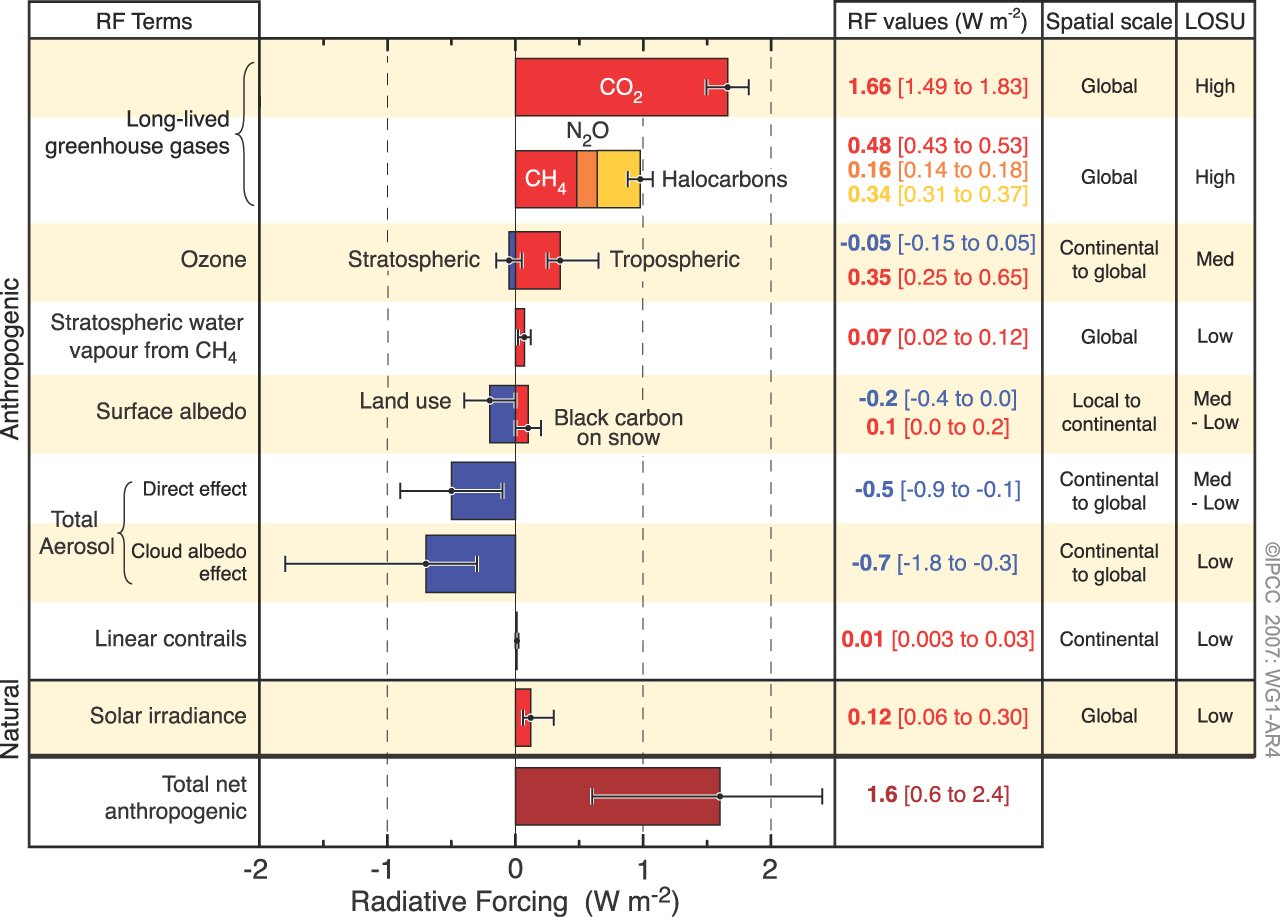
The IPCC FAR ran simulations using various emissions scenarios and climate models. The emissions scenarios included business as usual (BAU) and three other scenarios (B, C, D) in which global human greenhouse gas emissions began slowing in the year 2000. The FAR's projected BAU greenhouse gas (GHG) radiative forcing (global heat imbalance) in 2010 was approximately 3.5 Watts per square meter (W/m2). In the B, C, D scenarios, the projected 2011 forcing was nearly 3 W/m2. The actual GHG radiative forcing in 2011 was approximately 2.8 W/m2, so to this point, we're actually closer to the IPCC FAR's lower emissions scenarios.
The IPCC FAR ran simulations using models with climate sensitivities (the total amount of global surface warming in response to a doubling of atmospheric CO2, including amplifying and dampening feedbacks) of 1.5°C (low), 2.5°C (best), and 4.5°C (high) for doubled CO2 (Figure 1). However, because climate scientists at the time believed a doubling of atmospheric CO2 would cause a larger global heat imbalance than is currently believed, the actual climate sensitivities were approximatly 18% lower (for example, the 'Best' model sensitivity was actually closer to 2.1°C for doubled CO2).

Figure 1: IPCC FAR projected global warming in the BAU emissions scenario using climate models with equilibrium climate sensitivities of 1.3°C (low), 2.1°C (best), and 3.8°C (high) for doubled atmospheric CO2
Figure 2 accounts for the lower observed global heat imbalance than in the IPCC BAU projection, and compares its 'Best' adjusted projection with the observed global surface warming since 1990.

Figure 2: IPCC FAR BAU global surface temperature projection adjusted to reflect observed GHG radiative forcings 1990-2011 (blue) vs. observed surface temperature changes (average of GISS, NCDC, and HadCRUT4; red) for 1990 through 2012.
Scorecard
The IPCC FAR 'Best' BAU projected rate of warming fro 1990 to 2012 was 0.25°C per decade. However, that was based on a scenario with higher emissions than actually occurred. When accounting for actual GHG emissions, the IPCC average 'Best' model projection of 0.2°C per decade is within the uncertainty range of the observed rate of warming (0.15 ± 0.08°C) per decade since 1990.
1995 IPCC SAR
The IPCC Second Assessment Report (SAR)was published in 1995, and improved on the FAR by estimating the cooling effects of aerosols — particulates which block sunlight. The SAR included various human GHG emissions scenarios, so far its scenarios IS92a and b have been closest to actual emissions.
The SAR also maintained the "best estimate" equilibrium climate sensitivity used in the FAR of 2.5°C for a doubling of atmospheric CO2. However, as in the FAR, because climate scientists at the time believed a doubling of atmospheric CO2 would cause a larger global heat imbalance than is currently believed, the actual "best estimate" model sensitivity was closer to 2.1°C for doubled CO2.
Using that sensitivity, and the various IS92 emissions scenarios, the SAR projected the future average global surface temperature change to 2100 (Figure 3).

Figure 3: Projected global mean surface temperature changes from 1990 to 2100 for the full set of IS92 emission scenarios. A climate sensitivity of 2.12°C is assumed.
Figure 4 compares the IPCC SAR global surface warming projection for the most accurate emissions scenario (IS92a) to the observed surface warming from 1990 to 2012.

Figure 4: IPCC SAR Scenario IS92a global surface temperature projection (blue) vs. observed surface temperature changes (average of GISS, NCDC, and HadCRUT4; red) for 1990 through 2012.
Scorecard
The IPCC SAR IS92a projected rate of warming from 1990 to 2012 was 0.14°C per decade. This is within the uncertainty range of the observed rate of warming (0.15 ± 0.08°C) per decade since 1990, and very close to the central estimate.
2001 IPCC TAR
The IPCC Third Assessment Report (TAR) was published in 2001, and included more complex global climate models and more overall model simulations. The IS92 emissions scenarios used in the SAR were replaced by the IPCC Special Report on Emission Scenarios (SRES), which considered various possible future human development storylines.
The IPCC model projections of future warming based on the varios SRES and human emissions only (both GHG warming and aerosol cooling, but no natural influences) are show in Figure 5.

Figure 5: Historical human-caused global mean temperature change and future changes for the six illustrative SRES scenarios using a simple climate model. Also for comparison, following the same method, results are shown for IS92a. The dark blue shading represents the envelope of the full set of 35 SRES scenarios using the simple model ensemble mean results. The bars show the range of simple model results in 2100.
Thus far we are on track with the SRES A2 emissions path. Figure 6 compares the IPCC TAR projections under Scenario A2 with the observed global surface temperature change from 1990 through 2012.

Figure 6: IPCC TAR model projection for emissions Scenario A2 (blue) vs. observed surface temperature changes (average of GISS, NCDC, and HadCRUT4; red) for 1990 through 2012.
Scorecard
The IPCC TAR Scenario A2 projected rate of warming from 1990 to 2012 was 0.16°C per decade. This is within the uncertainty range of the observed rate of warming (0.15 ± 0.08°C) per decade since 1990, and very close to the central estimate.
2007 IPCC AR4
In 2007, the IPCC published its Fourth Assessment Report (AR4). In the Working Group I (the physical basis) report, Chapter 8 was devoted to climate models and their evaluation. Section 8.2 discusses the advances in modeling between the TAR and AR4. Essentially, the models became more complex and incoporated more climate influences.
As in the TAR, AR4 used the SRES to project future warming under various possible GHG emissions scenarios. Figure 7 shows the projected change in global average surface temperature for the various SRES.

Figure 7: Solid lines are multi-model global averages of surface warming (relative to 1980–1999) for the SRES scenarios A2, A1B, and B1, shown as continuations of the 20th century simulations. Shading denotes the ±1 standard deviation range of individual model annual averages. The orange line is for the experiment where concentrations were held constant at year 2000 values. The grey bars at right indicate the best estimate (solid line within each bar) and the likely range assessed for the six SRES marker scenarios.
We can therefore again compare the Scenario A2 multi-model global surface warming projections to the observed warming, in this case since 2000, when the AR4 model simulations began (Figure 8).
Figure 8:
Scorecard
The IPCC TAR Scenario A2 projected rate of warming from 2000 to 2012 was 0.16°C per decade. This is within the uncertainty range of the observed rate of warming (0.06 ± 0.16°C) per decade since 2000, though the observed rate of warming has likely been lower than the AR4 projection due to the preponderance of natural temperature influences being in the cooling direction since 2000.
Updated on 2012-12-23 by dana1981.


THE ESCALATOR

(free to republish)