Climate Science Glossary

Term Lookup

Enter a term in the search box to find its definition.

Settings

Use the controls in the far right panel to increase or decrease the number of terms automatically displayed (or to completely turn that feature off).

Term Lookup

Settings


All IPCC definitions taken from Climate Change 2007: The Physical Science Basis. Working Group I Contribution to the Fourth Assessment Report of the Intergovernmental Panel on Climate Change, Annex I, Glossary, pp. 941-954. Cambridge University Press.

Home Arguments Software Resources Comments The Consensus Project Translations About Support

Bluesky Facebook LinkedIn Mastodon MeWe

Twitter YouTube RSS Posts RSS Comments Email Subscribe


Climate's changed before
It's the sun
It's not bad
There is no consensus
It's cooling
Models are unreliable
Temp record is unreliable
Animals and plants can adapt
It hasn't warmed since 1998
Antarctica is gaining ice
View All Arguments...


Username
Password
New? Register here
Forgot your password?

Latest Posts

Archives

How do we know more CO2 is causing warming?

What the science says...

Select a level... Basic Intermediate Advanced

An enhanced greenhouse effect from CO2 has been confirmed by multiple lines of empirical evidence.

Climate Myth...

Increasing CO2 has little to no effect

"While major green house gas H2O substantially warms the Earth, minor green house gases such as CO2 have little effect.... The 6-fold increase in hydrocarbon use since 1940 has had no noticeable effect on atmospheric temperature ... " (Environmental Effects of Increased Atmospheric Carbon Dioxide)

At-a-glance

To make a statement like, "minor greenhouse gases such as CO2 have little effect", is to ignore 160 years of science history. So let's look at who figured out the heat-trapping properties of carbon dioxide and when.

Experiments involving various gas mixtures had demonstrated the heat-trapping properties of water vapour, CO2 and methane in the 1850s. But those effects were yet to be quantified - there were no meaningful numbers. It was to be another 40 years before that happened.

Swedish scientist Svante Arrhenius (1859-1927) was the person who crunched the numbers. The results were presented in a remarkable paper, "On the Influence of Carbonic Acid in the Air upon the Temperature of the Ground", in 1896.

The many calculations in the 1896 paper include estimates of the amounts of CO2 increase or decrease required to drive the climate into a different state. One example used was the Hothouse climate of the Cenozoic, around 50 million years ago. Another was the glaciations of the last few hundred millennia.

To get a temperature rise of 8-9°C in the Arctic, Arrhenius calculated that CO2 levels would have to increase by 2.5 to 3 times 1890s levels. To lower the temperature 4–5°C to return to glacial conditions, he calculated a drop in CO2 was needed of 0.62-0.55 times 1890s levels.

We know CO2 levels in the 1890s from ice-core data. They were around 295 ppm. Let's do the sums. A reduction factor of 0.55 to 0.62 on 295 ppm gives 162.2-183.9 ppm. Modern ice-core measurements representing the past 800,000 years show that in glacial periods, CO2 levels fell to 170-180 ppm.

What we now know due to additional research since 1896 when Arrhenius worked on this, is that CO2 was an essential 'amplifying feedback'. That means changes triggered by long term, cyclic variations in Earth's orbit cause warming or cooling and CO2 release or entrapment in turn. Those changes in CO2 levels affected the strength of Earth's greenhouse effect. Changes in the strength of the greenhouse effect then completed the job of pushing conditions from interglacial to glacial - or vice-versa.

Arrhenius also made an important point regarding water vapour: "From observations made during balloon voyages, we know also that the distribution of the aqueous vapour may be very irregular, and different from the ideal mean distribution." This statement holds true today: water vapour is a greenhouse gas but because water exists in gas, liquid and solid forms in the atmosphere, it is continually cycling in and out of the air. It is distributed in a highly uneven fashion and is uncommon in the upper atmosphere. That's where it differs from CO2.

Once CO2 is up there, it's up there for a long time. As a consequence it has a pretty even distribution: 'well-mixed' is the term. As Arrhenius quantified all that time ago, once it's up there it constantly absorbs and re-radiates heat in all directions. That's why dumping 44 billion tons of it into our atmosphere in just one year (2019 - IPCC Sixth Assessment Report 2022) is a really bad idea.

Please use this form to provide feedback about this new "At a glance" section. Read a more technical version below or dig deeper via the tabs above!


Further details

Good scientific theories are said to have ‘predictive power’. In other words, armed only with a theory, we should be able to make predictions about a subject. If the theory’s any good, the predictions will come true.

Here’s an example: when the Periodic Table of the chemical elements was proposed in 1869, many elements were yet to be discovered. Using the theory behind the Periodic Table, the Russian chemist Dmitri Mendeleev was able to predict the properties of germanium, gallium and scandium prior to their discovery in 1886, 1875 and 1879 respectively. His predictions were found to be correct.

The effect on Earth's greenhouse effect of adding man-made CO2 is predicted in the theory of greenhouse gases. This theory was first proposed by Swedish scientist Svante Arrhenius in 1896, based on earlier work by Fourier, Foote and Tyndall. Many scientists have refined the theory since Arrhenius published his work in 1896. Nearly all have reached the same conclusion: if we increase the amount of greenhouse gases in the atmosphere, the Earth will warm up.

Where there is less agreement is with respect to the exact amount of warming. This issue is called 'climate sensitivity', the amount the temperatures will increase if CO2 is doubled from pre-industrial levels. Climate models have predicted the least temperature rise would be on average 1.65°C (2.97°F) , but upper estimates vary a lot, averaging 5.2°C (9.36°F). Current best estimates are for a rise of around 3°C (5.4°F), with a likely maximum of 4.5°C (8.1°F). A key reason for this range of outcomes is because of the large number of potential climate feedbacks and their variable interactions with one another. Put simply, some are much better understood than others.

What Goes Down…

The greenhouse effect works like this: Energy arrives from the sun in the form of visible light and ultraviolet radiation. The Earth then emits some of this energy as infrared radiation. Greenhouse gases in the atmosphere 'capture' some of this heat, then re-emit it in all directions - including back to the Earth's surface.

Through this process, CO2 and other greenhouse gases keep the Earth’s surface 33°Celsius (59.4°F) warmer than it would be without them. We have added 42% more CO2, and temperatures have gone up. There should be some evidence that links CO2 to the temperature rise.

So far, the average global temperature has gone up by more than 1 degrees C (1.9°F):

"According to an ongoing temperature analysis led by scientists at NASA’s Goddard Institute for Space Studies (GISS), the average global temperature on Earth has increased by at least 1.1° Celsius (1.9° Fahrenheit) since 1880. The majority of the warming has occurred since 1975, at a rate of roughly 0.15 to 0.20°C per decade."

The temperatures are going up, just like the theory predicted. But where’s the connection with CO2, or other greenhouse gases like methane, ozone or nitrous oxide?

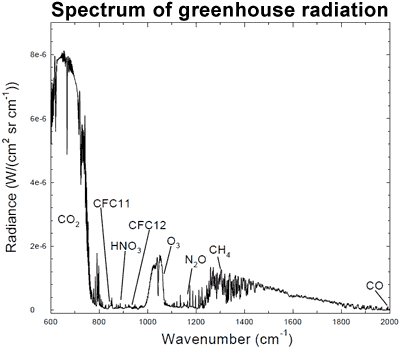
The connection can be found in the spectrum of greenhouse radiation. Using high-resolution FTIR spectroscopy, we can measure the exact wavelengths of long-wave (infrared) radiation reaching the ground.
Greenhouse spectrum

Figure 1: Spectrum of the greenhouse radiation measured at the surface. Greenhouse effect from water vapour is filtered out, showing the contributions of other greenhouse gases (Evans 2006).

Sure enough, we can see that CO2 is adding considerable warming, along with ozone (O3) and methane (CH4). This is called surface radiative forcing, and the measurements are part of the empirical evidence that CO2 is causing the warming.

...Must Go Up

How long has CO2 been contributing to increased warming? According to NASA, “Two-thirds of the warming has occurred since 1975”. Is there a reliable way to identify CO2’s influence on temperatures over that period?

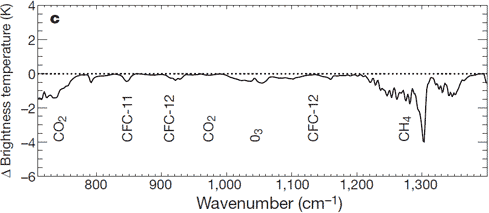
There is: we can measure the wavelengths of long-wave radiation leaving the Earth (upward radiation). Satellites have recorded the Earth's outgoing radiation. We can examine the spectrum of upward long-wave radiation in 1970 and 1997 to see if there are changes.
Change in outgoing radiation

Figure 2: Change in spectrum from 1970 to 1996 due to trace gases. 'Brightness temperature' indicates equivalent blackbody temperature (Harries et al. 2001).

This time, we see that during the period when temperatures increased the most, emissions of upward radiation have decreased through radiative trapping at exactly the same wavenumbers as they increased for downward radiation. The same greenhouse gases are identified: CO2, methane, ozone and so on.

The Empirical Evidence

As temperatures started to rise, scientists became more and more interested in the cause. Many theories were proposed. All save one have fallen by the wayside, discarded for lack of evidence. One theory alone has stood the test of time, strengthened by experiments.

We have known CO2 absorbs and re-emits longwave radiation, since the days of Foote, Tyndall and Arrhenius in the 19th Century. The theory of greenhouse gases predicts that if we increase the proportion of greenhouse gases, more warming will occur.

Scientists have measured the influence of CO2 on both incoming solar energy and outgoing long-wave radiation. Less longwave radiation is escaping to space at the specific wavelengths of greenhouse gases. Increased longwave radiation is measured at the surface of the Earth at the same wavelengths.

Last updated on 16 July 2023 by John Mason. View Archives

Printable Version  |  Offline PDF Version  |  Link to this page

Argument Feedback

Please use this form to let us know about suggested updates to this rebuttal.

Further reading

A good summation of the physics of radiative forcing can be found in V. Ramanathan's Trace-Gas Greenhouse Effect and Global Warming.

Denial101x video

Comments

Prev  1  2  3  4  5  6  7  8  9  10  11  12  13  14  15  16  17  18  Next

Comments 26 to 50 out of 443:

  1. babelsguy, you and I have just written more or less the same post in two different contexts (see here) I think that says a lot for the fundamental nature of scientific knowledge ;-)
  2. I'm confused; where is the backscatter represented in this NASA energy budget representation of Earth? http://eosweb.larc.nasa.gov/EDDOCS/images/Erb/components2.gif Further to that the whole greenhouse gas theory is based on erroneous assumptions of the Earth system acting as a black body. Incorrect application of the Stephan-Boltzman constant in this case means that the entire theory is based on a basic undergraduate error. NASA discovered this at the time of the Apollo moon landings, when they discovered their assumptions on Moon surface temperatures by day and night were out by up to 60K - because a black body is a THEORETICAL two dimensional surface, there is no such comparison either with the surface of a planet/moon or the 3 dimensional gaseous atmosphere that surrounds it.. Therefore the entire reason we don't freeze is down to the dynamics of the entire atmosphere that surrounds us, not to trace gases. The charge that the second law of thermodynamics is broken by postulating that heat moves from colder atmosphere to warmer surface has never been satisfactorily answered. NASA know this and put in in plain sight in their energy budget diagram, nothing in that allows for any change in composition of minor components of the atmosphere causing large changes in the planetary heat budget - an increase in heat content just increases the convection and radiation components to maintain balance. The complexity of the climate system is caused by the latent heat content of the oceans, which transfer heat in timescales of hundreds and thousands of years due to the massive difference in their heat capacity. And finally the whole system is dependent on the only external energy source, the Sun. It is that, plus the interaction with the oceans on a millennial scale, that controls our planet's climate. For us to pretend we can contol this system by tweaking one trace gas like a thermostat is arrogance of the highest magnitude
  3. The temperature gradient in the atmosphere of 6K/km is mainly due to the adiabatic compression of the air (gravitation) rather than to the mysterious greenhouse effect. http://freenet-homepage.de/klima/atmoseff-en.htm
  4. Curious but when showing changes in absorbtion of infrared why is the contribution from H2O always filtered out? It would seem to me that this would become more positive as the atmosphere warms.
  5. TOP - because H2O is FEEDBACK. Any forcing,= that raises the temperature of atmosphere will increase the water content and thus the GHG effect from it. If you want to know about the FORCING due to increase in anthropogenic gases then you need to filter out the feedback.
  6. Stuart, no, you cannot use area. The energy is not absorbed in the intervening area between the sun and the earth, it is absorbed by the first surface it strikes. Using this raito you get an almost 1 to 1 equivalency of IR.
  7. Tom Dayton. Yes, the sun might produce the greater proportion of its energy in the visible, but it produces more IR then the earth. Go back and take a look at black body radiation, youo will see what I mean.
  8. That good friend of AGW, Dr. Roy Spencer, has empirical evidence for the greenhouse effect. "Particularly difficult to grasp is the concept of adding a greenhouse gas to a COLD atmosphere, and that causing a temperature increase at the surface of the Earth, which is already WARM. This, of course, is what is expected to happen from adding more carbon dioixde to the atmosphere: “global warming”. ... This [Spencer's experiment] shows that the addition of an IR absorber/emitter, even at a cold temperature (the middle level clouds were probably somewhere around 30 deg. F), causes a warm object (the thermopile [in his IR thermometer]) to warm even more! This is the effect that some people claim is impossible.
  9. Poor Roy Spencer doesn't understand that what he is measuring is the temperature of the night air not the absorption of IR from the ground. He (perhaps subconsciously) confuses the phenomenon of emission with reflection. The IR emission of CO2 downwards depends only on the temperature of the air not on how that temperature was achieved; whether though IR absorption, convection, water condensation or sunlight. In this above article it says:
    "... Satellite measurements confirm less longwave radiation is escaping to space...Surface measurements find more longwave radiation returning back to Earth at these same wavelengths."
    If the atmosphere is warmer, then it should emit more IR in both the down and up directions. If it's in fact radiating more IR downward but less upward, then this phenomena is reflection not absorption and emission.
  10. Stylo, "more longwave radiation returning back to Earth" means "more than previously." The atmosphere still radiates in all directions, and John actually is referring to absorption/emission rather than reflection. Imagine an Earth with no greenhouse gases in its atmosphere. 100% of the thermal radiation leaving the surface and passing through the atmosphere goes upward and out into space. Now add a small concentration of greenhouse gases. A small part of that longwave radiation will be absorbed by GHG molecules, which will then emit energy in all directions, including downward. So now somewhat less than 100% of the thermal radiation within the atmosphere is moving in an upwards direction. And as you increase the concentration of GHGs, the downward component becomes correspondingly larger. The downward thermal IR flux is indeed caused by emittance, not reflectance.
  11. New summary paper Infrared radiation and planetary temperature in Physics Today. Covers the basic physics, addresses the 'saturation fallacy', compares absorption of CO2 and H2O and ties in AIRS data. Adding more greenhouse gas to the atmosphere makes higher, more tenuous, formerly transparent portions of the atmosphere opaque to IR and thus increases the difference between ground temperature and the radiating temperature. The result, once the system has come to equilibrium, is surface warming.
  12. muoncounter - I was just reading that article this afternoon, wanted to put in a link, but couldn't find a publicly accessible version! Thanks for putting it in. Excellent paper. I especially appreciated Figure 2d, showing the interleaving of CO2 and H2O spectral lines.
  13. #37: I was surprised to find a way around the paywall. Nice that he also mentions that molecules like N2 are transparent to IR 'in earthlike conditions'. Perhaps some of our deniers are actually speaking about conditions on Titan?
  14. The link to Ramanathan's paper provided under the Further Reading's tab does not work.
    Response: [Daniel Bailey] The free abstract can be found here.
  15. The absorbtion bands of CO2 and water vapor overlap making it difficult to parse out the purely absorbtive greenhouse contribution of incremental CO2. How are we so sure water vapor would not absorb the photons if CO2 were removed, and for that matter, sure water vapor is not absorbing the photons INSTEAD of CO2. I realize both signatures are visible from space, but is seems the parsing problem should apply here as well.
  16. Numerous articles about this, but try Schmidt et al, 2010 for serious crack at it.
  17. trunkmonkey@40 The upper atmosphere, where the Earth's energy budget is decided is very cold and hence very dry. There isn't a great deal of water vapour there to absorb the photons. There is a good overview of most of this from Spencer Weart and Ray Pierrehumbert at Realclimate here. The summary is here, emphasis mine: So, if a skeptical friend hits you with the "saturation argument" against global warming, here’s all you need to say: (a) You’d still get an increase in greenhouse warming even if the atmosphere were saturated, because it’s the absorption in the thin upper atmosphere (which is unsaturated) that counts (b) It’s not even true that the atmosphere is actually saturated with respect to absorption by CO2, (c) Water vapor doesn’t overwhelm the effects of CO2 because there’s little water vapor in the high, cold regions from which infrared escapes, and at the low pressures there water vapor absorption is like a leaky sieve, which would let a lot more radiation through were it not for CO2, and (d) These issues were satisfactorily addressed by physicists 50 years ago, and the necessary physics is included in all climate models. There is also a follow up post here where Ray Pierrehumbert goes into the physics in more detail. Hopefully those two posts answer your questions, in short, physics has been able to solve this problem for about sixty years.
  18. This is one of the most bizarre things about the AGW 'skeptic' movement. After Arrhenius first suggested the possibility of AGW in 1896 real skeptics countered with arguments like 'the CO2 effect is saturated' and 'oceans would absorb all the extra CO2'... which based on the limited knowledge of the time were compelling enough that the vast majority of scientists rejected AGW. It was only after these objections were disproved by other advancements, around the 1960s, that science started looking at the possibility of AGW again... and found that it was already underway. Yet here we are half a century later and the modern 'skeptics' are recycling these ancient arguments as if they were new and valid... rather than long since proven false.
  19. I'm a math major but I haven't even finished my undergraduate degree yet. So, while this stuff isn't a completely foreign language, it's close. I have a couple questions that I haven't seen a straight answer for yet. 1: I know that the CO2 band is absorbing energy attempting to exit our atmosphere and that the satellite readings prove this. What I've yet to find a straight answer on is this: I read somewhere(I think here?), that despite this absorption from the GHG bands, the actual radiant energy escaping is still greater than going in from the sun. Is this true? Is so, how is this explained? I've tried finding the answer to no avail. 2. I've seen the graphs showing that since the start of the industrial era temperatures have clearly been on a steady climb and that there's no chance it's solely due to the sun's activity. I've read that temperatures pre-industrial age were also steadily rising. Is this true? If so, is it the rate of increase that is of concern? 3. Last one. I've read and seen in the graphs that methane can play a much bigger role in the GHG effect than can CO2. What are the real world applications to this? How do they compare to our CO2 production? Thanks
  20. learner - as a maths major, you would probably enjoy the treatment of these basic topics over at science of Doom. The questions are really require more treatment than a blog answer can give you. Methane is I think 12 times more powerful than CO2 as a GHG but its concentration is a/ measured in ppb instead of ppm so its effect is less than CO2 and b/ eventually oxidized to CO2
  21. Actually Scaddenp, CH4 is 24 times more powerful than a CO2 as a GHG, on a per molecule basis. However, the total amount of CH4 in the atmosphere is nowhere near that of CO2. This has been discussed already and is also treated on RC. Truly interested readers should become proficient at using search engines on both sites.
  22. thepoodlebites - "How do you separate warming from natural climate variability and CO2 rise?" Look at the levels of forcings that are currently causing climate change, up in Figure 4 of the 'Advanced' tab of this page. It's really a simple case of attributing cause and effect.
  23. #47 Have there been any updated model runs since Meehl et al. (2004)? It would be interesting to see how the temperature plots (1890-2000) would look including data from the last decade, using the same model assumptions. I'm wondering if all of the natural components have been properly accounted for. Model parameters can be adjusted to match any set of temperature observations. The statement that "late-twentieth-century warming can only be reproduced in the model with anthropogenic forcing" is a bit too strong as a conclusion without including the need for follow-up studies.
  24. "Model parameters can be adjusted to match any set of temperature observations" I am tired of this bit of nonsense being repeated. Show me an example of any model parameter in a GCM that is tuned to match a global temperature record. Put up or shut up. Parameterization is done inside the narrow focus of the particular response function. (eg wind speed to temperature gradient). If it were possible to "tune" parameters arbitrarily in a physics model then tell me why some skeptic hasn't produced a GCM that make CO2 irrelevant? RC regularly updated model-data comparison. Furthermore, the model archives would allow you compare prediction to actual yourself. As for updates - Hansen et al 2011 discussed in "Oceans are cooling" is certainly doing that.
  25. #49 scaddenp So the statement “model parameters can be adjusted to match any set of temperature observations" is not true? I don’t consider “put up or shut up” or “do it yourself” as compelling arguments in a debate on the scientific issues. And for the record, I have never said that CO2 is irrelevant. The question remains climate sensitivity to CO2 rise. I was specifically addressing the radiative forcing components that Meehl used. The conclusion that “the negative and positive forcings are roughly equal and cancel each other out, and the natural forcings over the past half century have also been approximately zero” to be extremely convenient. So if “radiative forcing from CO2 alone gives us a good estimate as to how much we expect to see the Earth's surface temperature change,” why not run Meehl’s 2004 model again with the same forcings and include observations from the last decade. My guess is that the model temperature predictions based on CO2 rise alone will not match the observed temperature record since 2000. If that is the case then the radiative forcing components that Meehl used in 2004 were not accurate and that forcing from natural climate variability has not been not properly accounted for. Or to put it another way, the temperature record for the last decade can not be reproduced in the model with anthropogenic forcing alone. When you get a chance, can you please point me to RC’s regularly updated model-data comparisons?

Prev  1  2  3  4  5  6  7  8  9  10  11  12  13  14  15  16  17  18  Next

Post a Comment

Political, off-topic or ad hominem comments will be deleted. Comments Policy...

You need to be logged in to post a comment. Login via the left margin or if you're new, register here.

Link to this page


The Consensus Project Website

THE ESCALATOR

(free to republish)


© Copyright 2024 John Cook
Home | Translations | About Us | Privacy | Contact Us