Climate Science Glossary

Term Lookup

Enter a term in the search box to find its definition.

Settings

Use the controls in the far right panel to increase or decrease the number of terms automatically displayed (or to completely turn that feature off).

Term Lookup

Settings


All IPCC definitions taken from Climate Change 2007: The Physical Science Basis. Working Group I Contribution to the Fourth Assessment Report of the Intergovernmental Panel on Climate Change, Annex I, Glossary, pp. 941-954. Cambridge University Press.

Home Arguments Software Resources Comments The Consensus Project Translations About Support

Bluesky Facebook LinkedIn Mastodon MeWe

Twitter YouTube RSS Posts RSS Comments Email Subscribe


Climate's changed before
It's the sun
It's not bad
There is no consensus
It's cooling
Models are unreliable
Temp record is unreliable
Animals and plants can adapt
It hasn't warmed since 1998
Antarctica is gaining ice
View All Arguments...


Username
Password
New? Register here
Forgot your password?

Latest Posts

Archives

Working out climate sensitivity from satellite measurements

What the science says...

Lindzen's analysis has several flaws, such as only looking at data in the tropics. A number of independent studies using near-global satellite data find positive feedback and high climate sensitivity.

Climate Myth...

Lindzen and Choi find low climate sensitivity

Climate feedbacks are estimated from fluctuations in the outgoing radiation budget from the latest version of Earth Radiation Budget Experiment (ERBE) nonscanner data. It appears, for the entire tropics, the observed outgoing radiation fluxes increase with the increase in sea surface temperatures (SSTs). The observed behavior of radiation fluxes implies negative feedback processes associated with relatively low climate sensitivity. This is the opposite of the behavior of 11 atmospheric models forced by the same SSTs. (Lindzen & Choi 2009)

Climate sensitivity is a measure of how much our climate responds to an energy imbalance. The most common definition is the change in global temperature if the amount of atmospheric CO2 was doubled. If there were no feedbacks, climate sensitivity would be around 1°C. But we know there are a number of feedbacks, both positive and negative. So how do we determine the net feedback? An empirical solution is to observe how our climate responds to temperature change. We have satellite measurements of the radiation budget and surface measurements of temperature. Putting the two together should give us an indication of net feedback.

One paper that attempts to do this is On the determination of climate feedbacks from ERBE data (Lindzen & Choi 2009). It looks at sea surface temperature in the tropics (20° South to 20° North) from 1986 to 2000. Specifically, it looked at periods where the change in temperature was greater than 0.2°C, marked by red and blue colors (Figure 1).
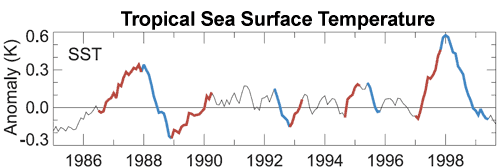

Figure 1: Monthly sea surface temperature for 20° South to 20° North. Periods of temperature change greater than 0.2°C marked by red and blue (Lindzen & Choi 2009).

Lindzen et al also analysed satellite measurements of outgoing radiation over these periods. As short-term tropical sea surface temperatures are largely driven by the El Nino Southern Oscillation, the change in outward radiation offers an insight into how climate responds to changing temperature. Their analysis found that when it gets warmer, there was more outgoing radiation escaping to space. They concluded that net feedback is negative and our planet has a low climate sensitivity of about 0.5°C.

Debunked by Trenberth

However, a response to this paper, Relationships between tropical sea surface temperature and top-of-atmosphere radiation (Trenberth et al 2010) revealed a number of flaws in Lindzen's analysis. It turns out the low climate sensitivity result is heavily dependent on the choice of start and end points in the periods they analyse. Small changes in their choice of dates entirely change the result. Essentially, one could tweak the start and end points to obtain any feedback one wishes.
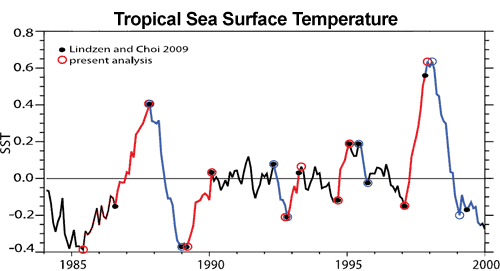

Figure 2: Warming (red) and cooling (blue) intervals of tropical SST (20°N – 20°S) used by Lindzen & Choi (2009) (solid circles) and an alternative selection proposed derived from an objective approach (open circles) (Trenberth et al 2010).

Debunked by Murphy

Another major flaw in Lindzen's analysis is that they attempt to calculate global climate sensitivity from tropical data. The tropics are not a closed system - a great deal of energy is exchanged between the tropics and subtropics. To properly calculate global climate sensitivity, global observations are required.

This is confirmed by another paper published in early May (Murphy 2010). This paper finds that small changes in the heat transport between the tropics and subtropics can swamp the tropical signal. They conclude that climate sensitivity must be calculated from global data.

Debunked by Chung

In addition, another paper reproduced the analysis from Lindzen & Choi (2009) and compared it to results using near-global data (Chung et al 2010). The near-global data find net positive feedback and the authors conclude that the tropical ocean is not an adequate region for determining global climate sensitivity.

Debunked by Dessler

Dessler (2011) found a number of errors in Lindzen and Choi (2009) (slightly revised as Lindzen & Choi (2011)).  First, Lindzen and Choi's mathematical formula  to calculate the Earth's energy budget may violate the laws of thermodynamics - allowing for the impossible situation where ocean warming is able to cause ocean warming.  Secondly, Dessler finds that the heating of the climate system through ocean heat transport is approximately 20 times larger than the change in top of the atmosphere (TOA) energy flux due to cloud cover changes.  Lindzen and Choi assumed the ratio was close to 2 - an order of magnitude too small.

Thirdly, Lindzen and Choi plot a time regression of change in TOA energy flux due to cloud cover changes vs. sea surface temperature changes.  They find larger negative slopes in their regression when cloud changes happen before surface temperature changes, vs. positive slopes when temperature changes happen first, and thus conclude that clouds must be causing global warming.

However, Dessler also plots climate model results and finds that they also simulate negative time regression slopes when cloud changes lead temperature changes.  Crucially, sea surface temperatures are specified by the models.  This means that in these models, clouds respond to sea surface temperature changes, but not vice-versa.  This suggests that the lagged result first found by Lindzen and Choi is actually a result of variations in atmospheric circulation driven by changes in sea surface temperature, and contrary to Lindzen's claims, is not evidence that clouds are causing climate change, because in the models which successfully replicate the cloud-temperature lag, temperatures cannot be driven by cloud changes.

2011 Repeat

Lindzen and Choi tried to address some of the criticisms of their 2009 paper in a new version which they submitted in 2011 (LC11), after Lindzen himself went as far as to admit that their 2009 paper contained "some stupid mistakes...It was just embarrassing."  However, LC11 did not address most of the main comments and contradictory results from their 2009 paper.

Lindzen and Choi first submitted LC11 to the Proceedings of the National Academy of Sciences (PNAS) after adding some data from the Clouds and the Earth’s Radiant Energy System (CERES).

PNAS editors sent LC11 out to four reviewers, who provided comments available here.  Two of the reviewers were selected by Lindzen, and two others by the PNAS Board.  All four reviewers were unanimous that while the subject matter of the paper was of sufficient general interest to warrant publication in PNAS, the paper was not of suitable quality, and its conclusions were not justified.  Only one of the four reviewers felt that the procedures in the paper were adequately described. 

As PNAS Reviewer 1 commented,

"The paper is based on...basic untested and fundamentally flawed assumptions about global climate sensitivity"

These remaining flaws in LC11 included:

  • Assuming that that correlations observed in the tropics reflect global climate feedbacks.
  • Focusing on short-term local tropical changes which might not be representative of equilibrium climate sensitivity, because for example the albedo feedback from melting ice at the poles is obviously not reflected in the tropics.
  • Inadequately explaining methodology in the paper in sufficient detail to reproduce their analysis and results.
  • Failing to explain the many contradictory results using the same or similar data (Trenberth, Chung, Murphy, and Dessler).
  • Treating clouds as an internal initiator of climate change, as opposed to treating cloud changes solely as a climate feedback (as most climate scientists do) without any real justification for doing so. 

As a result of these fundamental problems, PNAS rejected the paper, which Lindzen and Choi subsequently got published in a rather obscure Korean journal, the Asia-Pacific Journal of Atmospheric Science. 

Wholly Debunked

A full understanding of climate requires we take into account the full body of evidence. In the case of climate sensitivity and satellite data, it requires a global dataset, not just the tropics. Stepping back to take a broader view, a single paper must also be seen in the context of the full body of peer-reviewed research. A multitude of papers looking at different periods in Earth's history independently and empirically converge on a consistent answer - climate sensitivity is around 3°C implying net positive feedback.

Last updated on 6 July 2012 by dana1981. View Archives

Printable Version  |  Offline PDF Version  |  Link to this page

Argument Feedback

Please use this form to let us know about suggested updates to this rebuttal.

Further viewing

Andrew Dessler explains in relatively simple and short terms the results from his 2011 paper:

Comments

Prev  1  2  3  4  5  6  7  8  9  10  11  12  13  14  15  16  17  Next

Comments 226 to 250 out of 421:

  1. RW1, I think your new argument in this thread "I was under the impression that you and everyone else here knows that the climate doesn't do anything but change" is not going to go over too well. For starters there are several threads and hundreds of posts that discuss that topic and rebuttals. If you didn't intend to propose that as a new argument, then you probably need to be more specific. I have done that same thing in the past and probably will do it again by responding to what may seem like a tangent to me, but isn't.
    Response: Thanks for helping keep the discussion on topic! For this particular one, how about everybody go to "Climate’s changed before."
  2. Eric (RE: 226), No, I didn't intend it to be a "new" argument. To me, it is such an obvious given. You mean people actually think the climate over hundred years scales is/was mostly a straight line? At any rate, I want to respond to Chris's #222. For some reason, people aren't understanding the argument I'm making. For one they are mixing up and/or intertwining the perihelion/aphelion with seasonal changes.
  3. RW1, the peri/ap forcing change can't be separated from the seasonal response. The seasonal earth tilt difference causes the extra forcing to be absorbed by the extra SH heat capacity (as chris said in 222). The assumption of constant gain across seasons would only be true if the heat capacity were constant across seasons.
  4. Eric, I'm going to try to explain the whole thing from a different angle, as people still don't understand what the gain represents. The peri/ap forcing change is completely separate from the seasonal hemispherical responses, which are driven by the earth's tilt and have nothing to do with the distance the earth is from the Sun. The gain I've refered to is the global gain - not the hemispherical gain. 2xCO2 forcing is global - not hemispherical.
  5. Eric, Also, the peri/ap is a global effect just like 2xCO2. The only reason I've separated hemispherical/seasonal from global is in regards to ocean heat content and any potential delay or inertia, etc., which the seasonal changes contradict as something taking decades to occur.
  6. I think the best approach is to take it step by step one question at a time.
  7. Question #1: Do we all agree that power from the Sun is "forcing" the climate?
  8. ~Changes~ in solar irradiance are a forcing. If you are making the claim that the Sun is currently providing a positive forcing, please continue at argument #1 linked from the top of the left column.
  9. Bibliovermis (RE: 233), I'm not talking about any changes at this point. I'm just trying to first establish that energy emitted from the Sun that travels through space and comes into contacct with the Earth is "forcing" the climate. Is that clearer?
  10. Re: rw1 (234) If energy from the sun is not changing, then there is no solar forcing, by definition. The Yooper
  11. RW1, A "forcing" is by definition something that changes the climate, so no, we do not agree that the sun is currently forcing the climate.
  12. Changes in irradiance are the forcing agent; solar activity, orbital parameters, etc. A constant provides no forcing. Yes, that value is always changing. The long-term trend (at least greater than the ~11 year solar cycle) is what is important.
  13. Daniel, e, and Bibliorvermis, So you are saying the power from the Sun coming in contact with the Earth is having zero effect on the climate system - meaning if the power from the Sun suddenly stopped, the climate would remain exactly as is?
  14. What part of change do you not understand? The sudden cessation of solar activity definitely qualifies as a change.
  15. Rw1, No we are saying you are misunderstanding the definition of forcing. If all you are trying to say is that the sun contributes energy to the climate, then ok yes it does, but that does not make it a "forcing".
  16. How does that not make it a forcing? I didn't say a change in forcing - just a forcing. I think you're confusing the two.
  17. climate forcing
  18. Change is forcing.
  19. My, my - things are much worse that I thought. If we cannot agree that power from the Sun is forcing the climate system, then we are at an impasse. No wonder no one understands anything I've put forth. :(
  20. Bibliovermis, The sudden cessation of solar activity definitely qualifies as a change. This, by definition, makes the power from the Sun a forcing of the climate system.
  21. Rw1, Words have meanings. If you can't understand the definition of something as basic as "forcing", then how can you possibly claim any understanding of the complexities of climate science? One more time: the definition of climate forcing is something that is changing the climate. The sun has the potential to act as a forcing, but that is not the same as saying it is a forcing at present.
  22. RW1, it is you who does not understand the terminology, specifically what is (and what isn't) a forcing. The temperature of the Earth (or the climate, if you will) is merely the sum of all inputs, some positive and some negative. Energy from the sun is one such input. If inputs are stable and there is no change, then the system is in dynamic equilibrium. Changes in inputs, positive or negative, are characterized as "forcings". Therefore forcings represent a change in the dynamic equilibrium of the Earth's energy system/climate. Constant inputs, by definition, have no forcings attached to them. It really is that simple. The Yooper
  23. #225: "roughly 0.6 C sensitivity is at least as consistent with a 0.8 C rise so far," Incorrect, as shown here. That was 190 comments ago; continuing to deny/ignore the problems inherent in your hypothesis does little other than bloat this thread. As you can see from the patient explanations given above, 'forcing' has with it an inherent rate of change. Your calculated 0.6C per doubling of CO2 will neither match the current temperature change nor the rate of change of temperature change. If a model cannot match behavior that is already observed, it's time for a different model. But of course, the ready comeback will be 'it could be due to something else.' What then is the value of a model that requires an unknown or undocumented 'something else' to explain observed behavior?
  24. The energy from the Sun is not a forcing agent, while a change in the rate of energy flow is. Do you understand the distinction?
  25. RW1, my and your use of the term "forcing" is different from the others following us. Their definition excludes cyclical forcing like the solar aphelion to perihelion change. Regardless, as I showed in 208 the "gain" term in the paper in #150 does not use the aphelion to perihelion cycle. The gain is simply the solar power that makes it into the earth/atmosphere divided by the surface flux determine from surface temperature. The cyclical solar change is not considered in calculating gain. To put it another way, the gain is not being used to calculate earth's response to the solar change that you and I call forcing. Thus, even using our definition, the gain is not applicable to CO2 forcing or any other forcing other than the average annual solar input.

Prev  1  2  3  4  5  6  7  8  9  10  11  12  13  14  15  16  17  Next

Post a Comment

Political, off-topic or ad hominem comments will be deleted. Comments Policy...

You need to be logged in to post a comment. Login via the left margin or if you're new, register here.

Link to this page


The Consensus Project Website

THE ESCALATOR

(free to republish)


© Copyright 2024 John Cook
Home | Translations | About Us | Privacy | Contact Us