Climate Science Glossary

Term Lookup

Enter a term in the search box to find its definition.

Settings

Use the controls in the far right panel to increase or decrease the number of terms automatically displayed (or to completely turn that feature off).

Term Lookup

Settings


All IPCC definitions taken from Climate Change 2007: The Physical Science Basis. Working Group I Contribution to the Fourth Assessment Report of the Intergovernmental Panel on Climate Change, Annex I, Glossary, pp. 941-954. Cambridge University Press.

Home Arguments Software Resources Comments The Consensus Project Translations About Support

Bluesky Facebook LinkedIn Mastodon MeWe

Twitter YouTube RSS Posts RSS Comments Email Subscribe


Climate's changed before
It's the sun
It's not bad
There is no consensus
It's cooling
Models are unreliable
Temp record is unreliable
Animals and plants can adapt
It hasn't warmed since 1998
Antarctica is gaining ice
View All Arguments...


Username
Password
New? Register here
Forgot your password?

Latest Posts

Archives

Working out climate sensitivity from satellite measurements

What the science says...

Lindzen's analysis has several flaws, such as only looking at data in the tropics. A number of independent studies using near-global satellite data find positive feedback and high climate sensitivity.

Climate Myth...

Lindzen and Choi find low climate sensitivity

Climate feedbacks are estimated from fluctuations in the outgoing radiation budget from the latest version of Earth Radiation Budget Experiment (ERBE) nonscanner data. It appears, for the entire tropics, the observed outgoing radiation fluxes increase with the increase in sea surface temperatures (SSTs). The observed behavior of radiation fluxes implies negative feedback processes associated with relatively low climate sensitivity. This is the opposite of the behavior of 11 atmospheric models forced by the same SSTs. (Lindzen & Choi 2009)

Climate sensitivity is a measure of how much our climate responds to an energy imbalance. The most common definition is the change in global temperature if the amount of atmospheric CO2 was doubled. If there were no feedbacks, climate sensitivity would be around 1°C. But we know there are a number of feedbacks, both positive and negative. So how do we determine the net feedback? An empirical solution is to observe how our climate responds to temperature change. We have satellite measurements of the radiation budget and surface measurements of temperature. Putting the two together should give us an indication of net feedback.

One paper that attempts to do this is On the determination of climate feedbacks from ERBE data (Lindzen & Choi 2009). It looks at sea surface temperature in the tropics (20° South to 20° North) from 1986 to 2000. Specifically, it looked at periods where the change in temperature was greater than 0.2°C, marked by red and blue colors (Figure 1).
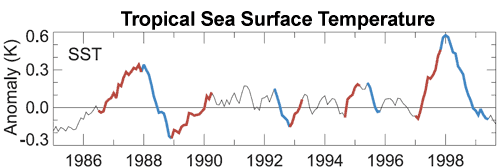

Figure 1: Monthly sea surface temperature for 20° South to 20° North. Periods of temperature change greater than 0.2°C marked by red and blue (Lindzen & Choi 2009).

Lindzen et al also analysed satellite measurements of outgoing radiation over these periods. As short-term tropical sea surface temperatures are largely driven by the El Nino Southern Oscillation, the change in outward radiation offers an insight into how climate responds to changing temperature. Their analysis found that when it gets warmer, there was more outgoing radiation escaping to space. They concluded that net feedback is negative and our planet has a low climate sensitivity of about 0.5°C.

Debunked by Trenberth

However, a response to this paper, Relationships between tropical sea surface temperature and top-of-atmosphere radiation (Trenberth et al 2010) revealed a number of flaws in Lindzen's analysis. It turns out the low climate sensitivity result is heavily dependent on the choice of start and end points in the periods they analyse. Small changes in their choice of dates entirely change the result. Essentially, one could tweak the start and end points to obtain any feedback one wishes.
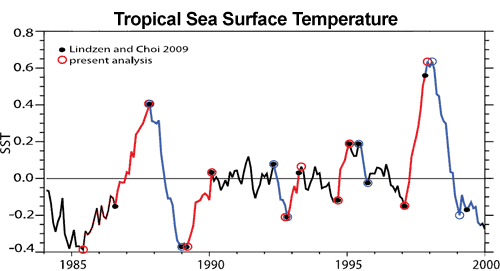

Figure 2: Warming (red) and cooling (blue) intervals of tropical SST (20°N – 20°S) used by Lindzen & Choi (2009) (solid circles) and an alternative selection proposed derived from an objective approach (open circles) (Trenberth et al 2010).

Debunked by Murphy

Another major flaw in Lindzen's analysis is that they attempt to calculate global climate sensitivity from tropical data. The tropics are not a closed system - a great deal of energy is exchanged between the tropics and subtropics. To properly calculate global climate sensitivity, global observations are required.

This is confirmed by another paper published in early May (Murphy 2010). This paper finds that small changes in the heat transport between the tropics and subtropics can swamp the tropical signal. They conclude that climate sensitivity must be calculated from global data.

Debunked by Chung

In addition, another paper reproduced the analysis from Lindzen & Choi (2009) and compared it to results using near-global data (Chung et al 2010). The near-global data find net positive feedback and the authors conclude that the tropical ocean is not an adequate region for determining global climate sensitivity.

Debunked by Dessler

Dessler (2011) found a number of errors in Lindzen and Choi (2009) (slightly revised as Lindzen & Choi (2011)).  First, Lindzen and Choi's mathematical formula  to calculate the Earth's energy budget may violate the laws of thermodynamics - allowing for the impossible situation where ocean warming is able to cause ocean warming.  Secondly, Dessler finds that the heating of the climate system through ocean heat transport is approximately 20 times larger than the change in top of the atmosphere (TOA) energy flux due to cloud cover changes.  Lindzen and Choi assumed the ratio was close to 2 - an order of magnitude too small.

Thirdly, Lindzen and Choi plot a time regression of change in TOA energy flux due to cloud cover changes vs. sea surface temperature changes.  They find larger negative slopes in their regression when cloud changes happen before surface temperature changes, vs. positive slopes when temperature changes happen first, and thus conclude that clouds must be causing global warming.

However, Dessler also plots climate model results and finds that they also simulate negative time regression slopes when cloud changes lead temperature changes.  Crucially, sea surface temperatures are specified by the models.  This means that in these models, clouds respond to sea surface temperature changes, but not vice-versa.  This suggests that the lagged result first found by Lindzen and Choi is actually a result of variations in atmospheric circulation driven by changes in sea surface temperature, and contrary to Lindzen's claims, is not evidence that clouds are causing climate change, because in the models which successfully replicate the cloud-temperature lag, temperatures cannot be driven by cloud changes.

2011 Repeat

Lindzen and Choi tried to address some of the criticisms of their 2009 paper in a new version which they submitted in 2011 (LC11), after Lindzen himself went as far as to admit that their 2009 paper contained "some stupid mistakes...It was just embarrassing."  However, LC11 did not address most of the main comments and contradictory results from their 2009 paper.

Lindzen and Choi first submitted LC11 to the Proceedings of the National Academy of Sciences (PNAS) after adding some data from the Clouds and the Earth’s Radiant Energy System (CERES).

PNAS editors sent LC11 out to four reviewers, who provided comments available here.  Two of the reviewers were selected by Lindzen, and two others by the PNAS Board.  All four reviewers were unanimous that while the subject matter of the paper was of sufficient general interest to warrant publication in PNAS, the paper was not of suitable quality, and its conclusions were not justified.  Only one of the four reviewers felt that the procedures in the paper were adequately described. 

As PNAS Reviewer 1 commented,

"The paper is based on...basic untested and fundamentally flawed assumptions about global climate sensitivity"

These remaining flaws in LC11 included:

  • Assuming that that correlations observed in the tropics reflect global climate feedbacks.
  • Focusing on short-term local tropical changes which might not be representative of equilibrium climate sensitivity, because for example the albedo feedback from melting ice at the poles is obviously not reflected in the tropics.
  • Inadequately explaining methodology in the paper in sufficient detail to reproduce their analysis and results.
  • Failing to explain the many contradictory results using the same or similar data (Trenberth, Chung, Murphy, and Dessler).
  • Treating clouds as an internal initiator of climate change, as opposed to treating cloud changes solely as a climate feedback (as most climate scientists do) without any real justification for doing so. 

As a result of these fundamental problems, PNAS rejected the paper, which Lindzen and Choi subsequently got published in a rather obscure Korean journal, the Asia-Pacific Journal of Atmospheric Science. 

Wholly Debunked

A full understanding of climate requires we take into account the full body of evidence. In the case of climate sensitivity and satellite data, it requires a global dataset, not just the tropics. Stepping back to take a broader view, a single paper must also be seen in the context of the full body of peer-reviewed research. A multitude of papers looking at different periods in Earth's history independently and empirically converge on a consistent answer - climate sensitivity is around 3°C implying net positive feedback.

Last updated on 6 July 2012 by dana1981. View Archives

Printable Version  |  Offline PDF Version  |  Link to this page

Argument Feedback

Please use this form to let us know about suggested updates to this rebuttal.

Further viewing

Andrew Dessler explains in relatively simple and short terms the results from his 2011 paper:

Comments

Prev  1  2  3  4  5  6  7  8  Next

Comments 126 to 150 out of 199:

  1. scaddenp (RE: Post 124), The 3.7 W/m^2 is the correct amount of increase in radiative forcing from a doubling of CO2 in the context your describing, but it's assuming all of the absorbed 3.7 W/m^2 affects the surface - meaning all of it is re-radiated downward, instead of only half. In order for half to be 3.7 W/m^2, the total absorbed power would need to be 7.4 W/m^2, which it isn't. They've gotten away with this because technically all the absorbed 3.7 W/m^2 of power is "radiatively forced" - it's just that about half of it happens to be "forced" in the same in the same direction it was already going - up out to space. Also, if they assume all of the power affects the surface, they can get more warming.
  2. RW1, you already answered my question in #5: "The average incident solar energy is about 340 W/m^2. If you subtract the effect of the earth’s albedo (about 30% or 0.3 = 102 W/m^2), you get a net incident solar energy of about 238 W/m^2 (340 – 102 = 238)." That matches the Trenberth diagram. Now I am ready to try to understand the meaning and ramifications of the "gain" of 1.6 (390 / 238). Unfortunately it is also bedtime, so I will look at that tomorrow
  3. Eric (RE: Post 125), I think Trenberth is just starting with an average surface temperature of 289K rather than my 288K. I was also using an average solar input of 340 W/m^2 - Trenberth using 341 W/m^2. My 238 W/m^2 is derived by subtracting out an albedo of 0.3, which equals 102 W/m^2 (340 x 0.3 = 102; 340 - 102 = 238 W/m^2). Trenberth is also showing 102 W/m^2 reflected (23 off the surface, the other 79 off the clouds). Many have said Trenberth's diagram is confusing because he doesn't separate out clear sky from cloudy sky, which behave quite differently from one another. Also, some of the incoming energy not reflected off of clouds is absorbed by the clouds and some makes it through to the surface. What exactly Trenberth is referring to with the 78 W/m^2 being absorbed by the atmosphere is unclear. I think a lot of his numbers are being determined ad hoc. This isn't hard to do because the the surface power is known from average surface temperature, and outgoing power is known from the effective temperature of the earth of about 255K as seen from space. With these two knowns, many theoretical energy flow models can be derived.
  4. Eric (RE: Post 127), Yeah, I tried to lay out everything as detailed as I could in post 5.
  5. #126: "it's just that about half of it happens to be "forced" in the same in the same direction it was already going - up out to space." You have said a number of times that your calculations require cutting the radiative forcing in half because of this lost to space idea. I'm genuinely curious to know where that concept originated. Let's try a 'thought experiment'. Suppose a quantity of IR photons are on their way up from the warm ground. Some of these photons get absorbed by GHGs. Reradiation takes place and exactly 50% go downwards and 50% go upwards. In this thought-world, there are only either upgoing or downgoing, no 'tweeners'. Of the ones that go downwards, if your mechanism is correct, they return to the ground and are no longer part of this experiment. If your mechanism is correct, the remainder are gone. But let's look at the future of the photons that continue upwards upon re-radiation. Is it not possible for a 2nd absorption to occur, as these up-going photons meet other GHGs? If so, we repeat the partitioning into half down (and they are no longer part of this experiment), half up. These upgoers meet more GHGs and are again reabsorbed/reradiated. Why can this process not continue many, many times? Let's call the probability of any one photon being absorbed in a single stage of this cycle P. If N0 photons start up, after the first 'stop', there are N1 = (1 - P)N0 + 0.5PN0 still going up -- all of the ones that didn't get absorbed plus half of those that did. We can calculate the total number of ups left after a large number of iterations. For P=0.01, it takes just over 900 iterations to reduce the number of upgoing photons to 1% of the initial quantity. With P=0.001, it takes just over 9000 iterations. And in our thought-world, you're either going up or going down. So 99% of the original amount are returning to the ground. Now I have no idea what a reasonable value for P should be, nor do I know if there should be a max number of iterations, nor do I expect this 50/50 scenario to resemble reality. In addition, we should calculate the fate of the downgoing photons from each iteration using the same rules. But I'm not ready to do that until you agree that your single shot, 50% Lost-In-Space idea doesn't resemble reality either.
  6. RW1 - Your bookkeeping is off. 3.7W/m^2 is the forcing from doubling CO2 at TOA, not the surface effect. That TOA number already includes all internal re-radiation. You've been told this repeatedly - I don't know why you keep insisting on half that forcing not having an effect; you are consistently (and in an unsupportable fashion) underestimating the CO2 effect by half, and you are consistently incorrect. The '1.6 gain' for solar inputs is also you have mentioned is something I don't understand - the reaction to forcings is specifically describing equivalent inputs to the Earth energy balance, and there is no 1.6 factor anywhere I know of. Hence much of your #5 post here does not follow. As to Trenberth 2009 (you seem to be using numbers from an earlier version, but they aren't all that different), Trenberth puts quite a lot of effort into estimating the various components. If you feel he has not estimated one of the energy vectors correctly, please point out which one(s), with some evidence to back your claim(s). Preferably backed by some papers indicating why.
  7. muoncounter (RE: Post 130), Actually, the re-radiation from GHGs is in all directions (half goes more upward, half goes more downward, some goes more sideways). Only the downward going half can affect the surface. It may seem logical that multiple absorptions on the way up could cause more than half the power to affect the surface, but if this is true, it also would mean that multiple absorptions on the way down could cause half to be redirected back up out to space - equally offsetting any redirected back down. Whatever happens exactly, if you run some numbers, the net result shows that it's about half up and half down. For example at a temperature of 288K, the surface emits 390 W/m^2. With a gain of 1.6 at the surface, the amount power absorbed by the atmosphere and sent back toward the surface is 150 W/m^2 (238 W/m^2 from the Sun + 150 W/m^2 from atmosphere = 390 W/m^2 at the surface). To calculate the amount of power absorbed by the atmosphere and directed up out to space, we need to know how much of the surface power passes through the transparent window of the atmosphere totally unabsorbed. If we use Trenberth's 70 W/m^2, we get a total of 320 W/m^2 absorbed by the atmosphere (390 - 70 = 320 W/m^2). 320 W/m^2 total absorbed - 150 W/m^2 directed downward back toward the surface = 170 W/m^2 upward out to space, which using Trenberth's numbers at least, is actually about 53% up and 47% down.
  8. muoncounter (RE: Post 130), I'm sorry, it's actually about 152 W/m^2 absorbed and sent down to the surface - not 150 W/m^2 (238 + 152 = 390 W/m^2). So that makes it 152 W/m^2 down and 168 W/m^2 up or about 52.5% up and 47.5% down (using Trenberth's numbers at least).
  9. @RW1: "I think VeryTallGuy can respond for himself." I'm not responding for VTG, I'm commenting on your poor appraisal of his knowledge - considering he actually understands the science, and you clearly don't. As others have said, the 4 W/m^2 already considers the omnidirectional emissions of CO2. You keep ignoring it, as well as the very strong rebuttals to your strange theories. When someone keeps repeating the same thing over and over again and ignoring rebuttals, it's a clear sign that they've lost the argument, and are only keeping at it to either save face or waste everyone's time. You've stated your opinion, many times. People have presented their counter-arguments. What do you say we let posterity decide who is right, and who is wrong? Anyway, it's not as if your approximate grasp of the matter is going to convince anyone here...
  10. No, RW1, you are incorrect that "multiple absorptions on the way down could cause half to be redirected back up out to space - equally offsetting any redirected back down." That's because: (1) The source of the radiation being absorbed is below the absorbing GHGs (on the surface). So there are far more GHG molecules to intercept radiation on its way up, than radiation on its way down. (2) Energy absorbed as radiation by GHGs mostly is transformed into kinetic energy by conduction with other molecules, most of which don't radiate that acquired energy. So much of the intercepted radiation's energy is removed from the radiation-to-space pathway, instead contributing to temperature rise of the gases.
  11. In my example above, power in = power out. 168 W/m^2 absorbed and radiated upward out to space + 70 W/m^2 passing through the transparent window unabsorbed out to space = 238 W/m^2 leaving & 238 W/m^2 arriving.
  12. RW1 @119 I'm afraid my life is too short, but also the answer is too simple. I've pointed out on several posts (as have others eg KR@131) that 3.7 W/m2 is the top of the atmosphere number. You keep on trying to halve it by claiming that it is something else. It's not. 3.7 is the total increased heat absorbed by the earth's system for a doubling of CO2 - the net reduction in radiation to space. Absorption and re-emission through the atmosphere are inherent in the calculation which is done stepwise through the atmosphere. If you want to calculate the surface budget associated, feel free. Also, you asked for a response to your original question. I tried directly to do that @112 - even with the very conservative figures I put in there you can see that the energy change from CO2 is bigger than your figures for orbital eccentricity within 2 years. And you still haven't provided any reference for your numbers on orbital forcing, unless I missed them. Please do?
  13. " but it's assuming all of the absorbed 3.7 W/m^2 affects the surface - meaning all of it is re-radiated downward, instead of only half. " As others have pointed out, this is not true. The calculation used to arrive at 3.7W/m2 assume nothing of the kind and physically the situation is different. The number cannot not be used in the way you describe. See the definition in 2nd IPCC report. Essentially the same set of equations are used to calculate the added energy flux at the surface due to increased but its different no. From memory its about 3.5W/m2 for current GHG emissions since pre-industrial but I dont know the figure for doubling.
  14. RW1 (#132), thanks for explaining your numbers again. What doesn't seem to match Trenberth is the 80W/m^2 lost by evaporation (cooling) at the surface (plus another 17 for thermals). In your budget you only consider the energy radiated from the surface. Can you adjust your budget account for evaporation and thermals? Also like KR in 131 I am a little unclear on what you mean by "gain". You are saying that a certain amount of solar energy makes it to the atmosphere and surface (in Trenberth it is 341-79-23 which is about the same as your #'s) Then we measure the earth at 288K and calculate 390W emitted. You then define gain as the ratio of the solar energy caught in the earth/atmosphere (ok...) divided by surface radiation (doesn't make sense). Seems to me like you are comparing two fundamentally different numbers.
  15. From the invariably excellent Science of Doom the 3.7 W/m2 is defined:
    "The change in net (down minus up) irradiance (solar plus longwave; in W/m2) at the tropopause after allowing for stratospheric temperatures to readjust to radiative equilibrium, but with surface and tropospheric temperatures and state held fixed at the unperturbed values."
    Note
    "the stratospheric adjustment is minor"
    so it's essentially the same as a top of atmosphere calc. Interestingly as noted in their post, applying this to the surface temperature does NOT seem to result in the 1.2 degrees warming: From the Trenberth link above: 1) radiative flux at the surface = 396W/m2 - equates to 289.09K blackbody temperature 2) Add 3.7 to that raises temperature to 289.76, so 0.65 degC temperature rise. 3) In order to get a 1.2 degC rise at the surface you need a heat flux increase to 402.6W/m2, so 6.6W/m2 at the surface. I'm not exactly sure how that calc is done to translate 3.7W/m2 TOA to 6.6 at surface, although you'd expect it to be larger so it seems about right. I can't find a reference for this calc - can anyone help? Are my sums right?
  16. VeryTallGuy when you increase emission at the surface by increasing surface temperature you won't get the same excess energy leaving the planet at TOA, part of it will be absorbed by the atmosphere. To balance a forcing at TOA you need a larger temperature increase then predicted by this simple calculations. Basically, this is the same mistake made by RW1 before.
  17. Eric (RE: Post 139), Trenberth is just listing evaporation and thermals for reference purposes - neither actually contributes to the radiative budget and/or balance. It's just one more confusing and ambiguous component of that diagram. BTW, if you don't believe me or want to check yourself, run all the numbers he lists - the 80 W/m^2 for evaporation and 17 W/m^2 aren't included in the total radiative flows to achieve power in = power out.
  18. VeryTallGuy (RE: Post 137), Let's take this step by step: 3.7 W/m^2 is the total absorbed or captured power for a doubling of CO2, correct? If not correct, then your saying the total absorbed power is 7.4 W/m^2? Some other amount? I've read much of the IPCC reports and I've been studying this issue for quite a while now - nowhere have I seen that the total captured power from a doubling of CO2 is 7.4 W/m^2 for a net 3.7 W/m^2 because only half of the absorbed power goes down. Where and in what way specifically does the IPCC, or any other climate research paper or document, say this? Also, what you are describing above regarding the 4 W/m^2 increase at the TOA is the total amount of increased radiation to space that will occur to achieve equilibrium, assuming there is 4 W/m^2 increase in power at the surface. However, that is only possible if all the absorbed 4 W/m^2 of power is directed toward the surface instead of only half. If it's only half, the "net change in power emitted at the top of the atmosphere" would only be 2 W/m^2. What I'm getting at is the question boils down to what the total absorbed power is. Again, you're saying the total absorbed is about 8 W/m^2 for net of 4 W/m^2 because only half can affect the surface, correct? My orbital forcing reference is from Wikipedia, which I checked against a few other sources. According to them the range is 1,413 – 1,321 W/m^2 perihelion-aphelion. Divide by 4 to get the average, which is a little over 20 W/m^2 (actually 23). Subtract the Earth's albedo of about 0.3 and it's a net increase of 14 W/m^2 at perihelion. Also, I didn't say or imply there was an average increase in radiative forcing from orbital eccentricity. As stated before, I'm well aware that the increase from CO2 is on top of the current average total.
  19. RW1, thanks for the reply. Ignoring evaporational cooling for now, I think what you were trying to say in #61 is that a particular amount of solar energy absorbed in the atmosphere and on the surface (238 W/m^2) turns into 390 W/m^2 of surface radiation or a "gain" of 1.6 You then stated 1) that an increased radiative forcing in the system (atmosphere plus surface) would produce the same ratio of surface radiative increase (i.e. the gain again). And 2) the 3C rise in temperature postulated for the doubling of CO2 would produce a 12 W/m^2 increase in surface radiation by applying S-B to the delta T. And 3) 12 divided by 1.6 is too large for CO2 to produce. Statement (2) seems correct. But (1) means that the gain is always the same whether dealing with the full amount of solar forcing or a delta in solar forcing or a delta in CO2 forcing. I definitely agree that the "gain" should be the same whether for a delta in solar or a comparable delta in CO2. But gain is probably not a constant over the range of solar forcing. The "3C" proponents would have to show that gain is larger at the pre-industrial equilibrium than over the entirety of solar forcing, and I don't think it's hard to argue that gain is nonlinear with warming since water vapor is highly nonlinear. With a larger gain, they can argue that the relationship in (3) holds. In fact your analysis brings to mind a similar problem I have with the paleo sensitivity analysis. There is an assumption that the temperature to CO2 relationship in going from a frozen planet to unfrozen is the same as from unfrozen to slightly warmer unfrozen. Both your analysis and paleo one here detailed-look-at-climate-sensitivity.html seem to use the same basic but faulty assumption that forcing-to-temperature elationships over colder ranges of climate are applicable to warmer ones.
  20. Eric (RE: Post 144), The amount of power from the Sun that hits the surface and is re-radiated as LW infrared is about 238 W/m^2. However, the total power at the surface is 390 W/m^2 - not 238 W/m^2, because GHGs and/or clouds are absorbing and re-radiating some of that 238 W/m^2 back toward the surface, which in effect, is delaying or slowing down the release of the 238 W/m^2, causing the surface to be warmer than it would be; or causing the surface power flux to be 390 W/m^2 instead of 238 W/m^2. The gain represents the increase in surface power or increase in surface temperature as a result of there being GHGs and clouds in the atmosphere. In effect, the gain factor of 1.6 means that due to the greenhouse effect, it takes about 1.6 W/m^2 of power at the surface for each 1 W/m^2 of power to leave the system, offsetting each 1 W/m^2 entering the system from the Sun.
  21. "3.7 W/m^2 is the total absorbed or captured power for a doubling of CO2, correct?" NO! It is not. 3.7W/m2 is the equivalent radiative forcing you would get from double CO2. eg. Doubling CO2 would give you the same impact say a solar forcing of 3.7W/m2. This confusion and insistence on halving it is getting in the way. All of the absorption, re-emission in all directions, re-absorption etc etc has to be done in the complex RTE codes. (eg you can find a MODTRAN calculator here). Net result is an intensity out which is used to calculate the radiative forcing. "power" is also a slightly confusing term to use - usually used in context of energy conversion. Here we are talking about an energy flux.
  22. Eric, @Eric 144: "You then stated 1) that an increased radiative forcing in the system (atmosphere plus surface) would produce the same ratio of surface radiative increase (i.e. the gain again). And 2) the 3C rise in temperature postulated for the doubling of CO2 would produce a 12 W/m^2 increase in surface radiation by applying S-B to the delta T. And 3) 12 divided by 1.6 is too large for CO2 to produce." No, not quite. I'm saying the 3 C rise requires an increase in surface power of 16 W/m^2 for a gain of 8 (8 x 2 W/m^2 = 16 W/m^2), which is 5 times the 3.2 W/m^2 increase in the surface power from each 2 W/m^2 coming in from the Sun. The AGW theory of a 3 C rise in temperature requires the system to respond to each 1 W/m^2 of power from increased CO2 5 times more powerfully than each 1 W/m^2 of power coming in from the Sun.
  23. RW1, the sun, measured by TSI changes in the historical measurements and proxies, increased by about 0.5 W/m^2 from the depths of the Little Ice Age to about 1900, see fig. 1 in A-detailed-look-at-the-Little-Ice-Age.html The temperature increase, which also involved other factors, was at least 0.5C, maybe more like 1C. With no other factors considered the "gain" is something like 2.5 to 5W/m^2 divided by 0.5 which is 5 to 10, rather than 1.6 The problem, I believe, is you are calculating gain with full solar input (zero to current day) which will yield a much smaller result than a delta of solar input as I demonstrated, albeit crudely, using the LIA.
  24. Eric, Getting back to the perihelion point, here it is from a different angle: Let's say the total average incident solar power increases from 340 W/m^2 to 343 W/m^2 as a result of the earth's orbit moving closer to perihelion. This results in a new, higher net incident solar energy of 240 W/m^2 (343 x 0.3 albedo = 103, 343 -103 = 240), which is an increase in radiative forcing of 2 W/m^2 (240 W/m^2 - 238 W/m^2 = 2 W/m^2) - the same as from a doubling of CO2. If according to the AGW theory, the system's response will be to greatly amplify the additional 2 W/m^2 from CO2 to about 16 W/m^2 via large positive feedbacks, why doesn't the system do it with the same 2 W/m^2 increase in radiative forcing from from the Sun? The observed temperature changes are nothing anywhere near 3 degrees C for this additional 2 W/m^2 of solar power. Even better, let's take the last 3 W/m^2 increase that occurs at peak perihelion (347 W/m^2 to 350 W/m^2 for a net of 2 W/m^2 albedo adjusted). The system doesn't respond by amplifying that last 2 W/m^2 8 fold, but somehow it's all of the sudden going amplify the next 2 W/m^2 from C02 8 fold? Again, does it make physical and/or logical sense that the system is somehow all the sudden going to treat such a small increase radically differently than it does both the last 0.5 percent and the original 99+ percent?
  25. Eric, Check out this more detailed explanation and satellite analysis of these things by physicist/climatologist and originator George White: http://www.palisad.com/co2/eb/eb.html I've never seen the information and analysis he presents here refuted anywhere, and I've seen many try and fail totally. It's the single most damning piece of evidence against AGW that I've ever seen. I also don't think it's a coincidence that G. White's sensitivity estimate is about the same as what Lindzen and Choi are getting - albeit via somewhat different methodology.

Prev  1  2  3  4  5  6  7  8  Next

Post a Comment

Political, off-topic or ad hominem comments will be deleted. Comments Policy...

You need to be logged in to post a comment. Login via the left margin or if you're new, register here.

Link to this page


The Consensus Project Website

THE ESCALATOR

(free to republish)


© Copyright 2024 John Cook
Home | Translations | About Us | Privacy | Contact Us