What does the full body of evidence tell us about humidity?
What the science says...
To claim that humidity is decreasing requires you ignore a multitude of independent reanalyses that all show increasing humidity. It requires you accept a flawed reanalysis that even its own authors express caution about. It fails to explain how we can have short-term positive feedback and long-term negative feedback. In short, to insist that humidity is decreasing is to neglect the full body of evidence.
Climate Myth...
Humidity is falling
"...the largest of all the positive or temperature-amplifying feedbacks in the UN’s arsenal is the water-vapor feedback. The UN gets this feedback wrong in numerous fundamental ways. For instance, its models tend to treat column absolute humidity as being uniform at all altitudes, when in fact – as Paltridge et al. (2009) have demonstrated recently – the upper troposphere (the only place where adding CO2 to the atmosphere could make any difference to temperature) is considerably drier than the models are tuned to expect." (Christopher Monckton)
Water vapor provides the most powerful feedback in the climate system. When surface temperature warms, this leads to an increase in atmospheric humidity. Because water vapor is a greenhouse gas, the increase in humidity causes additional warming. This positive feedback has the capacity to double the initial surface warming. So when temperatures rise, we expect humidity to also increase. However, one study using weather balloon measurements found decreasing humidity (Paltridge et al. 2009). To get to the truth of the matter, the full body of evidence regarding humidity is perused in a new paper Trends in tropospheric humidity from reanalysis systems (Dessler & Davis 2010).
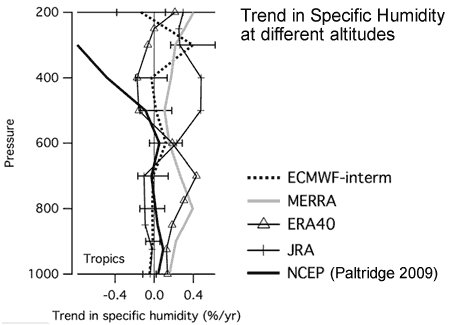
To give an overview of humidity trends, Dessler and David compare the results from Paltridge's 2009 paper to a number of other reanalyses of humidity. Figure 1 shows the trend in specific humidity from 1973 to 2007 over the tropics. The Paltridge reanalysis (thick black line) shows considerable divergence in the upper troposphere, with a strong negative trend while the other reanalyses all give consistent results, both with each other and theoretical expectations.

Figure 1: Various reanalyses showing the trend in specific humidity from 1973 to 2007 in the tropics (Dessler 2010 also looks at the Northern and Southern extra-tropics - only the tropic data is shown here for simplicity and as it shows the greatest contrast between Paltridge 2009 and the other reanalyses).
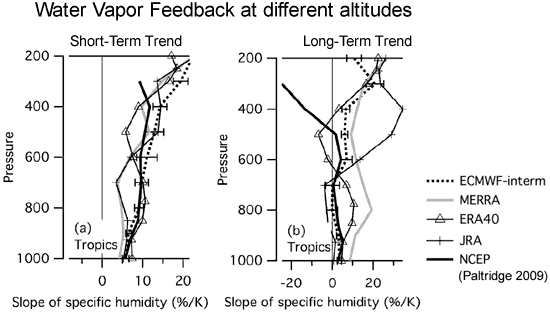
To gain more insight into the nature of the observed water vapor feedback, Dessler and Davis examine the relationship between humidity and surface temperature. They plot specific humidity directly against surface temperature - this gives a measure of the amount of water vapor feedback. They compare the short-term trend in water vapor feedback (under 10 years) to the long-term trend (greater than 10 years) for the 5 different reanalyses:

Figure 2: Short-term (a) and Long-term (b) plots of the slopes of the regression between specific humidity and surface temperature, in the tropics. Trends are divided by the average specific humidity over the entire time period, so they are expressed in percent per degree K.
For the short-term trends, all five reanalyses produce consistent results, with surface warming associated with increasing humidity (eg - positive water vapor feedback). However, there is poorer agreement in the long-term trends. The Paltridge 2009 reanalysis is a distinct outlier, with long-term and short-term trends going in opposite directions, unlike the results from the other studies.
This leads to an interesting question: could water vapor feedback be opposite over short and long-term time scales? There is no theory that can explain how short-term feedback could be positive while long-term feedback is negative. The water vapor response to a climate fluctuation with a time scale of a few years (e.g., ENSO) should be about the same as for long-term warming.
Long-term positive feedback is confirmed by several independent sources. An analysis of long-term measurements of upper tropospheric water vapor shows a positive water vapor feedback in 22 years of satellite data (Soden et al. 2005). In addition, analysis of long-term paleoclimate records is also inconsistent with a negative long-term water vapor feedback (Köhler et al 2010).
So why does Paltridge 2009 show decreasing humidity? The authors of Paltridge 2009 themselves point out the well-documented problems with radiosonde humidity observations in the upper troposphere. Comparisons of Paltridge 2009 with satellite measurements (NASA’s Atmospheric Infrared Sounder - AIRS) find the Paltridge 2009 reanalysis has large biases in specific humidity in the tropical upper troposphere. Additionally, Paltridge 2009 doesn't show any large increase in specific humidity during the 1998 El Niño. Direct measurements indicate the tropical atmosphere does indeed moisten during El Niño events and such moistening is seen in the other reanalyses.
Two of the newer reanalyses shown in the figures above, MERRA and ECMWF-Interim, correct for well documented biases introduced by changes in the observing system. These newer reanalyses are in better agreement with theory, other reanalyses and independent observations.
To claim that humidity is decreasing requires you ignore a multitude of independent reanalyses, including newer ones with improved algorithms, that all show increasing humidity. It requires you accept a flawed reanalysis that even its own authors express caution about. It fails to explain how we can have short-term positive feedback and long-term negative feedback (indeed there is no known mechanism that can explain it). In short, to insist that humidity is decreasing is to neglect the full body of evidence.
Intermediate rebuttal written by John Cook
Update July 2015:
Here is a related lecture-video from Denial101x - Making Sense of Climate Science Denial
Last updated on 26 October 2016 by pattimer. View Archives


 Arguments


Alerts would be a welcome feature. Am I missing the button?
DrBill @50/51,
You still do not make clear what data you are seeking. Your comments suggest you are likely after Specific Surface Humidity so Total Precipitable Water is likely not helpful. (Note that the measurements for TPW in mm so equal to Kg/sq m and also equal 0.1g/Kg atmosphere.)
As with temperature data, surface humidity data is quickly converted into anomalies. Thus humidity records like HadCRUH would be of no help to you.
The ESRL NCEP Reanalysis Dataset browser does provide humidity in g/kg for different pressures so global surface values can be obtained by setting the Longitude/Latitude. It's where the data plotted here (usually 2 clicks to 'download yourattachment') was sourced.
MA Rodger @52 Not sure how it can be cleared up. There is a total atmosphere mass and volume. There is a total of all water/water vapor in the atmosphere, also at least by mass, and thus convertable to volume. Someone might have divided total water/water vapor by total atmosphere mass and I'd like to find that data.
Well TPW is the total of all water in the atmosphere. However, it is expressed in millimeters normally. Multiply by surface area of earth to get volume and by density to get mass. I am not sure you gain any new information from that that wouldnt get from just looking at TPW. Given the uncertainities in determining TPW, you now add uncertainities measurement of atmospheric mass.
DrBill @53,
If you do want TPW as a proportion of total atmosphere, you'll need to stick with mass and you'll probably not get much improvement on Wikipedia for the mass of the atmosphere, giving 5.15 x 10^15 tonnes. And for the mass of global TPW, Trenberth et al (2007) gives a value of 12,700 cu km or 0.0127 x 10^15 tonnes. There are positive trends in global TPW but these are some 1%/decade so the upward trend is less than the uncertainty in the total.