Climate Science Glossary

Term Lookup

Enter a term in the search box to find its definition.

Settings

Use the controls in the far right panel to increase or decrease the number of terms automatically displayed (or to completely turn that feature off).

Term Lookup

Settings


All IPCC definitions taken from Climate Change 2007: The Physical Science Basis. Working Group I Contribution to the Fourth Assessment Report of the Intergovernmental Panel on Climate Change, Annex I, Glossary, pp. 941-954. Cambridge University Press.

Home Arguments Software Resources Comments The Consensus Project Translations About Support

Bluesky Facebook LinkedIn Mastodon MeWe

Twitter YouTube RSS Posts RSS Comments Email Subscribe


Climate's changed before
It's the sun
It's not bad
There is no consensus
It's cooling
Models are unreliable
Temp record is unreliable
Animals and plants can adapt
It hasn't warmed since 1998
Antarctica is gaining ice
View All Arguments...


Username
Password
New? Register here
Forgot your password?

Latest Posts

Archives

IPCC graph shows accelerating global warming trend

What the science says...

All of the statements made in the IPCC report regarding the figure in question are correct and supported.

Climate Myth...

IPCC graph showing accelerating trends is misleading

"The IPCC’s Fourth Assessment Report, 2007, carries in three places a graph in which the Hadley Center’s global mean surface temperature anomaly dataset from 1850-2005 is displayed with four arbitrarily-chosen trend-lines overlaid upon it. At each place where the altered graph is displayed, the incorrect conclusion is drawn that because trend-lines starting closer to the present have a steeper slope than those starting farther back, the rate of warming is accelerating and that we are to blame." (Christopher Monckton)

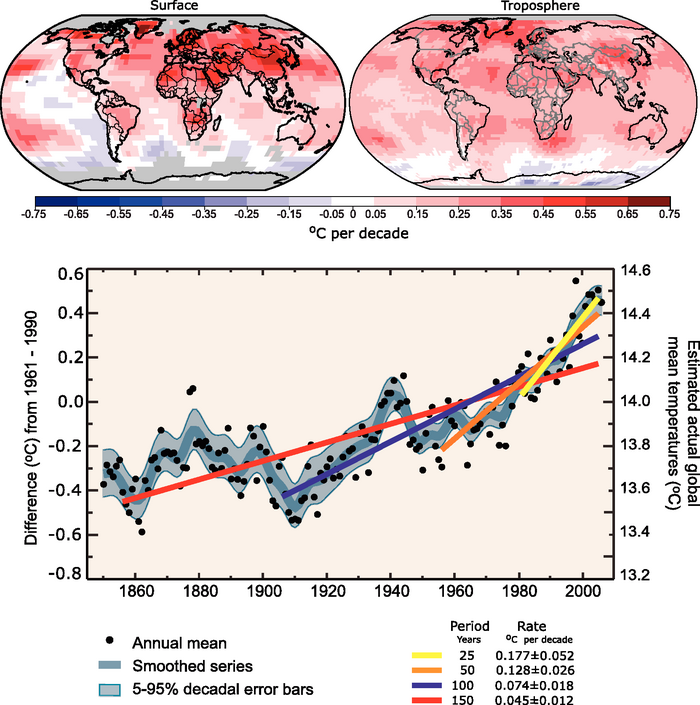
Some 'skeptics', most vocally Christopher Monckton, have taken issue with this figure from the 2007 IPCC report:
IPCC-graphic


Figure 1: Depiction of various long-term global temperature trends in the 2007 IPCC report

The figure is used in FAQ 3.1 and the Technical Summary of Working Group 1Monckton asserts that this graph uses a "fraudulent statistical technique" and

"At each place where the altered graph is displayed, the incorrect conclusion is drawn that because trend-lines starting closer to the present have a steeper slope than those starting farther back, the rate of warming is accelerating and that we are to blame."

This is simply a misrepresentation of the IPCC report.  The IPCC makes the following claims using this figure:

1)  The pace of warming accelerated over the course of the 20th Century. Notice the past tense.  Here is the specific claim (from the caption for Figure 1 of FAQ 3.1, emphasis added):

"Linear trend fits to the last 25 (yellow), 50 (orange), 100 (purple) and 150 years (red) are shown, and correspond to 1981 to 2005, 1956 to 2005, 1906 to 2005, and 1856 to 2005, respectively. Note that for shorter recent periods, the slope is greater, indicating accelerated warming."

2)  That the pace of warming over the last 25 years is greater than that in preceding years on the record.

3)  That the "... global average temperature has increased, especially since 1950."

All of these statements are true.  The IPCC does not state that the rate of warming continues to accelerate, and does not use this figure to claim that humans are to blame for the accelerated warming, although in the FAQ 3.1 figure caption, the IPCC does explain how we know humans are the cause of the acceleration:

"From about 1940 to 1970 the increasing industrialisation following World War II increased pollution in the Northern Hemisphere, contributing to cooling, and increases in carbon dioxide and other greenhouse gases dominate the observed warming after the mid-1970s."

Monckton's claims of a "fraudulent statistical technique" are without merit, and a misrepresentation of the IPCC report's actual content.

Last updated on 9 February 2012 by dana1981. View Archives

Printable Version  |  Offline PDF Version  |  Link to this page

Argument Feedback

Please use this form to let us know about suggested updates to this rebuttal.

Comments

Prev  1  2  3  

Comments 51 to 56 out of 56:

  1. Tom49: This is getting tiring, in message 12 you were saying that error bars didn't matter, now they do. A "consistent picture" is one where there is no "exception, especially when the "consistent picture" is based on N=5 trends. And you can get a very large "relative magnitude in the changes in the slopes", with increasing slopes, with an underlying cooling temperature. Back to the quantitative/qualitative discussion, it's tiring. Muoncounter50 : Let me start by the end : "Do you agree that the rate of warming is accelerating? " On the graph ? Yes. "If so, do you agree that an appropriate description of a graph representing that behavior is 'increasing and concave up'? " Yes, already answered that. Now to the relevant point : "You've agreed that the qunderlying function is increasing and accelerating: that's what is relevant." I've agreed to it because you asked me the question directly. And that's the good way to do it, no need to do that linear trend torturing just find the coefficient in front of the x^2 (if it positive, then you have an acceleration). But the IPCC does not start with that. They start with the linear trends. And those increasing linear trends supposedly indicate an accelerated warming. I say that's wrong, and i've proven it.
  2. To reinforce my points @45 and 49, I note that the difference between the 25 year and 100 year trend in the IPCC example is 0.0103 C per annum. That is nearly double the 95% confidence interval of the 25 year trend, ie, 0.0052 C per annum, and greater than the confidence interval for the trend calculated using the trend calculator of 0.0078 C per annum. In contrast, in Helena's cherry picked example, the difference is 0.0063 C per annum, just barely larger than 95% confidence interval for the 25 years from 1981 to 2005, and less than the interval calculated using the trend calculator. In other words, Helena cannot show a statistically well based inference that the 25 year trend is different from the 100 year trend in her example. Given that, insisting that it should be treated as qualitatively the same as the IPCC example is just bizarre.
  3. Muoncounter, i have a yes/no question (with explanations if you want of course) for you : Forget about Earth, we are on planet SKEPTSCIENCE. A scientist comes to you and tells you that, when he calculates the past 150, 100, 50, and 25yr temperature trends for the planet, he finds that for the shorter recent periods, the slope is greater. Do you understand what he just told you as an indicator that we have an accelerated warming on this planet ? Thanks for your answer
  4. Tom52 : Qualitatively, my linear trends and the IPCC linear trends contain the same qualitative information about the underlying temperature function : NONE. That's the only point i'm making. You can answer my yes/no question on message 53 if you wish.
  5. "my linear trends and the IPCC linear trends" = "my evolution of linear trends and the IPCC evolution linear trends"
  6. Helena @51, if you want to claim that claim (2) from the OP is false, you need to show a 25 year trend earlier than the record that has a statistically significant greater trend. As it happens, you cannot even find one with a greater trend, let alone a statistically significant trend. If instead you want to simply claim that it was unjustified, ie, if you change your claim, then statistical significance becomes important. As it stands, given the available data the IPCC is justified in asserting that "it is more likely than not" that the 25 year trend terminating in 2005 was larger than any other 25 year trend on the instrumental record, both because. They are justified in doing so because the measured trend is in fact larger than any prior trend in the HadCRUT3v data, and because on the GISTEMP and NCDC data, which are more extensive, it is also larger than any prior 25 year trend, and by a larger margin. Your argument against the inference that the warming is accelerating is a claim that the inference is not justified statistically. Therefore you cannot ignore statistical significance. The problem here is not that I am asserting a double standard, but that you will not accept any standard which falsifies your claims, however, well justified those standards are.
  7. Tom56, i've already agreed on the 25yr trend quite some time ago and i had noted that ironically it would be wrong if stated in AR5 as 1987-2011 is quite smaller. "Your argument against the inference that the warming is accelerating is a claim that the inference is not justified statistically. " Great to see that, based on common sense statistics, you agree that point 1 is incorrect i.e. the word "indicate" is wrong as one cannot infer accelerated warming.
  8. ... from greater slopes for shorter recent periods
  9. Helena - "...one cannot infer accelerated warming from greater slopes for shorter recent periods." As I stated earlier, "Shorter terms will certainly have higher variances, but absent an underlying change in rate, randomly selected time periods and lengths would statistically average out to the same trend." If those trend changes are statistically significant, and increasing (and they are both), you can infer acceleration. That's the entire point of looking at statistical significance, to judge whether or not apparent indicators are indeed evidence.
  10. KR : "If those trend changes are statistically significant, and increasing (and they are both), you can infer acceleration." Sorry but this is wrong.
  11. Helena @57 misrepresents my claim, and I believe deliberately so. My stating what her argument is is not the same as my agreeing with her argument, and no reasonable person could expect it to be so.
  12. Tom61, i don't misrepresent any of your claim, but i guess it's easy on a forum to make people think that. Anyway, can you tell me what you think of KR claim that "If those trend changes are statistically significant, and increasing (and they are both), you can infer acceleration." Thanks (that is the same as my yes/no question #53
  13. 62, Helena, Yes, you did. I don't see how it can be read any other way.
  14. Well then let's have Tom answer on the important question (for the n'th time) : can one infer accelerated warming from greater slopes for shorter recent periods (150-10-50-25yr periods like in the IPCC). Tom, yes or no ?
  15. Helena you consistently avoid to address the weaknesses other commenters and I point out. In your last reply to me you end with the trivial fact that long term trends are more constrained than shorter ones. I agree, but it does not mean that they are larger (or smaller for that matter) in any way. It's not a proof of your original claim. On the other hand you still do not see the difference between starting at an old date and going forward from strating today and going backward. I don't want to pile up with other commenters and anyway untill you properly address this point, which is the source of disagreement with us all, the discussion can not move forward. P.S. Let me answer to your question to Tom: can one infer accelerated warming from greater slopes for shorter recent periods (150-10-50-25yr periods like in the IPCC)? The asnwer is yes, the trend has lately accelerated with respect to the secular trend. This is what that graph tells us. Now a hint, applying the same logic to your analysis, what does it tell us?
  16. Helena#53: "we are on planet SKEPTSCIENCE. ... an indicator that we have an accelerated warming on this planet?" I prefer to work on this planet (for the time being). It rained really hard the other night, 2" an hour for a bit. Then the rainfall rate decreased. Over the course of 4 hours, there was 3" of rain. The rate over the entire period was thus 3/4" per hour. The rate in the last half hour was 1/4" per hour. I took these changing trends as an indicator that the rainfall rate was decreasing. In your hypothetical, I assume you refer to trends calculated from time intervals starting progressively closer to the present, as illustrated in the OP's figure 1 and in DB's response here. Let's also stipulate that each of these calculated trends is statistically significant - neither an artifact of any carefully selected time periods nor some artfully constructed noise. Functions that produce statistically meaningful trends that increase over time are far more likely to be increasing and concave up (which we agree is one form of 'accelerating'). Examples: x^2, x^3, etc (for x>0). On the other hand, functions that are increasing and concave down (decelerating) show the opposite behavior: 'older' trends are greater than more recent trends. Examples can be found among trig functions (5-5 Cos[x]), x between 0 and Pi. Add random noise if you like. Let's not devolve this discussion into wrangling over what the word 'indicate' means.
  17. "It's not a proof of your original claim. " It proves that, chosen at random (i.e no cherry picking), it is more likely that the slope of long trends will be smaller that the slope of short trends. Do you agree with that ? "The asnwer is yes" Wrong. You cannot infer accelerated warming from greater slopes for shorter recent periods Muoncounter 66 : Your example for rain is not exactly correct. First, I don't understand how those two sentences "It rained really hard the other night, 2" an hour for a bit. Then the rainfall rate decreased. " fit with the rest. The exercise is correct if you "only know" the various trends, and nothing else. So let me start here : I do not know if it rains after or not. I do not know if it was raining before or not. Here is how i write your exercise "Over the course of 4 hours, there is 3" of rain. The rate over the entire period is thus 3/4" per hour. The rate in the last half hour is 1/4" per hour." You take these changing trends as an indicator that the rainfall rate is decreasing. I'm sorry but i don't see how you can infer a deceleration. Maybe you do that because you already assume that it stopped raining after that, or that it must rain at a constant rate, or because you've lived it, but here you're adding crucial extra information that are not contained in the trend itself ! What if i tell you that it rained (3-1/8)" during the first hour, then it was sunny during 1h and half and then it rained again 1/8 (rate of 1/4" for half an hour). Maybe it's a new cloud coming and it's gonna rain for the next 5 hours. Who knows ? You've been adding the information that it's zero after that, but when you do that you do more than comparing the trends to infer the deceleration.
  18. (The first part is for Ricardo)
  19. Muoncounter "Functions that produce statistically meaningful trends that increase over time are far more likely to be increasing and concave up (which we agree is one form of 'accelerating'). Examples: x^2, x^3, etc (for x>0)." Wrong
  20. Ricardo / Munoucounter, here is a simple example : Let's imagine a temperature graph that looks like a cos function with a 25year period. The secular trend is almsot flat. The short term trend (50 and 25) get higher and higher. You would have accelerating trends, you would infer accelerated warming, and you would be wrong because there would be no warming or cooling trend.
  21. 67 : it was sunny for 2 hours and a half and not 1hour and a half (so it adds up to 4hours).
  22. Helena#67: "i don't see how you can infer a deceleration." That's just silly. I live in a world where 3/4"/hour is a higher rainfall rate than 1/4" per hour. A world where calculus works and thus I can infer deceleration when the trend is decreasing. #69: "Examples: x^2, x^3, etc (for x>0)." Wrong " Show how x^2 does not have increasing slopes over progressively shorter intervals (as used here) when x>0. #70: "imagine a temperature graph that looks like a cos function with a 25year period. The secular trend is almsot flat." Your 'counter-example' requires at least one full cycle to have a flat secular trend. Do any of the graphs of real-world temperature variation shown here, especially fig 1, look anything vaguely like a full cycle cosine function with a 25 year period? Let's say the secular trend is the one established over the longest time interval (150 years) in Figure 1. Do you agree that the most recent 25 year period in Figure 1 shows a trend (0.18) that is greater than this secular trend (.05)? What do you propose this change in trend signifies?
  23. Henri has led us on a merry chase, no?
  24. Helena while you keep ignoring the meaning of your original claim you also ignoreed my full answer, despite I underlined the relevant part. Somehow I expected your selective reading. Quite telling.
  25. Further to this supposed counter example: We were discussing increasing functions with increasing slope. Your cosine does not apply.

Prev  1  2  3  

Post a Comment

Political, off-topic or ad hominem comments will be deleted. Comments Policy...

You need to be logged in to post a comment. Login via the left margin or if you're new, register here.

Link to this page


The Consensus Project Website

THE ESCALATOR

(free to republish)


© Copyright 2024 John Cook
Home | Translations | About Us | Privacy | Contact Us