


 Arguments


How do we know more CO2 is causing warming?
What the science says...
| Select a level... |
 Basic
Basic
|
 Intermediate
|
 Advanced
| ||||
|
An enhanced greenhouse effect from CO2 has been confirmed by multiple lines of empirical evidence. |
|||||||
Climate Myth...
Increasing CO2 has little to no effect
"While major green house gas H2O substantially warms the Earth, minor green house gases such as CO2 have little effect.... The 6-fold increase in hydrocarbon use since 1940 has had no noticeable effect on atmospheric temperature ... " (Environmental Effects of Increased Atmospheric Carbon Dioxide)
At-a-glance
To make a statement like, "minor greenhouse gases such as CO2 have little effect", is to ignore 160 years of science history. So let's look at who figured out the heat-trapping properties of carbon dioxide and when.
Experiments involving various gas mixtures had demonstrated the heat-trapping properties of water vapour, CO2 and methane in the 1850s. But those effects were yet to be quantified - there were no meaningful numbers. It was to be another 40 years before that happened.
Swedish scientist Svante Arrhenius (1859-1927) was the person who crunched the numbers. The results were presented in a remarkable paper, "On the Influence of Carbonic Acid in the Air upon the Temperature of the Ground", in 1896.
The many calculations in the 1896 paper include estimates of the amounts of CO2 increase or decrease required to drive the climate into a different state. One example used was the Hothouse climate of the Cenozoic, around 50 million years ago. Another was the glaciations of the last few hundred millennia.
To get a temperature rise of 8-9°C in the Arctic, Arrhenius calculated that CO2 levels would have to increase by 2.5 to 3 times 1890s levels. To lower the temperature 4–5°C to return to glacial conditions, he calculated a drop in CO2 was needed of 0.62-0.55 times 1890s levels.
We know CO2 levels in the 1890s from ice-core data. They were around 295 ppm. Let's do the sums. A reduction factor of 0.55 to 0.62 on 295 ppm gives 162.2-183.9 ppm. Modern ice-core measurements representing the past 800,000 years show that in glacial periods, CO2 levels fell to 170-180 ppm.
What we now know due to additional research since 1896 when Arrhenius worked on this, is that CO2 was an essential 'amplifying feedback'. That means changes triggered by long term, cyclic variations in Earth's orbit cause warming or cooling and CO2 release or entrapment in turn. Those changes in CO2 levels affected the strength of Earth's greenhouse effect. Changes in the strength of the greenhouse effect then completed the job of pushing conditions from interglacial to glacial - or vice-versa.
Arrhenius also made an important point regarding water vapour: "From observations made during balloon voyages, we know also that the distribution of the aqueous vapour may be very irregular, and different from the ideal mean distribution." This statement holds true today: water vapour is a greenhouse gas but because water exists in gas, liquid and solid forms in the atmosphere, it is continually cycling in and out of the air. It is distributed in a highly uneven fashion and is uncommon in the upper atmosphere. That's where it differs from CO2.
Once CO2 is up there, it's up there for a long time. As a consequence it has a pretty even distribution: 'well-mixed' is the term. As Arrhenius quantified all that time ago, once it's up there it constantly absorbs and re-radiates heat in all directions. That's why dumping 44 billion tons of it into our atmosphere in just one year (2019 - IPCC Sixth Assessment Report 2022) is a really bad idea.
Please use this form to provide feedback about this new "At a glance" section. Read a more technical version below or dig deeper via the tabs above!
Further details
Good scientific theories are said to have ‘predictive power’. In other words, armed only with a theory, we should be able to make predictions about a subject. If the theory’s any good, the predictions will come true.
Here’s an example: when the Periodic Table of the chemical elements was proposed in 1869, many elements were yet to be discovered. Using the theory behind the Periodic Table, the Russian chemist Dmitri Mendeleev was able to predict the properties of germanium, gallium and scandium prior to their discovery in 1886, 1875 and 1879 respectively. His predictions were found to be correct.
The effect on Earth's greenhouse effect of adding man-made CO2 is predicted in the theory of greenhouse gases. This theory was first proposed by Swedish scientist Svante Arrhenius in 1896, based on earlier work by Fourier, Foote and Tyndall. Many scientists have refined the theory since Arrhenius published his work in 1896. Nearly all have reached the same conclusion: if we increase the amount of greenhouse gases in the atmosphere, the Earth will warm up.
Where there is less agreement is with respect to the exact amount of warming. This issue is called 'climate sensitivity', the amount the temperatures will increase if CO2 is doubled from pre-industrial levels. Climate models have predicted the least temperature rise would be on average 1.65°C (2.97°F) , but upper estimates vary a lot, averaging 5.2°C (9.36°F). Current best estimates are for a rise of around 3°C (5.4°F), with a likely maximum of 4.5°C (8.1°F). A key reason for this range of outcomes is because of the large number of potential climate feedbacks and their variable interactions with one another. Put simply, some are much better understood than others.
What Goes Down…
The greenhouse effect works like this: Energy arrives from the sun in the form of visible light and ultraviolet radiation. The Earth then emits some of this energy as infrared radiation. Greenhouse gases in the atmosphere 'capture' some of this heat, then re-emit it in all directions - including back to the Earth's surface.
Through this process, CO2 and other greenhouse gases keep the Earth’s surface 33°Celsius (59.4°F) warmer than it would be without them. We have added 42% more CO2, and temperatures have gone up. There should be some evidence that links CO2 to the temperature rise.
So far, the average global temperature has gone up by more than 1 degrees C (1.9°F):
"According to an ongoing temperature analysis led by scientists at NASA’s Goddard Institute for Space Studies (GISS), the average global temperature on Earth has increased by at least 1.1° Celsius (1.9° Fahrenheit) since 1880. The majority of the warming has occurred since 1975, at a rate of roughly 0.15 to 0.20°C per decade."
The temperatures are going up, just like the theory predicted. But where’s the connection with CO2, or other greenhouse gases like methane, ozone or nitrous oxide?
The connection can be found in the spectrum of greenhouse radiation. Using high-resolution FTIR spectroscopy, we can measure the exact wavelengths of long-wave (infrared) radiation reaching the ground.
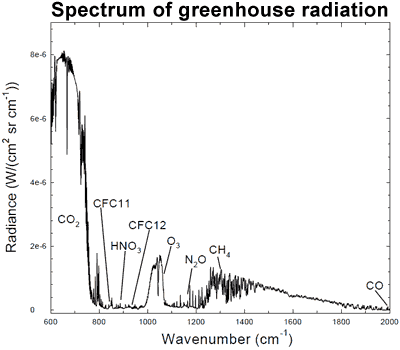
Figure 1: Spectrum of the greenhouse radiation measured at the surface. Greenhouse effect from water vapour is filtered out, showing the contributions of other greenhouse gases (Evans 2006).
Sure enough, we can see that CO2 is adding considerable warming, along with ozone (O3) and methane (CH4). This is called surface radiative forcing, and the measurements are part of the empirical evidence that CO2 is causing the warming.
...Must Go Up
How long has CO2 been contributing to increased warming? According to NASA, “Two-thirds of the warming has occurred since 1975”. Is there a reliable way to identify CO2’s influence on temperatures over that period?
There is: we can measure the wavelengths of long-wave radiation leaving the Earth (upward radiation). Satellites have recorded the Earth's outgoing radiation. We can examine the spectrum of upward long-wave radiation in 1970 and 1997 to see if there are changes.
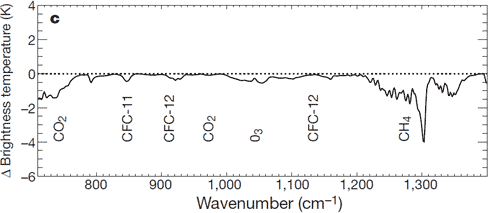
Figure 2: Change in spectrum from 1970 to 1996 due to trace gases. 'Brightness temperature' indicates equivalent blackbody temperature (Harries et al. 2001).
This time, we see that during the period when temperatures increased the most, emissions of upward radiation have decreased through radiative trapping at exactly the same wavenumbers as they increased for downward radiation. The same greenhouse gases are identified: CO2, methane, ozone and so on.
The Empirical Evidence
As temperatures started to rise, scientists became more and more interested in the cause. Many theories were proposed. All save one have fallen by the wayside, discarded for lack of evidence. One theory alone has stood the test of time, strengthened by experiments.
We have known CO2 absorbs and re-emits longwave radiation, since the days of Foote, Tyndall and Arrhenius in the 19th Century. The theory of greenhouse gases predicts that if we increase the proportion of greenhouse gases, more warming will occur.
Scientists have measured the influence of CO2 on both incoming solar energy and outgoing long-wave radiation. Less longwave radiation is escaping to space at the specific wavelengths of greenhouse gases. Increased longwave radiation is measured at the surface of the Earth at the same wavelengths.
Last updated on 16 July 2023 by John Mason. View Archives


jessicars - when you do the experiment outside and you want to calculate the effect of your plastic bag of CO2, then you need to consider that column of gas under consideration is 55km tall and you have changed the CO2 content of the bottom few centimeters. Yes, that CO2 will trap IR radiation and re-radiate to the surface. Because that surface is receiving more radiation, it will heat up and the surface will heat the bag. You note that it is surface under that bag that is heated by back radiation, not the gas in bag. (hence thermometer under bag). The question is how much, and in your setup, yes, it is insignificant. To replicate the atmospheric GHE, you need a column of gas 55km or so high.
The experiments we pointed you to isolate other effects and applify the CO2 effect to make it measurable with thermometer. Radiation is radiation whether it is coming from heat lamp or a warm surface.
If you are looking for empirical evidence of GHE, then that paper on direct measurement is one, but see also our reference especially the CO2 traps heat section with papers from Harries, Evans, Griggs , Philpona, Chen who all compared the calculated radiation at either top of atmosphere or surface of earth and compared it to direct measurements.
Hi Eclectic,
> (A) Firstly, there is the empirical evidence from experimentation during the past 150+ years, showing CO2 absorption of (some) Infra-Red radiation. (B) During the past century there is the empirical evidence of the CO2-related global Green House Effect [GHE] : evidence provided by both expensive and (relatively) cheap experimentations & observations. (Admittedly, "greenhouse" is a poorly-named term — but historically we are now stuck with it, and it is now a widely-understood useful label.)
Your experiment is inappropriate because of its lack of sensitivity and specificity (too many confounding variables in your experimental set-up).
Not only do you need to address the question of IR absorption by CO2 gas, but secondly you need to address the mechanism of the planetary GHE (a mechanism which is completely unconducive to backyard experimentation, I think).
What variables? You can't simply make a statement then not substantiate it.
I am aware of "evidence" of the planet warming or ocean levels rising or ice caps melting, but the climate has always changed naturally. Why assume it is being changed now by human-caused CO2? If you don't know the cause, measuring the effect doesn't prove anything. You really can't realy on any empirical measurements to prove AGW, you are left with the theory alone i.e. what happens when there is more CO2 in the atmosphere?
I have done the experiment several times. With different levels of CO2. The most I saw last night, at about 20,000 ppm, was an increase of 0.5 degrees. This is a CO2 doubling of over five times, so if this were in the atmosphere, it would be expected to increase by 5 degrees.
Why is it not possible to do an experiment in a plastic bag to measure a response?
I have been linked to similar experiments done to prove CO2 where they put CO2 in a fishtank, then shine a heat lamp. I pointed out that in nature, there is no heat lamp or artifiical source of radiation, so that experiment is not indicative of what will happen in reality. Why is it acceptable to do a fishtank + CO2 experiment to try to prove AGW, but not acceptable to do a plastic bag + CO2 experiment to try to disprove it? I'm happy to accept an explanation, but I don't see why, if you understand the reason, you can't simply explain it to me instead of send me to read hundreds of papers (unless you yourself do not understand it).
Can you also give an explanation - if the correlation shown between CO2 and temperature on the Vostok Ice Core samples is assumed to be causation, with CO2 causing temperature rise - why CO2 would have a linear effect on temperature (~1 degree per 10 ppm), but now we expect a logarithmic effect (i.e. 1 degree per doubling).
Can you explain what is going on with the molecular activity of the gas that would allow for such an unintuitive behaviour? Do all gases act this way when absorbing IR? Why? At what point do they go from linear to logarithmic and why? Has this been studied? It seems like it is fundamental to knowing whether climate science is accurate or not. How else can you come up with the prediction of 1 degree per doubling?
My understanding is that they act logarithmically, which would mean that the Vostok Ice Core samples can not be assumed to be that CO2 causes temperature. The 800 year lag, where temperature changes first also would support that. You know what does have a linear relationship though, and could explain the Vostok Ice Core samples? The CO2 solubility of water (oceans) between 0 to ~23 degrees.
[DB] Please confine comments to the focus of the thread on which you place them. Thousands of discussion threads exist at Skeptical Science; using the Search function in the Upper Left of every page can help you find them. Alternatively, you can click on the Arguments Tab to find different listings of topics (like a Taxonomic Listing or by Popularity). Area experts and knowledgeable individuals will respond to help you increase your understandings, but you must first be on-topic. Thanks!
jesscars - I explained why you cant do it with a plastic bag - it is not 55km high. You cant complain about science being wrong when the problem is with your understanding of it. You do not appear to have looked at resources posters have offered you.
You have now raised a whole bunch of long-debunked talking points which are offtopic here. Please use the search button on top left or the "arguments" to find the appropriate myth and comment there, not here.
eg "Climate has changed before", "Co2 lags temperature". It would seem that with a very large no. of misunderstandings about climate, that a read through the appropriate section the IPCC WG1 to get a grip on the basics. I would also reiterate the Science of Doom. Just for starters, the ice-age cycle is driven by orbital variation which primarily affect earths albedo. Once temperatures change, CO2 changes also from interactions with ocean and eurasian wetlands amplifying the effect. The detail here is huge - if you want to question the science, then please become familiar with the science first.
Also, just to look at what you expect from your experiment, executed perfectly. Assuming you are around mid-latitude and in summer, that you use a jar of CO2 0.5m high, then changing concentration of CO2 from 100ppm to 20,000ppm should change flux from 414.8W/m2 to 415.4 if I have done calcs correctly. Not enough to change temperature by even 0.1C.
Hi MA,
> jesscars @343,
The relative strength of CO2 as a GHG is dependent on the logarithmic nature of its forcing. The first doubling will, molecule for molecule, be twice as 'forceful' as the second doubling and a thousand times more 'forceful' than the tenth doubling. So the 'forcefulness' you measure in the High-CO2 bag will be mainly a thousand-times weaker than the CO2 'forcefulness' involved in AGW. And while the ten doublings of CO2 together will provide a very 'forceful' GHG effect at 15 microns, (By-the-way, I note my 12 microns @340 is wrong - it is 15 microns.) this is achieved by stripping all GHG from everywhere else. This one-step-warmer-one-step-cooler effect for the bag world could well explain the non-result although there could be many other contributing reasons.
I agree with this. I repeated the experiment last night with about 2% CO2 or 20,000 or 5-6 doublings. (I.e. enough to get an effect from CO2 without diluting the effect of H2O.) The bag with CO2 was 0.5 degrees warmer during the night, outside. The difference disappeared in the morning.
> jesscars @347,
Your comparison of the 1ºC of warming for double CO2 (without feedbacks) with the Vostok Ice Core temperature/CO2 graph doesn't properly hold. Firstly, the Vostok temperatures will be subject to polar amplification and Ice Ages result from other non-CO2 'forcings' (CH4, ice albedo) and their feedbacks. The direct CO2 contribution (without feedbacks) to the Ice Age cycles (which are globally some 5ºC) is probably something like 0.5ºC, which fits in with the logarithmic relationship. With feedbacks, the CO2 'forcing' is responsible for about a third of the Ice Age wobbles.
OK, so you are saying that the effect of CO2 on the temperature is only minor. If so, then what explains the correlation? Why would the other factors that contribute to temperature change move/fall at the same time as CO2? This is obviously not chance, so whatever affects the CO2 must also affect those other factors in order to get that correlation. Has this been proven by empirical research?
(Also, what is the cause of historic atmospheric CO2 change? I've heard several contradictory answers I.e. Milankovitch Effect or volcanoes. Why does CO2 change over time i.e. where does it come from, where does it go?)
[DB] Please confine comments to the focus of the thread on which you place them. Thousands of discussion threads exist at Skeptical Science; using the Search function in the Upper Left of every page can help you find them. Alternatively, you can click on the Arguments Tab to find different listings of topics (like a Taxonomic Listing or by Popularity). Area experts and knowledgeable individuals will respond to help you increase your understandings, but you must first be on-topic. Thanks!
Jesscars, I rather suspect you have been pulling my leg with your story of your plastic bag experiments. Perhaps you just used that as an entry point for your argumentative disagreement with mainstream science.
As Scaddenp has said, you really need to educate yourself on basic science before you can seriously start to question things. Otherwise . . . you embarrass yourself with a Dunning-Kruger performance.
But fear not — there is time to redeem yourself. Why not try the intellectually-stimulating exercise of learning some genuine climate science from the articles, videos, etcetera found here at SkepticalScience & similar reputable sites. Or if you find your dour & angry mood persisting, then try the very entertaining Potholer54 video series I mentioned — all are amusing as well as informative about real science.
The more you learn, the more you understand reality. It is not a coincidence that all real scientists are in consensus agreement about AGW !!
jesscars - I have responded on a more appropriate thread here. Any discussion of past climate should go there.
jesscars @355,
The Ice Age cycles are strange beasts. They are triggered by changes in the solar warming of the Northern Hemisphere (the Milankovitch Cycles) but the climate has to be primed and in an a-stable state for the trigger to work.
And while the trigger is quite a gentle shove to climate, the triggered 'impacts' are big enough to raise global temperatures some 5ºC. The 'impacts' are technically feedbacks forced by the Milankovitch Cycles but it is these feedbacks that do all the work.
Simplistically, the main instability is the polar Ice Age ice caps that begin to melt out, this raising temperatures and destabalising further ice caps. And on the back of this warming, the level of atmospheric CO2 and CH4 will rise.
In the case of CO2, the carbon cycle requires oceans and biosphere to be in equilibrium with the atmosphere. With warming ocean waters, less CO2 can be carried by the warmer water, raising atmospheric CO2 levels which in-turn adds to the warming process. And the frozen biosphere also releases captured CO2 as it melts. (These processes will be at work today under AGW but with only 1ºC of warming in less than a century, the impact of the warming CO2 feedbacks is much less than the 100ppm CO2 Ice Age effect that resulted from much more warming over 8,000 years.) In very simple terms, that answers "Why does CO2 change over time i.e. where does it come from, where does it go?" Volcanoes do emit CO2 but it is only very exceptionally (within the billion year planet's history) that volcanism has elevated atmospheric CO2 by anything of significance.
"warming has occurred since 1975, at a rate of roughly 0.15-0.20°C per decade". More specifically and quite interestingly:
+0.165 degrees / decade: La Nina years 1967-2012
+0.165 degrees / decade: ENSO-neutral years 1970-2013
+0.20 degrees / decade: El Nino years 1966-1990
+0.23 degrees / decade: El Nino years 1990-2013 (sparse data though)
El Ninos are "pulling away".
The link to Puckrin 2004 is broken
I think I understand the spectrum graphs and the role of CO2 in the outer layers and the sensitivity to the CO2 concentration relative to the base level in the simple model. My question is: as the global mean temp rises, and water vapor rises, and polar ice cap coverage decreases, a number of things change. Surface reflection changes, ice reflects whereas open ocean absorbs; water vapor convection and absorption change. Is there an equation equivalent to the 5.35 ln (C/C_0) equation with additional terms for these effects? Or is that equation already based on a models which already have these additional feedback effects? Thanks.
PS I noticed you folks are typing quite lengthy responses and spending a lot of time answering a lot of (some quite silly) people with much more patience than I would have with such people. A simple link to read a paper or two would be fine. Math and statistics is not a problem, these are my fields of education, but I have not read much climate science and would like to. Just need a good place to start and I can follow bibiliographies from there. Thanks again.
ebelba - doubling CO2 by itself gives an extra 4W/m2 (your equation) to surface of the earth and that corresponds to ~1.1C increase in global temperature. All of the rest of temperature increase is due to feedbacks as you outlined which is why climate models are so complex and why the range of climate sensitivity estimates is so large.
The IPCC WG1 report, starting with the technical summary, is quite definitely the best place to start getting an education because you can go from technical summary to full report and from there down into the referenced papers.
The 1984 "Climate Sensitivity: Analysis of feedback mechanisms" is now dated but not a bad starting point as well. Check out the more recent Proistosescu and Huybers though.
I've read the 1984 paper and the Proistesescu paper and subsequently a bunch of abstracts of papers on the feedback roles of land cover and land use, albedo, etc. It appears that one area causing a dispersion of uncertainty is the role of cloud cover albedo feedback. Is there a single source you would recommend which puts confidence intervals around each of the remaining sources of uncertainty as well as ranks the robustness of the existing models in each area, such as climate+land use, climate+vegetative cover, climate+cloud cover albedo, etc.?
thanks for your prior links, they were good starts.
ebelba - sorry for delay - no internet over weekend. Clouds are indeed one tough issue for feedback predictions. Clouds are both a positive and negative feedback depending on whether high or low. This is not well captured in climate models (cell size in models is too large for the processes involved) so figuring out how that would change with increasing water vapour is challenging. I am not aware that uncertainties for individual components have changed significantly since those published in Fig SPM.5 (see text for sources) of IPCC WG1 or table 8.6 in the main text. Chpt 8 has the main coverage of this. There has been a focus recently on trying to establish empirical constraints via paleoclimate archives and direct observations. For recent work, see for example Dessler and Forster 2018. For paleo, see say Hansen & Sato 2012. Their model/observation fit for a sensitivity around 3 impressed me.
I dont think there is any escaping the problem that governments need to set policy despite stubborn uncertainties in the values of ECS; but need to do this on basis of a best estimates being close to 3.
I have a couple of questions re. the historic vs future predicted relationship between CO2 and temperature:
If you look at the Vostok Ice Core Records, the relationship between CO2 and temperature is linear, and is approximately 1 degree change per 10 ppm change.[1]
1) Why is this not the expected predicted relationship of CO2 to temperature? Why does it go from 1 degree per 10 ppm to 1 degree per doubling, the first doubling being 300 ppm (then 600, 1200, etc.)? Why does the sensitivity of the earth's temperature to CO2 change so severely to have only 1/30th the sensitivity? What is the reason for this reduction in sensitivity?
2) Why does the relationship change from linear to logarithmic? There is a steady and consistent linear relationship of 1 degree for 10 ppm - why should this change to a logarithmic relationship of degree per doubling i.e. instead of 1 degree per 10 ppm, we now have 1 degree per 300 ppm, then per 600 ppm, then per 1200 ppm, and so on. What is the cause of the change of the nature of this relationship?
It seems to me that the "skeptics'" explanation - which assumes temperature is causal in the observed temperature-CO2 correlation - does not involve such erratic and unexplained behaviour.
N.B. The linear 1 degree per 10 ppm can be explained by the linear relationship of CO2 solubility in ocean water (at temperatures below 23 degrees, see link [2]).
As the temperature changes (measured by the atmospheric temperature), this causes the ocean temperature to change. Within the temperature range seen on the graph in link [2] i.e. below about 23 degrees, you would expect a similar amount of CO2 to be released or absorbed, per unit or degree of change, per volume of water, resulting in a linear atmospheric temp-CO2 relationship.
The Vostok Ice Core records also show an 800-year lag where temperature changes before CO2 does. This indicates that temperature is causing CO2 to change, not vice-versa. (The Shakun study only attempts to provide an explanation for this for the last deglaciation, not the entire duration of the Vostok samples (400,000 years), so really is inadequate.) This can be explained by the fact that the oceans take so long to heat or cool. So it takes hundreds of years for the warming or cooling to have an effect on the CO2 levels, as this has to happen via the oceans.
2) The causal mechanism to explain the temperature-CO2 correlation is explained by: natural causes (e.g. Milankovitch cycles, sun radiation cycles, circumpolar jet-streams, etc.) to be caused by ocean absorption of CO2, is expected
[1] http://joannenova.com.au/global-warming-2/ice-core-graph/
[2] https://i1.wp.com/www.geological-digressions.com/wp-content/uploads/2016/12/CO2-solubility.jpg
[PS] Just a quick note that icecore data is indeed used as a way to constrain to climate sensitivity. Try for instance Hansen & Sato 2012 which does it properly. Also see here for Co2 lags question
Please ignore that last point "2)".
Jesscars - just a comment about the log relationship. My intuition is as follows: imagine a completely dense wall of CO2 completely blocking all of the parts of the infrared spectrum that CO2 is known to block. That is the maximum theoretical contribution. As you create gaps by halving that wall, you allow infrared to escape. We are coming at it from below, doubling. It has to be something almost asymptotic to that wall. A log has the right shape - as a practical matter its not really a log, because the total amount of CO2 that could be put in the atmosphere from all stored forms is finite. So a log is a good approximation to the asymptotic relationship as we get to higher levels. At very low starting values close to zero, it could easily be linear (or more).
I think there is Jesscars is a little confused about what the science actually states. There is a log relationship between concentration of CO2 and the surface irradation. (not temperature). ie, increase in CO2 since pre-industrial has caused average of 4W/m2 increase in surface radiation. To get another 4W/m2 of irradiation, then you have to double concentration again. (ie go to 800ppm). The relationship is always logarithmic, never linear. As to why, well it falls out of the radiative transfer equations but it is anything but straightforward. More recent work on it here.
There is no simple relationship between increase in CO2 and surface temperature, because of all the feedbacks that cut in on different timescales. eg water vapour response is near instant; albedo is complex time scale because of dynamics of ice melt; GHG feedback (eg methane from tundra, CO2 from ocean) are on millenial scales. The Equilibrium Climate Sensitivity (ECS) tries to estimate this and best guess is 2.8-3C for doubling of CO2 but with wide bounds.
What is the response to this article[ https://towerofreason.blogspot.com/2018/04/co2-is-not-driving-global-warming.html#comment-form ] reasoning that climate models do not correctly recognise the effects of increasing CO2 conentrations and that CO2 is not the main driver of climate changes?
Sorry - first post :-) didn't insert as link.. https://towerofreason.blogspot.com/2018/04/co2-is-not-driving-global-warming.html#comment-form
Thanks!
Penguin,
Your article claims that the concern about AGW started with Al Gore's movie An Inconvienent Truth in 2006. He apparently missed James Hansen's Senate testimony in 1989 that AGW was an incoming disaster. Lindon Johnson asked the National Academy of Science if AGW was a problem in 1965 and they replied that it would be a problem in 40 years or so. The first IPCC report was written in 1990!
The article claims that the CO2 absorbtion band is saturated. The probem here is the writer does not understand how the greenhouse effect works. At the surface the absorbtion band is saturated, everyone knows that. That does not matter. About 10 km up in the sky (30,000 feet) is the important area. At this height there is no water, only CO2. This is the escape altitude. Increased CO2 increases the escape altitude which warms the Earth. Read the OP for more information.
This dribble has been debunked many times. The author admits his ignorance when he claims no-one cared about AGW before 2006. The first IPCC report was written in 1990!!
Penguin @370,
Adding more detail to michael sweet @372, you are asking about a 6,000 word article from 2018 entitled "CO2 is Not Driving Global Warming" written by...
Well we do not learn the name of the "NARTE certified electromagnetic compliance engineer with more than 30 years practical experience" who is also "a systems engineer with plenty of experience in software design and development" with the "lifetime fascination with astronomy and cosmology." That is never a good sign - to flaunt your qualifications without naming yourself.
Whoever he is, it took him from 2006 (the Al Gore flim) until 2018 to decide to present this grand revelation to the world, even though he had "alarm bells ringing" in 2006. A second bad sign.
And he asserts that the theory underpinning AGW is no more that a CO2/GlobalTemperature correlation which is nonsense. A third bad sign.
The entirety is un-referenced which is fine when it is discussing widely understood subjects but when it begins to dip into fantasy, the lack of referencing becomes entirely unscientific and fatal for the presented thesis. Thus CO2 contributes roughly 16% to the greenhouse effect and would unassisted provide 25% of the greenhouse effect. I can say that un-referenced without much controversy. But within an un-referencing article, the assertion that CO2 is "responsible for more than 2.8% of greenhouse gas warming" is the beginning of the end for this grand thesis.
A few paragraphs later he asserts that CO2 absorbtion is IR is multiply-counted (a bit like double-counted but many more times) thus "cumulatively contributing to atmospheric warming." Such an idea is nonsensical. And nobody has spotted this alleged eggregious error? That would require some very good explanation. (The assertion "CO2 will not radiate more infrared energy than it absorbs if it’s at the same temperature as its surroundings" appears fundamental to the poor understanding of the author. It is precisely because it is the gas temperture that defines the CO2 IR emissions (and thus not the levels of absorbed-IR as he asserts) which creates the power of the CO2 greenhouse effect. Thus the comment "Increasing CO2 concentrations ... would mean that the greenhouse effect of CO2 will be concentrated at lower altitudes" is back-to-front.)
The guts of his unsupported assertions run:-
He is effectively saying 'Once the IR has a clear shot at space, the temperature of the atmosphere it is passing through doesn't matter.' The fool (and he is surely that) misinterprets "the layers from which" for "the layers through which". It is the temperature of gas from where the IR is shot into space that is crutial to the amount of IR energy cooling the planet.
I'm looking at the comments and wondering about what I think are obvious things.
1. The 800 year CO2 lag should indicate that CO2 isn't driving temperature.
2. If increased CO2 raises temperature, what is causing the subsequent temperature crashes since CO2 is still elevated?
3. If you can't measure greenhouse gas effects with 'back yard' science experiments, what makes anyone think there is an effect in the first place? Yes, CO2 is a 'greenhouse gas' where people add over 1000 ppm of CO2 to help the plants grow. Apparently that much additional CO2 isn't noticably changing the inside temperature, so why would a 100 ppm change in the atmosphere have any measurable change in planetary surface temperatures?
4. There is another reason why surface temperatures can increase, specifically, reductions in surface wind speeds, which is occuring. Here is a report complaining about it.
https://wattsupwiththat.com/2018/12/05/study-global-wind-speed-dropping-wind-farms-victim-of-atmospheric-stilling/
@youjaes @374
OK, I will take the bait.
You clearly are not very well informed on climate science and you have not spent anytime thinking about the points you make. Let me give you some ideas to think about. If you have more questions there are plenty of knowledgeable people who will (sincerely) help if you ask in good faith.
1. The CO2 may not be driving the initial temperature rise but there is no reason to discount it in subsequent rises.
2. Is CO2 still elevated? What events are you talking about? I would guess Milkanovich cycles may answer your question.
3. Who says you cannot measure greenhouse effects with "backyard" experiments? Why do they have to be "backyard"? Are "backyard" experiments somehow more convincing than frontyard experiments? I suggest you read something about the greenhouse effect as you do not understand it.
4. Um. Yes, wind can reduce/increase local temperatures. What has that got to do with global warming?