Climate Science Glossary

Term Lookup

Enter a term in the search box to find its definition.

Settings

Use the controls in the far right panel to increase or decrease the number of terms automatically displayed (or to completely turn that feature off).

Term Lookup

Settings


All IPCC definitions taken from Climate Change 2007: The Physical Science Basis. Working Group I Contribution to the Fourth Assessment Report of the Intergovernmental Panel on Climate Change, Annex I, Glossary, pp. 941-954. Cambridge University Press.

Home Arguments Software Resources Comments The Consensus Project Translations About Support

Bluesky Facebook LinkedIn Mastodon MeWe

Twitter YouTube RSS Posts RSS Comments Email Subscribe


Climate's changed before
It's the sun
It's not bad
There is no consensus
It's cooling
Models are unreliable
Temp record is unreliable
Animals and plants can adapt
It hasn't warmed since 1998
Antarctica is gaining ice
View All Arguments...


Username
Password
New? Register here
Forgot your password?

Latest Posts

Archives

Working out climate sensitivity from satellite measurements

What the science says...

Lindzen's analysis has several flaws, such as only looking at data in the tropics. A number of independent studies using near-global satellite data find positive feedback and high climate sensitivity.

Climate Myth...

Lindzen and Choi find low climate sensitivity

Climate feedbacks are estimated from fluctuations in the outgoing radiation budget from the latest version of Earth Radiation Budget Experiment (ERBE) nonscanner data. It appears, for the entire tropics, the observed outgoing radiation fluxes increase with the increase in sea surface temperatures (SSTs). The observed behavior of radiation fluxes implies negative feedback processes associated with relatively low climate sensitivity. This is the opposite of the behavior of 11 atmospheric models forced by the same SSTs. (Lindzen & Choi 2009)

Climate sensitivity is a measure of how much our climate responds to an energy imbalance. The most common definition is the change in global temperature if the amount of atmospheric CO2 was doubled. If there were no feedbacks, climate sensitivity would be around 1°C. But we know there are a number of feedbacks, both positive and negative. So how do we determine the net feedback? An empirical solution is to observe how our climate responds to temperature change. We have satellite measurements of the radiation budget and surface measurements of temperature. Putting the two together should give us an indication of net feedback.

One paper that attempts to do this is On the determination of climate feedbacks from ERBE data (Lindzen & Choi 2009). It looks at sea surface temperature in the tropics (20° South to 20° North) from 1986 to 2000. Specifically, it looked at periods where the change in temperature was greater than 0.2°C, marked by red and blue colors (Figure 1).
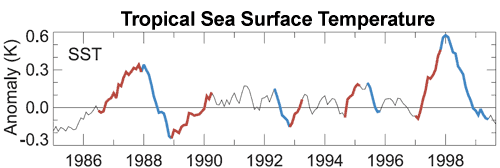

Figure 1: Monthly sea surface temperature for 20° South to 20° North. Periods of temperature change greater than 0.2°C marked by red and blue (Lindzen & Choi 2009).

Lindzen et al also analysed satellite measurements of outgoing radiation over these periods. As short-term tropical sea surface temperatures are largely driven by the El Nino Southern Oscillation, the change in outward radiation offers an insight into how climate responds to changing temperature. Their analysis found that when it gets warmer, there was more outgoing radiation escaping to space. They concluded that net feedback is negative and our planet has a low climate sensitivity of about 0.5°C.

Debunked by Trenberth

However, a response to this paper, Relationships between tropical sea surface temperature and top-of-atmosphere radiation (Trenberth et al 2010) revealed a number of flaws in Lindzen's analysis. It turns out the low climate sensitivity result is heavily dependent on the choice of start and end points in the periods they analyse. Small changes in their choice of dates entirely change the result. Essentially, one could tweak the start and end points to obtain any feedback one wishes.
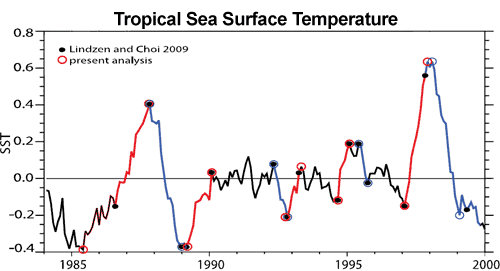

Figure 2: Warming (red) and cooling (blue) intervals of tropical SST (20°N – 20°S) used by Lindzen & Choi (2009) (solid circles) and an alternative selection proposed derived from an objective approach (open circles) (Trenberth et al 2010).

Debunked by Murphy

Another major flaw in Lindzen's analysis is that they attempt to calculate global climate sensitivity from tropical data. The tropics are not a closed system - a great deal of energy is exchanged between the tropics and subtropics. To properly calculate global climate sensitivity, global observations are required.

This is confirmed by another paper published in early May (Murphy 2010). This paper finds that small changes in the heat transport between the tropics and subtropics can swamp the tropical signal. They conclude that climate sensitivity must be calculated from global data.

Debunked by Chung

In addition, another paper reproduced the analysis from Lindzen & Choi (2009) and compared it to results using near-global data (Chung et al 2010). The near-global data find net positive feedback and the authors conclude that the tropical ocean is not an adequate region for determining global climate sensitivity.

Debunked by Dessler

Dessler (2011) found a number of errors in Lindzen and Choi (2009) (slightly revised as Lindzen & Choi (2011)).  First, Lindzen and Choi's mathematical formula  to calculate the Earth's energy budget may violate the laws of thermodynamics - allowing for the impossible situation where ocean warming is able to cause ocean warming.  Secondly, Dessler finds that the heating of the climate system through ocean heat transport is approximately 20 times larger than the change in top of the atmosphere (TOA) energy flux due to cloud cover changes.  Lindzen and Choi assumed the ratio was close to 2 - an order of magnitude too small.

Thirdly, Lindzen and Choi plot a time regression of change in TOA energy flux due to cloud cover changes vs. sea surface temperature changes.  They find larger negative slopes in their regression when cloud changes happen before surface temperature changes, vs. positive slopes when temperature changes happen first, and thus conclude that clouds must be causing global warming.

However, Dessler also plots climate model results and finds that they also simulate negative time regression slopes when cloud changes lead temperature changes.  Crucially, sea surface temperatures are specified by the models.  This means that in these models, clouds respond to sea surface temperature changes, but not vice-versa.  This suggests that the lagged result first found by Lindzen and Choi is actually a result of variations in atmospheric circulation driven by changes in sea surface temperature, and contrary to Lindzen's claims, is not evidence that clouds are causing climate change, because in the models which successfully replicate the cloud-temperature lag, temperatures cannot be driven by cloud changes.

2011 Repeat

Lindzen and Choi tried to address some of the criticisms of their 2009 paper in a new version which they submitted in 2011 (LC11), after Lindzen himself went as far as to admit that their 2009 paper contained "some stupid mistakes...It was just embarrassing."  However, LC11 did not address most of the main comments and contradictory results from their 2009 paper.

Lindzen and Choi first submitted LC11 to the Proceedings of the National Academy of Sciences (PNAS) after adding some data from the Clouds and the Earth’s Radiant Energy System (CERES).

PNAS editors sent LC11 out to four reviewers, who provided comments available here.  Two of the reviewers were selected by Lindzen, and two others by the PNAS Board.  All four reviewers were unanimous that while the subject matter of the paper was of sufficient general interest to warrant publication in PNAS, the paper was not of suitable quality, and its conclusions were not justified.  Only one of the four reviewers felt that the procedures in the paper were adequately described. 

As PNAS Reviewer 1 commented,

"The paper is based on...basic untested and fundamentally flawed assumptions about global climate sensitivity"

These remaining flaws in LC11 included:

  • Assuming that that correlations observed in the tropics reflect global climate feedbacks.
  • Focusing on short-term local tropical changes which might not be representative of equilibrium climate sensitivity, because for example the albedo feedback from melting ice at the poles is obviously not reflected in the tropics.
  • Inadequately explaining methodology in the paper in sufficient detail to reproduce their analysis and results.
  • Failing to explain the many contradictory results using the same or similar data (Trenberth, Chung, Murphy, and Dessler).
  • Treating clouds as an internal initiator of climate change, as opposed to treating cloud changes solely as a climate feedback (as most climate scientists do) without any real justification for doing so. 

As a result of these fundamental problems, PNAS rejected the paper, which Lindzen and Choi subsequently got published in a rather obscure Korean journal, the Asia-Pacific Journal of Atmospheric Science. 

Wholly Debunked

A full understanding of climate requires we take into account the full body of evidence. In the case of climate sensitivity and satellite data, it requires a global dataset, not just the tropics. Stepping back to take a broader view, a single paper must also be seen in the context of the full body of peer-reviewed research. A multitude of papers looking at different periods in Earth's history independently and empirically converge on a consistent answer - climate sensitivity is around 3°C implying net positive feedback.

Last updated on 6 July 2012 by dana1981. View Archives

Printable Version  |  Offline PDF Version  |  Link to this page

Argument Feedback

Please use this form to let us know about suggested updates to this rebuttal.

Further viewing

Andrew Dessler explains in relatively simple and short terms the results from his 2011 paper:

Comments

Prev  1  2  3  4  5  6  7  8  9  10  11  12  13  14  15  16  17  18  19  20  Next

Comments 426 to 450 out of 483:

  1. RW1 - your references to "Power" (Not), "gain" suggest you are using an electrical analogy - this is not helping you.
  2. #422: "A*exp(-t/tau)," Nope, that's exponential decay to 0. What you want is y=A(1-e^(-t/tau)), which asymptotes to A. "climate system responds slower than seasonal change. This is clearly wrong because if it was the case, seasonal change would not happen!" Mistaking weather (seasonal, small tau) for climate (multi-year, long tau)? So climate systems do indded respond more slowly than seasonal changes, as KR demonstrates in #423. That's why seasons aren't climate.
  3. scaddenp, "It doesnt, I agree, but as I said, 1W/m2 as global annual average has a very different temporal, spatial and spectral distribution for sun versus CO2. The direct radiative balance is obviously maintained but to consider a simplification, 1W/m2 could by say 2W/m2 in one hemisphere and 0 in the other. The temperature response for radiative balance is 0.6 in one hemisphere, 0 in the other still for global average of 0.3." The radiative forcing of 3.7 W/m^2 from a doubling of CO2 is a global average just like average solar input is. How do you think each is calculated? Are you forgetting that the Sun is pretty much the only source of energy in the system? "Sensitivity it about feedbacks though. The milankovich forcing driving the ice age cycle is tiny as global average, but the large forcing at 65N over long time delivers feedbacks enough to drive the cycle. The identical forcing at 65S does not - far less scope for feedbacks in the south." We're not due for another Milankovitch cycle for long time. Plus, it's mainly the change in the distribution of the energy from the Sun that is apparently enough to overcome what appears to be a very strong net negative feedback operating on the system. "You have to run the physics and see how it pans out." OK, run "the physics" and show us how it pans out.
  4. KR, Yes, I understand there are many time constants, but the one that matters, relative to the measured response, is that which quantifies the response of the thermal mass of the planet. Also, the 25 years of data I used was to extract the response, from which the consequence of a change can be predicted and is not constrained by your requirement of 25-30 years to ascertain a trend, even though the data set is long enough. In this case, extending the data set results in the inclusion of the longer term effects as they affect the response. The response to a linear change can also be extracted from the LTI by setting the forcing function to a ramp from which the steady state solution can be solved.
  5. RW1 - how did you think it was calculated? There are empirical constraints on sensitivity, but the numbers come from running the physics and seeing what the number comes out to be. Actually, the mean is 3.2C, not sure where you get 3.7. Its an output of model, global average of the temperature that accompanies model run with a doubling of CO2. To see "how it pans out", see the various model estimates but read that section of the IPCC report to understand why they vary. Milankovich cycles are always operating, but the point of my explanation was to show that you cannot ignore spatial distribution of forcing in calculating feedback. True for Milankovich, true for CO2. I dont understand your comment about sun being "only source of energy in the system". Any suggesting otherwise? GHG are about impediments to surface radiative efficiency and changes to surface temperature.
  6. Whoops sorry. I realise some confusion. 3.7W/m2 is radiative forcing (no feedback) for GHGs. Without feedbacks that's 1 degree of temperature rise - and this is regardless of type of forcing. However, this article is about sensitivity = the surface temperature rise associated with doubling of CO2. The feedbacks are what change 1 degree change for radiative balance to 3.2 degrees of actual warming. And yes, you have to run the physics to sort out the feedbacks so you can take into account the temporal, spatial, and spectral differences in the types of forcings.
  7. #429: "I understand there are many time constants,... " Merely stating that you understand something doesn't necessarily make it so. We've heard all about time constants before. And yet the basic disregard for the entirety of thermal inertia evidenced here and in other prior postings continues. "the 25 years of data I used was to extract the response ..." Except, as pointed out in a number of prior comments, neither RW1 nor you accept the fact that there has already been greater temperature change (and a greater rate of temperature change) than your so-called sensitivity predicts. So you do not have the full response in your model. Perhaps it's time for a new model. Let's boil it down to essentials: You show that instantaneous magnitudes of seasonal heating/cooling and other short-term variations far outweigh the GHE. Everyone else understands that those changes average to 0 over the course of the year (or cycle) and therefore contribute nothing to the long term warming trend. In fact, nothing you've presented contributes to any long term warming. And yet you insist that you have calculated a 'sensitivity', so you must accept that there is long term warming. Thus we arrive at a contradiction between your model and your stated position. I suggest the two of you do the homework (off line, as we do not need to see it played out here) to resolve this basic internal contradiction.
  8. George White (co2isnotevil), That is a wholly false contention. Why did you link to a unreferenced chart? What source data did you use? What atmospheric level? Why did you convert the data to absolute temperature rather than leave it in its native temperature anomaly format? It's interesting that your purported satellite data shows no spike in 1998. Here is the actual satellite temperature data. Source: University of Alabama in Huntsville - lower troposphere satelitte temperature data
    Response: The post you are responding to was deleted due to a number of off-topic and inflammatory comments. If you would like to discuss the temperature record, please move the discussion to Are surface temperature records reliable? or Warming Stopped in 1998.
  9. I see the post I was replying has been removed through moderation. The contention was that satellite temperature data showed a decreasing temperature.
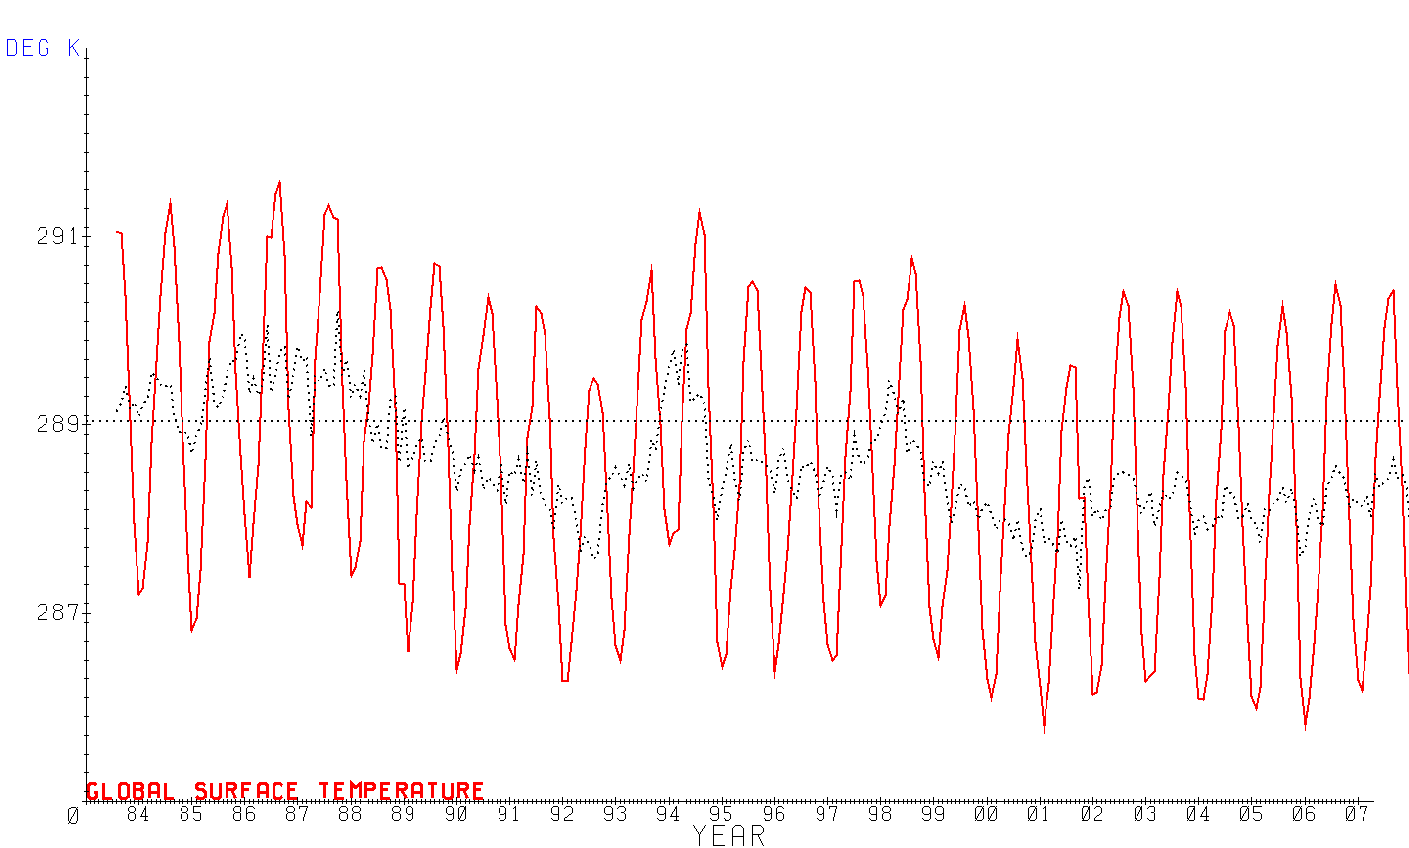
  10. Bibliovermis, Do you know the difference between an anomaly plot and a temperature plot? This is a temperature plot. Notice the scales on the left. The actual data spans more than a 5C range and has no averaging applied. An anomaly plot shows the difference in the monthly average to the expected monthly average for that month. The limits of this are only about 1C over the same interval. In my plots, the dotted black line is the running 12-month average. The actual data from Nasa looks like this, Notice the discontinuity around 2001? This is when NOAA-14 was replaced by NOAA-16 and baseline shifted by about 2C and which I have corrected in my data. The calibration error would be misinterpreted in an anomaly plot as an anomalous warming trend, but is actually representative of a data anomaly. This is my issue with anomaly analysis. You can't distinguish between a data anomaly and an anomalous trend.
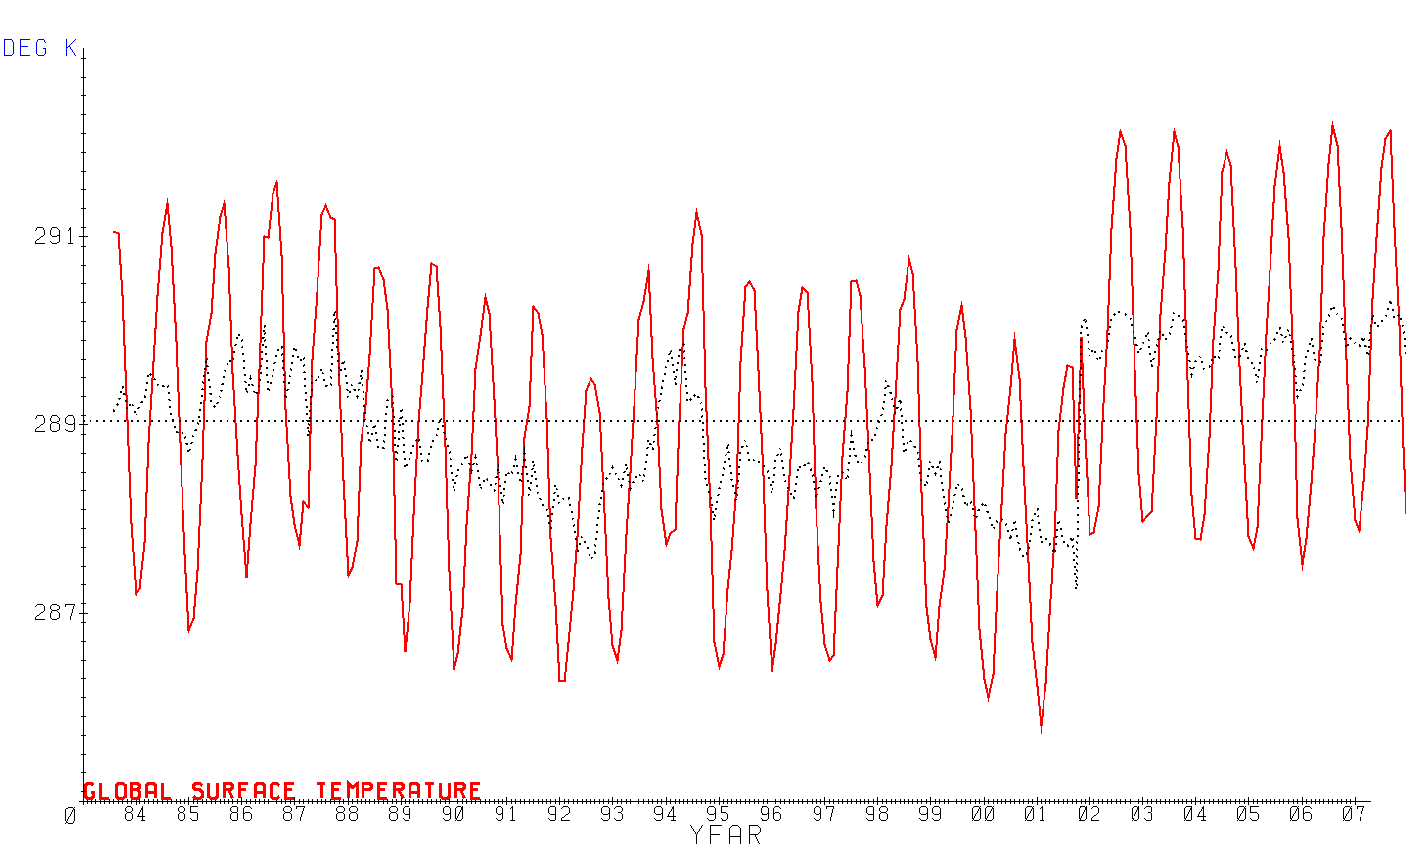
  11. That is one of the reasons why anomaly plots are used instead of absolute temperature plots, precision vs accuracy.
  12. @George White: where did you get these graphs? They do not seem to agree with any temperature graphs out there (including NOAA's). Perhaps you made them yourself, and have failed to spot an error in your calculations? Why not have your theories published and peer-reviewed, if you are so adamant about being right?
  13. archdiesteel, The data comes from isccp.giss.nasa.gov and I plotted the graphs from my climate simulation tool, CSIM, which integrates hierarchically gridded modeling with verification from satellite data, paleo data and a whole lot more, including replicating much of the ISCCP tool chain for processing weather satellite images where I use HITRAN 2008 driven 3-d atmospheric modeling, rather than the simple heuristics used by ISCCP, for extracting equivalent temperatures from IR brightnesses. The data in these plots is directly from the ISCCP processed, D2 data set and not from my processed DX data. I only subtracted out the bias in the first plot, although my analysis of the DX data (after recalibration) for months around where NOAA-14 transitions to NOAA-16 validated the profile of the bias. As I said in a deleted post, Rossow privately acknowledged this error and said it would eventually be fixed. For some reason, this rather large error has never been fixed or put in the errata, even though later reported errors have. I first brought this to his attention over 3 years ago. At the time, I even complained that I had seen some people using his data misinterpret the data anomaly as an anomalous warming trend. It's my understanding that many more are using this data now. New data based on 10 km sampling is supposed to be forthcoming, and I have been told that the error should be fixed, but the new data seems to be delayed. Regarding Biblio's comment. Anomaly analysis increases precision at the expense of accuracy, which is not the right direction to go. The even bigger problem is that you can't discriminate between anomalous data (meaning bad data) and an anomalous trend. The problem here is that the one month big anomaly that arose because of a baseline shift manifests itself as anomalous warming trend. Regarding publishing. Publishing in a 'legitimate' climate related publication is horribly stacked against anyone going counter to the consensus, that's not to say that I don't have a plan ...
  14. @co2isnotevil: discussing the reliability of measurements (never mind that different measurements provide pretty much the same picture) is off-topic, and belongs in another thread. Of course, when one makes his own climate simulation tool, one can get all kinds of results. Until your tool has been validated by others, we have now way of knowing how accurate it is. As for your conspiracy theories on publishing scientific papers, they are the hallmark of the pseudo-scientific quack. If your theory is good, it will stand up on its own. The fact that you have yet to publish it makes me think you are simply afraid it will get thoroughly rebutted, and you'd rather keep your very subjective view of the science intact. Sorry. It is up to you to prove what you claim. Right now, we are all a little skeptical about your claims, and with good reason.
  15. When the trend is more important than the value, precision is more important than accuracy. High accuracy with low precision can lose the trend in the measurement noise. The trend is more important than the absolute value when determining climate sensitivity. Academic inertia is countered with new, independently validated, empirical observations and/or new explanations that better describe the observations not conspiracy notions.
  16. archiesteel, I've seen good papers get completely gutted because the 'peers' who reviewed it didn't like the conclusions. I prefer interactive review with known individuals, rather than the anonymous review often utilized for climate papers. Anonymous review just doesn't work when the topic is controversial and your position goes against the consensus, but it's OK for more accepted mainstream science. You can bark all you want about the science being settled, but the truth is climate science is the most controversial branch of science around. BTW, I never called it a conspiracy, you did. If you want to use that word, perhaps a inadvertent conspiracy of flawed group think would be more appropriate. I have to believe that scientists pushing the catastrophic point of view must believe what they are saying. The problem is they don't have enough information to know for sure and the reality of the situation is they are just guessing based on a 'gut feeling'. Science isn't about gut feelings, but about logic, data and first principles and all of this is turning decidedly against the gut feelings driving climate alarmists. Relative to what my climate tool does with the ISCCP satellite data. all I'm doing is plotting the NASA data. And as I told you, the errors I pointed out have been acknowledged by Rossow, who is one of the principles of the ISCCP project and wrote much of their SW. BTW, I had to do a lot of reverse engineering of the error before Rossow would even acknowledge the problem, but he finally did admit to the programming error that led to this problem. He response was, 'Well, you can't use ISCCP data for identifying trends'. The reason seems clear since when you fix these issues, no warming trend is observed and if anything, there's been a small cooling trend over the last 10 years.
  17. Biblio, Precision does no good when the trend you are looking for is smaller than the data uncertainty. Consider a model that says 2+2 = 5 +/- 1. This is technically correct since 2+2=4 and that's within the uncertainty. Can you see what happens when you increase precision without increasing accuracy? You end up with a result like 2+2 = 5 +/- 0.25, which while more precise, is no more accurate than the first result and in fact the real answer is outside the uncertainty of the result.
  18. Your example concerns an absolute value. I was explicitly discussing a trend. If you are going to contribute, please read what you are replying to. Focusing on absolute values when discussing climate sensitivity is less than helpful.
  19. @co2isnotevil: "I've seen good papers get completely gutted because the 'peers' who reviewed it didn't like the conclusions." Hogwash. More likely, the paper was poor but you felt it was unjustly treated because you agreed with its conclusions. In any case, that's hardly an excuse not to have your theories published and reviewed. "Anonymous review just doesn't work when the topic is controversial and your position goes against the consensus, but it's OK for more accepted mainstream science." Again, conspiracy theories. "Oh, but if only those meanies stopped me from propagating the truth..." Seriously, that's not a defense, that's simply an acknowledgement that your theories aren't sound enough to gain approval. "BTW, I never called it a conspiracy, you did." You clearly implied it. "If you want to use that word, perhaps a inadvertent conspiracy of flawed group think would be more appropriate." Ah, so scientists aren't part of a large conspiracy, they're just idiots who are swayed by groupthink instead of logic - except for you, of course! Give us a break... "I have to believe that scientists pushing the catastrophic point of view must believe what they are saying. The problem is they don't have enough information to know for sure and the reality of the situation is they are just guessing based on a 'gut feeling'." Incorrect. There is ample evidence that AGW is real, and happening. Satellite measurements of OLR is just one of them. As I said before the burden of proof is on you, and you have failed. Discrediting honest, hard-working scientists to paint yourself as the only voice of truth isn't helping. In fact, it's showing your true colors, and they're quite ugly. "The reason seems clear since when you fix these issues, no warming trend is observed and if anything, there's been a small cooling trend over the last 10 years." Again, that seems very unlikely since *every* other record shows a warming trend. What's more likely, that everyone else is wrong and that this single instance really means the opposite of what it's supposed to mean, or that everyone is right, notwithstanding a single point of measurement was inaccurate? I'm sorry, but at this point there is no reason to believe your unreviewed theories over the accepted science - and it is, in fact, accepted. The only reason it is "controversial" is that Energy companies such as Koch Industries have funnelled millions into contrarian groups (and that's no conspiracy, we have a clear money trail).
  20. co2isnotevil, Re: the ISCCP data. Problems with this dataset have been noted in the peer-reviewed literature since at least 2000, and the specific problem you cite was even mentioned in the Trenberth paper that was discussed earlier in this thread. So please, drop the "crusader for truth" act. You haven't uncovered some secret flaw in the mainstream science. As you can see - and contrary to your insinuations - the mainstream science is perfectly capable of applying critical thought to its own claims. You also neglected to mention (or didn't realize) that the ISCCP data isn't used to construct any of the standard global temperature reconstructions. These come from entirely different microwave sensors and are produced by the RSS and UAH, one of which is led by your fellow skeptic Roy Spencer. The ISCCP data is primarily used to evaluate cloud data, which is evident from their own project overview. >Anonymous review just doesn't work when the topic is controversial and your position goes against the consensus Applying greater scrutiny to those who oppose the consensus is precisely how it's supposed to work. It follows from the principle that "extraordinary claims require extraordinary evidence," and prevents solid science from becoming obscured by a constant influx of fringe theories. Every great revision of scientific consensus in the modern era has had to overcome the same difficulties, why should your ideas receive any less scrutiny? Really, your entire criticism of the peer review process is nothing more than a subtle Galileo fallacy. Honestly, it is very admirable that you are seeking to produce your own analysis, but if you expect anyone to take your ideas seriously you are going to have to subject them to a bit of rigor. That you would expect otherwise suggests a very inflated sense of self-importance.
  21. How about this one-sided moderation, Huh? You made my point about one sided review ...
    Response: [Daniel Bailey] And your point is...? Only comments in violation of the Comments Policy get deleted. Stay on topic, accept responsibility for the content of your comments and bring a strong logically constructed argument with links to peer-reviewed supporting sources to lend credibility. Blaming moderators, being off-topic and saying inflammatory things about others mandates moderator intervention. That's life.
  22. Lindzen is now posting a few opinion pieces, including this one on GWPF ("The GWPF's primary purpose is to help restore balance and trust in the climate debate that is frequently distorted by prejudice and exaggeration"). It's been reposted on WUWT, not surprisingly. In this piece he states that "the climate's changed before", "it's not bad", "no warming since 1995", "environmental groups gathering power", etc. The 2010 version of L&C is available here, if you wish to read it. No changes were made in terms of extra-tropical heat exchange - they're apparently still using the 2001 model. They have stated that Pinatubo has an effect on forcings, though, which does address one of the Trenberth 2009 objections.
  23. More from Spencer, who appears to be doing for his blog the sort of data-fiddling that Statistics 101 teaches against. I wonder if he's submitting this to a journal? "....The “best fit” I got after about an hour of fiddling around with the inputs is represented by the blue curve in the above chart. Importantly, the assumed feedback parameter (5.5) is solidly in “negative feedback” territory....." You know how to find it: ~2011/01/update-further-evidence-of-low-climate-sensitivity-from-nasas-aqua-satellite/
  24. Lindzen and Choi, after having been rejected by Proceedings of the National Academy of Sciences, has managed to get published in Asian Pacific Journal of Atmospheric Sciences. I'll note that Asian Pacific Journal of Atmospheric Sciences has an impact factor of 0.355, as opposed to the only number I could find for Energy and Environment, 0.42 (4 citations a year). The reviewers comments from NAS are about what could have been expected; failure to perform sensitivity analysis on time periods used, failure to address extra-tropical heat transport, insufficient information to replicate the work, etc.
  25. Those PNAS reviewer comments really tore Lindzen's paper apart.

Prev  1  2  3  4  5  6  7  8  9  10  11  12  13  14  15  16  17  18  19  20  Next

Post a Comment

Political, off-topic or ad hominem comments will be deleted. Comments Policy...

You need to be logged in to post a comment. Login via the left margin or if you're new, register here.

Link to this page


The Consensus Project Website

THE ESCALATOR

(free to republish)


© Copyright 2024 John Cook
Home | Translations | About Us | Privacy | Contact Us