


 Arguments


What is causing the increase in atmospheric CO2?
What the science says...
| Select a level... |
 Basic
Basic
|
 Intermediate
| |||
|
Many lines of evidence, including simple accounting, demonstrate beyond a shadow of a doubt that the increase in atmospheric CO2 is due to human fossil fuel burning. |
|||||
Climate Myth...
CO2 increase is natural, not human-caused
"Salby is arguing that atmospheric CO2 increase that we observe is a product of temperature increase, and not the other way around, meaning it is a product of natural variation..." (Anthony Watts)
At a glance
Do you believe in the Tooth Fairy? A mysterious entity that turns up when people are sleeping, to remove unwanted things and replace them with something nicer? Because, you see, Murry Salby's ramblings require a Tooth Fairy to help him out. Let's take a look.
Murry Salby was a briefly popular character in the circus that is organised climate science denial, with the same few dozen names cropping up repeatedly in books, conferences, speaking tours and so on. If Salby was right, the army of scientists that have worked on the carbon cycle over many decades must have missed something glaringly obvious. They have not.
The fast part of the carbon cycle is represented by the annual near-symmetrical 'wiggle' on graphs of CO2 concentration. The peaks and troughs of the wiggle pretty much cancel one another out. This is unsurprising when one considers their source - the living world and particularly plants.
Plants take in CO2 when they are in the growing season - so the concentration falls by a few parts per million (ppm), hence the troughs. In the depths of winter, many plants die or enter dormancy and the opposite happens, hence the peaks. The sizes of the peaks and troughs both fluctuate together depending on things like certain natural climate cycles. For example, in the well-known El Nino Southern Oscillation, vegetation takes up more CO2 during La Nina.
There's also the slow carbon cycle that operates over geological time-spans of thousands to millions of years. We have a range of tools with which to interrogate the record of the slow carbon cycle. An obvious one is air bubbles trapped in ancient glacial ice and sampled from ice-cores. Over pre-industrial Holocene times (11,700 years ago-recent), CO2 concentrations show little variation - an erratic 20 ppm (or about 7%) increase over all that time. That suggests the net natural CO2 flux was small: what the planet was putting into the atmosphere was largely taken back out. Going back further, into the glacial-interglacial cycles, we see that CO2 fell to less than 200 ppm in the ice-ages and in the milder interglacials it rose to about 280 ppm. That was the case from at least a million years ago.
Now, all of a sudden, CO2 has shot up to around 420 ppm since the late 19th Century. It's gone up 50% in less than 150 years. What's the big difference about the world now and the one over the previous million years? The answer is the intensification of the industrial era, post-1950. Back then we were emitting 6 billion tonnes of CO2 per annum. That figure has now risen to 44.25 billion tonnes a year - it's gone up more than sevenfold.
If you still insist the recent CO2 increase is not due to human activity, you need to make that 44.25 billion tons of emissions per annum (and rising) magically disappear somehow. That's where the Tooth Fairy has to come to your aid – and as any rational person knows, it doesn't in fact exist.
Please use this form to provide feedback about this new "At a glance" section. Read a more technical version below or dig deeper via the tabs above!
Further details
Atmospheric CO2 has increased by more than 140 parts per million (or 50% if you prefer) since the Industrial Revolution when humans began burning fossil fuels like coal and oil in earnest. Human industrial activity has increased atmospheric CO2 to levels not seen for at least 800,000 years (fig. 1).
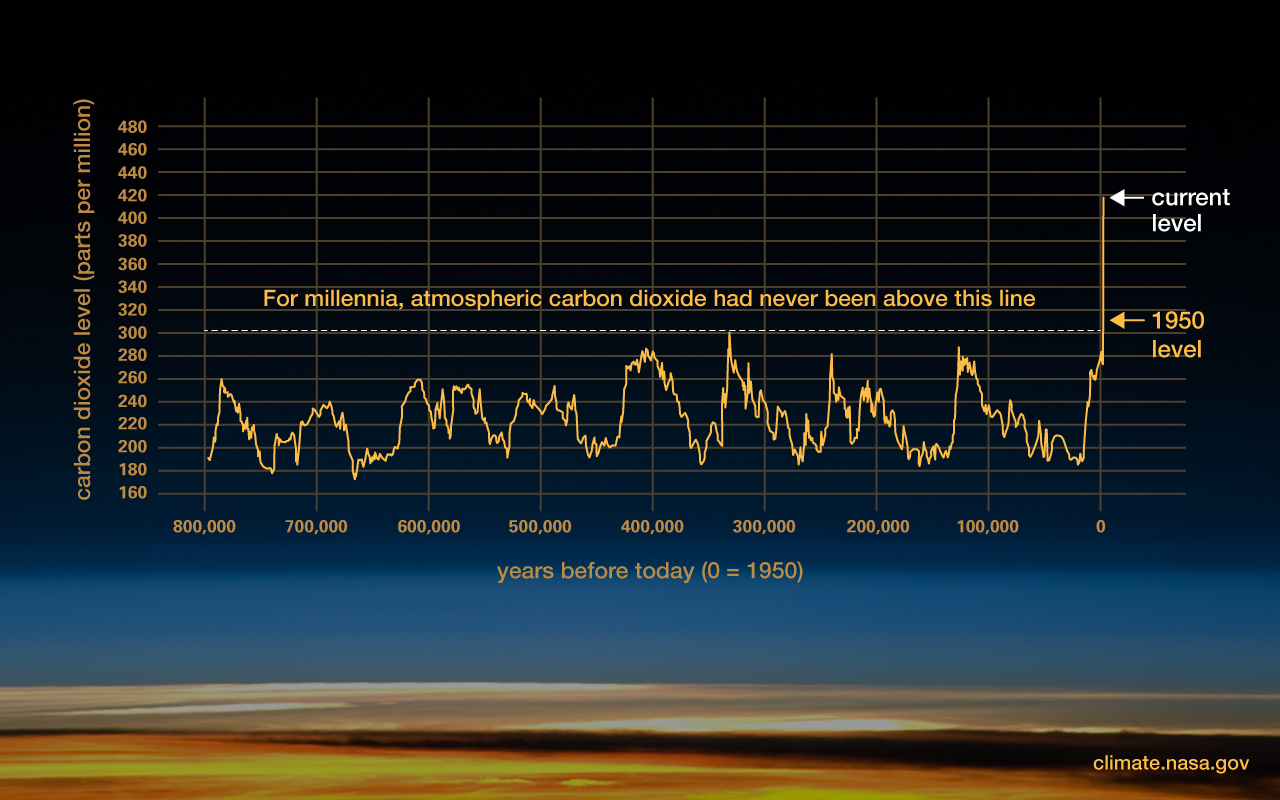
Figure 1: Atmospheric CO2 concentrations in parts per million (ppm). Levels have peaked regularly throughout recent geological time but we’ve seen a steep increase of 140 PPM since the industrial revolution. Graphic: Climate.NASA
Carbon moves between the atmosphere, oceans, biosphere and solid Earth in various processes that, in combination, are called Earth's Carbon Cycle. The Carbon Cycle has operated in one form or another since Earth came into existence. It has mostly been stable, allowing advanced life to develop and flourish here.
Salby was well-known for insisting humans are not the cause of the recent 50% CO2 increase, citing 'natural variation'. Technically, Salby's arguments involve the fallacy of 'slothful induction'. That means ignoring relevant information in order to come to a conclusion. Put more simply, where on Earth does Salby think our 44,000 million tons of CO2 emissions per year (as of 2019) actually end up? Is there some kind of secret galactic plughole they vanish down, never to return?
Slothful induction involves blindly ignoring multiple sources of evidence that burning fossil fuels has increased CO2 levels in Earth's atmosphere. We know 'natural variation' is not the source of growing CO2 levels in the atmosphere because land and ocean CO2 storage has increased. How do we know?
Most of Earth’s carbon is stored in the rocks making up the solid Earth (Fischer et al. 2020). The rest is in the ocean, the atmosphere and the biosphere. Oceans form an important store, so if all the recent atmospheric CO2 increase were 'natural' - and that would involve fossil fuels having never been exploited - the oceans would be one obvious source. But we know the CO2 increase is not coming from the oceans because the pH of the oceans is dropping. The oceans are instead absorbing increased CO2 and that process leaves a fingerprint, known as ocean acidification.
Ocean acidification works thus: when CO2 is dissolved into sea water, it binds with a water molecule to form a molecule of carbonic acid (H2CO3). The acidifying effect is due to 95% of that carbonic acid turning into bicarbonate ions [HCO3-]. Every time a carbonic acid molecule splits into bicarbonate, a hydrogen ion (H+) is also liberated. The more CO2 is absorbed into the oceans, the more the above process goes on and the more H+ ions are produced, so that the ocean pH decreases. Falling oceanic pH thus shows that our oceans are absorbing more carbon than they are releasing.
Isotopic Signature Shows Increased Fossil Fuels Emissions in Atmosphere
Another smoking gun is that carbon isotope chemistry points squarely at fossil fuels as the source of CO2 emissions. Carbon is composed of three different isotopes: carbon-12, carbon-13 and carbon-14. Carbon-12 is by far the most common (98.9%), while carbon-13 makes up most of the rest. Carbon-14 is in contrast only a tiny fraction of the total.
All photosynthetic plants preferentially process the lighter carbon isotope, carbon-12. This is because in some of the chemical reactions involved in photosynthesis, the energetics favour light carbon over carbon-13. As a consequence, plant tissues have relatively low carbon-13 to 12 ratios, compared to the bulk Earth.
Animals eat plants or each other, ensuring that the low carbon isotope ratio spreads out through food-chains. Now, as we know, fossil fuels are derived from ancient organic matter consisting of plant and animal-remains. It follows that fossil fuels carry that same biogenic carbon-13 to 12 ratio. So if we dig up and set fire to those fossil fuels, that isotopic signature is passed on into the resultant CO2. In that way, it transferred into the atmosphere.
Reconstructions of atmospheric carbon isotope ratios are made from various geological sources. Common examples are ice cores and marine carbonate sediments of known age. Such records have determined that the carbon-13 to 12 ratios in the atmosphere are currently the lowest in the last 10,000 years. In addition, the carbon-13 to 12 ratios begin to decline dramatically just as CO2 started to increase after around 1850 AD (fig. 2). This is exactly what we would expect if the increased CO2 is due to fossil fuel burning.
In addition, these isotopic observations confirm that the increase in atmospheric CO2 comes from plant-based carbon, not from the oceans or volcanoes (Quay et al. 1992). Magmatic CO2 has a near-bulk Earth isotopic composition.
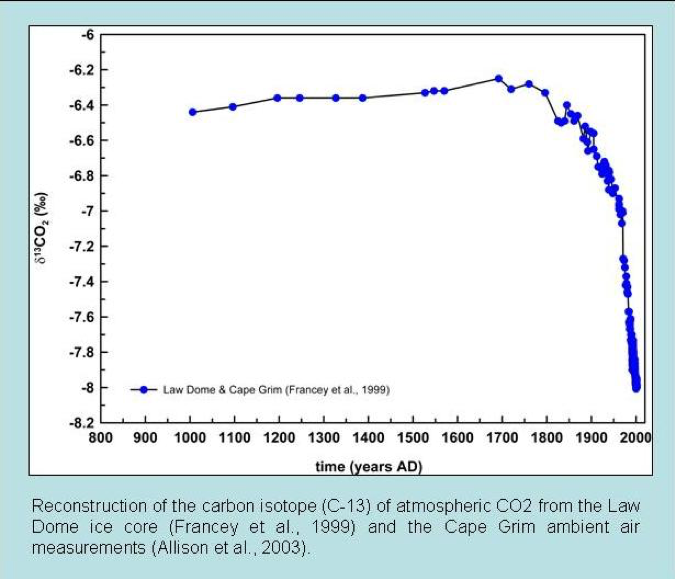
Figure 2: Ice core carbon isotope measurements of atmospheric CO2 over the past twelve centuries (Francey et al. 1999).
Some argue that the biogenic carbon-13 ratio isn't unique to fossil fuels. They're missing something else here and that's where carbon-14 puts in a guest-appearance. Due to the very short half-life of carbon-14 - just a few thousand years - ancient biogenic carbon, millions of years old, contains hardly any of it. But as we burn more and more gigatons of fossil fuels, that ancient biogenic signature is diluting the tiny amount of carbon-14 up there in the atmosphere. This is not new science either, it's something we've known for over half a century (Revelle & Suess 1957), and there have been many studies confirming these results, for example, Levin & Hesshaimer (2000).
Fossil fuel burning is the key reason for the recent 50% leap in atmospheric CO2 levels. More evidence, if you need it, is presented in the Intermediate rebuttal. But the conclusion should already be obvious. Due to our fossil fuel-burning activities, CO2 levels have surged upwards. Science-deniers try to sweep this glaring fact under the carpet, but their arguments simply don't hold water.
Last updated on 10 December 2023 by John Mason. View Archives


I'm having a little trouble getting some math to come out right. CO2 concentration is rising by 2 ppmv/year. The net flux is given as 15 gigatons/year.
For the surface area of the earth I take a radius of 6.4e6 meters to get an area of 171e12 m2. I convert 14.7 lb/in2 atmospheric pressure at sea level to a metric value of 10.35e3 kg/m2 or 10.35 ton/m2. When I multiply those together, it comes out to 1.771e15 tons for the total weight of the atmosphere. One ppm of that would weigh 1.771e9 tons or 1.771 gigatons.
The atmosphere is primarily molecular nitrogen. Each molecule has a weight of 28. The weight for CO2 is 44. This brings the weight of one ppm by volume up to 2.78 gigatons. The increase of concentration given in the article, 2ppmv/year would represent a weight of 5.56 gigatons. This is low by a factor of almost three from the value of 15 given in the article.
What am I missing?
@26
Area wrong. Should be pi times 4 , not pi times 4/3 .
Eclectic
Thank-you. It has been a few years. I was confusing the area and volume formulas.
The arguments presented are helpful and fairly comprehensive, but I was surprised the author, dana1981, did not address what, in my view, is the most important scientific publication on this issue: “The phase relation between atmospheric carbon dioxide and global temperature” by Ole Humlum, Kjell Stordahl and Jan-Erik Solheim in Global and Planetary Change 100: 51-69, 2013. These authors showed, using published temperature time series from multiple sources and global CO2 and anthropogenic CO2 data that, for the years 1980 to 2011:
1. There was a good temporal correlation between global CO2 and ocean temp, land temp, global temp and lower troposphere temp BUT the global CO2 FOLLOWED the ocean temp, then the land temp, then the lower troposphere temp, in that order, with lags of 9-12 months.
2. In contrast, there was poor temporal correlation between anthropogenic CO2 emissions and both global CO2 and temperature.
3. While anthropogenic CO2 was emitted overwhelmingly from the northern hemisphere, the time sequence of ocean temperature variation commenced in the Southern Hemisphere, reasonably close to the equator, then spread north and south to the poles, always preceding the global CO2 time sequence.
These carefully determined temporal sequences and correlations, based squarely on the published temperature and CO2 data, clearly indicate a causal sequence in which global temperature changes PRECEDE global CO2 changes by 9-12 months, commencing with changes in the ocean surface temperature, then the land temperature, then the lower troposphere temperature. These observations are the complete OPPOSITE of what should be expected if anthropogenic CO2 emissions were driving both the global CO2 levels and then causing a secondary increase in temperatures.
So, while I appreciate the energy balance and other arguments advanced above, causality requires a demonstrated temporal sequence of changes that the data I describe here simply do not support. I would be very interested in your explanation for these observations.
[TD] Humlum is wrong. Type "Humlum" into the Search field at the top left of this (or any) SkepticalScience page.
mkrichew:Having difficulty understanding how 2.4 ppm change annually ( or 19 billion tons ) atmospheric CO2 translates to delta Catm = 18 billion tons.
mkrichew @30,
I would say it is a bit lax to substitute 18 for 19 within the OP but given the situation the OP describes, it makes zero difference to the argument presented. The "19 billion tons" figure in the OP is described as "roughly" the ΔCatm required to give a +2.4ppm(v) increase which is given as the rate of CO2 increase "recently."
We could be more precise and say that a +2.4ppm increase would require ΔCatm = 18.7 Gt(CO2), but given the wobbles caused by ENSO to the annual increase in atmospheric CO2, it is impossible to be that precise about it. The OP was written in 2012 and the source of the MLO CO2 data cited ESRL give a value for the 2012 annual MLO CO2 increase as +2.61ppm = 20.4Gt(CO2) although if the average of the 12-month increases through 2012 is used to calculate a value the result is +2.20ppm. Or if the ESRL Global data is used instead of MLO data, ΔCatm for 2012 is given by ESRL as +2.39ppm while tha average of the months yields +2.00ppm =15.6Gt(CO2). Or an alternative source of the value would be the Global Carbon Project's 2012 ΔCatm of 5.07Gt(C) = 18.6Gt(CO2) (altough note the 2012 LOC emissions are a long way from zero which is the assumption made in the the OP).
Thank you for your kind response. As you may have guessed I am the author of the Mike Krichew Theory of What Causes Ice Ages which I wrote sometime after Al Gore released his documentary "An Inconvenient Truth" and conservative elements responded as President Trump did, suggesting a conspiracy. At the time I suggested a comet tail reflecting sunlight might account for the increased insolation that would warm the oceans causing an increase in the atmospheric CO2 levels which would warm the atmosphere and further warm the oceans. At the time I was not much of a believer in the Milankovitch cycles theory. However, the other day it occurred to me that if the earth is indeed an oblate speroid or ellipsoid in shape then it may be possible for the earth to present different size cross-sectional areas to the sun during the cycle. This would result in different insolations. Someone with a talent for mathematics might show the different cross-sectional areas if it has not already been done. Someone else with an interest in celestial science might calculate where the minimums and maximums of cross-section occur and plot them on the slightly sinusoidal graph of climate change over time. If there is any correlation, it should then be possible to calculate and model the increased insolation that occurs during the cycle. If this has already been done, a reference would be nice.
[TD] Please copy and paste your comment into a relevant thread you find by typing Milankovich into the Search field at the top left of the page--for example, this one.
I have responded to mkrichew in the appropriate place.
Hello,
I have a question about the Suess effect. I read that with an airborne fraction of 55% and the isotopic signature of anthropic emissions of about -28‰, the calculated delta 13C is too low compared to observations. I am trying to find precise explanations about it.
Could you explain, or provide some sources where I could find information ?
Thank you !
Log @34 , my apology for not replying more promptly. I was hoping that someone more knowledgeable than me would respond to you.
My understanding is that the Suess Effect's major relevance is with radiocarbon dating, rather than with climate matters.
It would be helpful if you could clarify your question, by discussing it in more detail how you believe there are difficulties of comprehension of the planetary total carbon cycle. Perhaps you are seeking more precision than is required for verification of the mainstream scientific understanding of modern climate change.
Eclectic @35,
The Suess Effect is entirely to do with the carbon cycle and the 13C/12C ratio in the atmosphere.
Log @34,
Proper isotopic carbon analysis is in accord with what you'd expect (eg see Andres et al (2000) or Keeling et al 2005) to the point that it is being used to analyse the response in the biosphereto rising CO2 (eg Keeling et al (2017) 'Atmospheric evidence for a global secular increase in carbon isotopic discrimination of land photosynthesis').
Of course, that doesn't stop denialists using crazy ways of combining the various numbers for airborne fraction and the drop in 13C to find results more to their own liking. I've seen a few of them through the years but can't find any recent ones.
MARodger @36 ~ thanks for that. Sadly, my initial look into the Suess Effect merely turned up a lot of children's books.
Then, once I got onto the right path ~ it seemed that the 14C-radiocarbon story would be the only aspect of interest (for, as you say, there would not appear to be anything much concerning the 13C ratio which might raise any skeptical doubts in the mind of poster Log @34. )
Please note: a new basic level version of this rebuttal was published on December 10, 2023. It includes an "at a glance“ section at the top. To learn more about these updates and how you can help with evaluating their effectiveness, please check out the accompanying blog post @ https://sks.to/at-a-glance