Climate Science Glossary

Term Lookup

Enter a term in the search box to find its definition.

Settings

Use the controls in the far right panel to increase or decrease the number of terms automatically displayed (or to completely turn that feature off).

Term Lookup

Settings


All IPCC definitions taken from Climate Change 2007: The Physical Science Basis. Working Group I Contribution to the Fourth Assessment Report of the Intergovernmental Panel on Climate Change, Annex I, Glossary, pp. 941-954. Cambridge University Press.

Home Arguments Software Resources Comments The Consensus Project Translations About Support

Twitter Facebook YouTube Mastodon MeWe

RSS Posts RSS Comments Email Subscribe


Climate's changed before
It's the sun
It's not bad
There is no consensus
It's cooling
Models are unreliable
Temp record is unreliable
Animals and plants can adapt
It hasn't warmed since 1998
Antarctica is gaining ice
View All Arguments...


Username
Password
New? Register here
Forgot your password?

Latest Posts

Archives

CO2 emissions change our atmosphere for centuries

What the science says...

Individual carbon dioxide molecules have a short life time of around 5 years in the atmosphere. However, when they leave the atmosphere, they're simply swapping places with carbon dioxide in the ocean. The final amount of extra CO2 that remains in the atmosphere stays there on a time scale of centuries.

Climate Myth...

CO2 has a short residence time

"[T]he overwhelming majority of peer-reviewed studies  [find] that CO2 in the atmosphere remained there a short time." (Lawrence Solomon)

The claim goes like this:

(A) Predictions for the Global Warming Potential (GWP) by the IPCC express the warming effect CO2 has over several time scales; 20, 100 and 500 years.
(B) But CO2 has only a 5 year life time in the atmosphere.
(C) Therefore CO2 cannot cause the long term warming predicted by the IPCC.

This claim is false. (A) is true. (B) is also true. But B is irrelevant and misleading so it does not follow that C is therefore true.

The claim hinges on what life time means. To understand this, we have to first understand what a box model is: In an environmental context, systems are often described by simplified box models. A simple example (from school days) of the water cycle would have just 3 boxes: clouds, rivers, and the ocean.

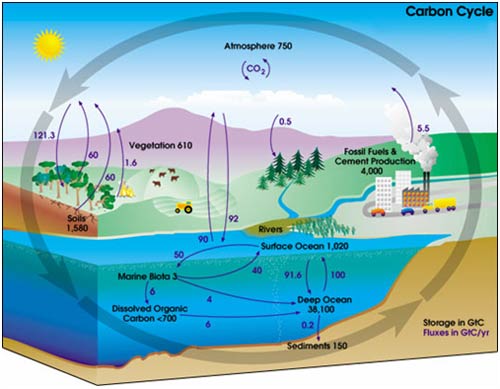
A representation of the carbon cycle (ignore the numbers for now) would look like this one from NASA.

In the IPCC 4th Assessment Report glossary, "lifetime" has several related meanings. The most relevant one is:

“Turnover time (T) (also called global atmospheric lifetime) is the ratio of the mass M of a reservoir (e.g., a gaseous compound in the atmosphere) and the total rate of removal S from the reservoir: T = M / S. For each removal process, separate turnover times can be defined. In soil carbon biology, this is referred to as Mean Residence Time.”

In other words, life time is the average time an individual particle spends in a given box. It is calculated as the size of box (reservoir) divided by the overall rate of flow into (or out of) a box. The IPCC Third Assessment Report 4.1.4 gives more details.

In the carbon cycle diagram above, there are two sets of numbers. The black numbers are the size, in gigatonnes of carbon (GtC), of the box. The purple numbers are the fluxes (or rate of flow) to and from a box in gigatonnes of carbon per year (Gt/y).

A little quick counting shows that about 200 Gt C leaves and enters the atmosphere each year. As a first approximation then, given the reservoir size of 750 Gt, we can work out that the residence time of a given molecule of CO2 is 750 Gt C / 200 Gt C y-1 = about 3-4 years. (However, careful counting up of the sources (supply) and sinks (removal) shows that there is a net imbalance; carbon in the atmosphere is increasing by about 3.3 Gt per year).

It is true that an individual molecule of CO2 has a short residence time in the atmosphere. However, in most cases when a molecule of CO2 leaves the atmosphere it is simply swapping places with one in the ocean. Thus, the warming potential of CO2 has very little to do with the residence time of individual CO2 molecules in the atmosphere.

What really governs the warming potential is how long the extra CO2 remains in the atmosphere. CO2 is essentially chemically inert in the atmosphere and is only removed by biological uptake and by dissolving into the ocean. Biological uptake (with the exception of fossil fuel formation) is carbon neutral: Every tree that grows will eventually die and decompose, thereby releasing CO2. (Yes, there are maybe some gains to be made from reforestation but they are probably minor compared to fossil fuel releases).

Dissolution of CO2 into the oceans is fast but the problem is that the top of the ocean is “getting full” and the bottleneck is thus the transfer of carbon from surface waters to the deep ocean. This transfer largely occurs by the slow ocean basin circulation and turn over (*3). This turnover takes 500-1000ish years. Therefore a time scale for CO2 warming potential out as far as 500 years is entirely reasonable (See IPCC 4th Assessment Report Section 2.10).

Intermediate rebuttal written by Doug Mackie


Update July 2015:

Here is the relevant lecture-video from Denial101x - Making Sense of Climate Science Denial

Last updated on 5 July 2015 by pattimer. View Archives

Printable Version  |  Offline PDF Version  |  Link to this page

Argument Feedback

Please use this form to let us know about suggested updates to this rebuttal.

Update

Updated 'the skeptic argument' on 02/05/2012 to correct formatting errors

Comments

Prev  1  2  3  4  Next

Comments 26 to 50 out of 94:

  1. Hi Dan, Thanks for the response. First, I have patience and no virtues. Second, you don't have to convince me. But, the numbers do not add up in the NASA OCO article. Clearly, a 1% annual increase in atmospheric CO2 ppmv from 1970 to 2010 (with a 1970 value of 326 ppmv) would result in a in 326*1.01**40=485 ppmv in 2010. But the CO2 concentration in 2010 is 389 ppmv. The best I could do was assume that only 43% of the CO2 remains in the atmosphere, so that the math becomes 326*1.0043**40=387. That is the right number, but I'm not convinced. It strikes me that NASA has been a little sloppy here, even if I am right. The deniers go nuts over stuff like this--they think it's a proof that AGW advocates are lying. It becomes a real problem when we shoot *ourselves* in the foot. koy
    Response: I don't understand. You get the right number, so why are you unconvinced?
  2. The OCO site Koy links is indeed misleading. One percent annually, starting at 326 ppm, means a >3ppm increase in year one. That didn't happen. It's now (391) increasing at ~2.5 ppm per year, which is still less than 1% per year. The real increase is bad enough, why the fuzzy math?
  3. The OCO site won't load for me. Anyway, NASA isn't involved with tracking CO2 at Mauna Loa; NOAA is in charge of that. So I'd stick with the experts. As far as CO2 measurements & their reliability, SkS has a post on that here. For further reading: http://www.aip.org/history/climate/co2.htm http://scrippsco2.ucsd.edu/program_history/keeling_curve_lessons.html The Yooper
  4. I get the right number by not using the NASA supplied 1% increase in annual atmospheric CO2 concentrations. But is my reasoning correct???? That is the big question for me. If I can't defend the reasoning, I don't stand much of a chance in converting the skeptic who thinks NASA lied. Not that I've ever converted a skeptic.
  5. Koy: Go to NOAA for CO2 data; skip this NASA site question altogether.
  6. @muoncounter I've been to NOAA, downloaded and spread-sheeted annual CO2 ppmvs and increments for 1950 to 1020. I've calculated increments for each year from consecutive annual ppmv averages (kinda agree with NOAA's). I've calculated % ∆ppmv change for each year. I've calculated average ∆ppmv and %∆ppmv for 1959 to 1020 and 1970 to 2010. I get an average %∆ppmv of 0.45 from 1970 to 2010. That's good. I still don't know where NASA's 1% annual ppmv increase (average) comes from. What is that number? I've emailed NASA and OCO--no answer yet. My NASA OCO link above works..I just double checked. If I can't defend my number I'm on no more firm ground than a skeptic, and that's a very uncomfortable place to be.
  7. Re: koyaanisqatsi (31) I suspect an issue exists in terminology (see here for discussion). D Kelly O'Day has an excellent post on CO2 here. Quality posts on the subject at SkS can be found here and here. The Yooper
  8. koy: There's nothing to 'defend'. CO2 data comes from NOAA (and several other sources in other countries, Japan has a really good site); you should urge your friend to stop characterizing things as 'lies'. That sort of language doesn't help the conversation.
  9. @Daniel Bailey (32) My first response to the NASA article ( link in my comment 22) was that NASA had either worded things awkwardly or I had missed something. It says what it says. I can't find anything out there that states that total CO2 emissions are increasing by 1%/year. The paper "A Tutorial on the Basic Physics of Climate Change" (Hafemeister and Schwartz) calculates emissions resulting in a CO2 concentration growth of about 3.3 ppmv (about 1%) and then states that this is about twice what is observed, stating that about half (my 57%) goes into sinks in oceans and on land and ends up with 1.4 ppmv/year increase. The numbers all work except for the 1%. The skeptic acquaintance attributes the 1% to NASA's lying. Yes--LYING. No big deal. But credibility is lost when can't defend an apparent inaccuracy that supports your case or you make a mistake you don't admit. If the science of AGW is to strong, then it should be easy to defend it.
  10. The short urls post has reminded me I have been remiss in not responding here. Some responses: @16 CBDunkerson re oceans soaking up the rest if we stop emitting today. The oceans only absorb because of the difference (disequilibrium) between atmosphere and surface ocean. Crudely simplifying the greater the difference the greater the absolute uptake by the oceans. Problem 1: Climate ‘inertia’. e.g. realclimate Problem 2: Ocean acidification (a focus of my own research group). e.g. the other problem various from drrocket: Incoherent runny bum dribble. Not even sure what you are trying to say. @22 koyaanisqatsi Other commenters are correct; it is not the best idea to get hung up on a single paragraph written for a mass audience compared to the actual data set. When I write a cheque then if there is a difference between the words and the figures then they trust the words because it is easier to make a mistake with figures. Plainly the 1% comes from someone else interpreting the data. I suspect that paragraph is the victim of rounding or that your +oceans interpretation is correct. The paragraph reads as if it has been written by a technical writer as opposed to a mission scientist. I recall a similar discussion years ago with someone who had a dodgy claim and would not accept any rebuttals from peer reviewed journals because they were not authoritative sources like “New Scientist”. Yes, perhaps the paragraph lends itself to misuse by deniers but I take it your friend is similarly critical of denialist writings?
  11. Eric (skeptic), 7:01 AM, 2/16/11, CO2 has a short residence time This thread, CO2 has a short residence time updated 6/26/10, and the Seawater Equilibria thread of 1/10/11, are companion pieces. The first debunks IPCC's elementary formula for the physics of residence time to make room for complex ocean equilibrium theory IPCC applies to the ever-changing surface layer of the ocean. You appeal to this theory for the proposition that a warming ocean can be a net sink of CO2. IPCC uses it instead to create a model in which all of the following hold: (Claim 1) Natural CO2 is far more soluble than anthropogenic CO2, so the ocean absorbs 100% of the ~90 Gtons/yr of nCO2 from the ocean, but only half the ~8 Gtons/yr of ACO2; (Claim 2) Henry's Law coefficients differ between the isotopes of CO2 so that it separates (fractionates between) nCO2 from ACO2; (Claim 3) Henry's Law coefficient for ACO2 in water no longer depends on the established parameters of temperature, pressure, and salinity, but dominantly on the equilibrium chemical state of carbonates in the water; (Claim 4) Adding CO2 acidifies the surface layer of the ocean; (Claim 5) The rate of ACO2 dissolution depends on the rate of sequestration of CO2 through the organic pump and the calcium carbonate counter pump; (Claim 6) Thus ACO2 is long-lived in the atmosphere, with a residence time measured in decades to centuries instead of a few years according to the IPCC formula; (Claim 7) Therefore CO2 is well-mixed in the atmosphere; (Claim 8) Hence MLO CO2 measurements are global, not regional; (Claim 9) Therefore calibrating CO2 concentrations from all measuring stations to comport with MLO is valid; (Claim 10) All the calibrated CO2 measurements over the globe agree, validating that the MLO record is global; (Claim 11) Therefore the bulge in CO2 measured at MLO over the last half century is man made; (Claim 12) Therefore the coincidental global temperature rise over the last half century is anthropogenic. All these claims flow from the assumption that the surface layer is in thermodynamic equilibrium. Seawater Equilibria by hfranzen begins, The audience for whom this piece is intended consists of people who know some chemistry and are uncertain about how to consider the often made claim by deniers that the oceans contain so much dissolved carbon that human production is inconsequential. It then undertakes a derivation that includes this line: Algebra then yields the molalities of the remaining solute species at 288K, specifically the equilibrium molalities of CO2(aq), HCO3^-(aq) and CO3^2-(aq), as well as the other species, are determined for the average ocean. This is IPCC's Fatal Error #3. IPDD's Fatal Errors. IPCC uses the same stoichiometric equations as hfranzen (AR4, Box 7.3, p. 529), sourced to Zeebe and Wolf-Gladrow, 2001 (science for sale, Amazon, $94.34) (AR4, ¶7.3.4.1, p. 528). The latter shows that the solution to the equations using the stoichiometric equilibrium constants is given by the Bjerrrum plot. Reported in Wolf-Gladrow, D., CO2 in Seawater: Equilibrium, Kinetics, Isotopes, 6/24/06, chart 5. IPCC refers to a single point from the Bjerrum plot without ever mentioning it by name. However, the same two authors specify that these equations apply not in some vague equilibrium state, but In thermodynamic equilibrium. Bold added, Zeebe, R. E., & D. A. Wolf-Gladrow, Carbon dioxide, dissolved (ocean). Encyclopedia of Paleoclimatology and Ancient Environments, Ed. V. Gornitz, Kluwer Academic Publishers, Earth Science Series, in press 2008, p. 1. The surface layer is not in mechanical equilibrium, nor in chemical equilibrium, nor in thermal equilibrium, so it fails all three stringent requirements to be in thermodynamic equilibrium. Thermodynamic equilibrium means neither dynamic equilibrium nor steady state, as AGW proponents argue from time to time. Chemists evaluate equilibrium constants only at equilibrium. For example, here's a piece of from a UK workbook instructions for 16- to 19-year-old students on how to prepare samples for measuring equilibrium constants: Keep the bottles at 50 °C for about twenty minutes, shaking them frequently; then let them stand at room temperature overnight. Nuffield Physical Science workbook, Section 6 Chemical equilibrium, p. 340. Le Chatelier's Principle (p. 300) and the Equilibrium Law (p. 299) also apply. Id.. The Principle is If a system at equilibrium is disturbed by a change in temperature, pressure, or the concentration of one of the components, the system will shift its equilibrium position so as to counteract the effect of the disturbance. Le Chatelier's Principle (1888). Chem 002, Lecture VIII. The Law states that equilibrium coefficients are approximately constant at a given temperature. But nothing can be said about the state parameters, temperature (T), pressure (P) and reactant concentrations ({U_i}), of a system not in equilibrium. If the non-equilibrium (or disequilibrium) trajectory a system follows between equilibrium states could be quantified and predicted, Le Chatelier's state-of-the-art Principle, which only applies to the end points of the trajectory, would be obsolete. Because the state of a system is a vector in (T, P, {U_i}), the state cannot be ordered. No law analogous to the Equilibrium Law exists to provide a direction or bounds on concentrations in disequilibrium. As a result, and notwithstanding that the pH of the surface is known, the molalities of the carbonate system are unknown in the real ocean. The article's reference to the average ocean and IPCC's claim that the ratio of CO2:HCO3^-:CO3^2- in the surface layer is approximately 1:100:10 (AR4, Box 7.3, p. 529) are both meaningless. IPCC models the atmosphere as a buffer holding excess CO2 (actually ACO2) in order to create sufficient absorption to warm the climate. Instead, the surface layer should be recognized as the buffer holding excess CO2 in the unknown ratio of x:y:z with HCO3^- and CO3^2- so that dissolution can obey Henry's Law, and to supply ionized CO2 in solution for the biological pumps. (IPCC diagrams the pumps incorrectly as reacting with molecular CO2 in the air. AR4, Figure 7.10, p. 530.) With the principles of equilibrium honored, the laws of chemistry and physics can all be satisfied. The article attempts to disprove a straw man claim that human production [of CO2] is inconsequential with false science. In fact, for other reasons it is true The audience for whom hfranzen's piece is intended is no more knowledgeable than IPCC's Policymakers. It consists of people who nothing about equilibrium, much less equilibrium chemistry, or physics, and who accept IPCC's model, with all its false claims, as demonstrated by authority.
  12. drrocket, welcome back to the thread! I disagree with your item 1, that the IPCC is claiming different ocean uptake rates for NCO2 and ACO2. There is a slight isotope preference for vegetation uptake, but that is mostly cyclical (the same isotope ratios are released after the vegetation dies in the NH fall). Someone else will have to address your other items, but certainly item 7 (CO2 is well mixed) has much more evidence than you imply, in particular your item 10 which is verifiably true, not just a claim derived from your preceding items. Your denouement, "claim" 12, is one I might also argue with, but I would certainly consider more evidence than the single claim of thermodynamic equilibrium at the ocean surface. Are trying to prove your claim that CO2 rises are due to a warming ocean? If so, you still haven't addressed the point that net CO2 uptake can be positive in a warming ocean. That cannot be disproven by using local thermodynamic equilibria since those need to be integrated to determine the net effect. You certainly cannot use global average T, P, and other parameters to do this.
  13. "IPCC's Policymakers". What Policymakers are associated with the IPCC and what are they supposed to do?
  14. Eric (skeptic), 11:22 AM, 5/11/11, CO2 has a short residence time 1. Take a look at the air-sea flux in IPCC's carbon cycle for the 1990s here. AR4, Figure 7.3, p. 515. The natural fluxes in black, left to right, positive into the ocean, are 0.2-119.6+120-70.6+70 = 0. The anthropogenic fluxes in red are 2.6-1.6+22.2-20-6.4=-3.2 GtC/yr. In other words, 100% of nCO2 emissions are absorbed each year, but only 69.2% of ACO2 is absorbed per year. If the nCO2 and ACO2 uptake has the same mix as the emissions, then the absorption for 13CO2, x13, and correspondingly x12 must be equal to 1 for nCO2, and equal to 0.692 for ACO2, where 0 ≤ x_i ≤ 1. But how could x13 or x12 be aware of the origin of the species? The ratio of 13CO2 to the total CO2 is the variable R, and for the two species, R_n = 1.11123% (R_PDB) and R_A = 1.08101 ((1 + delta_13C)R_PDB = (1-0.0272)R_PDB). If we aren't particular about the mix of each species, then R_n*x13+(1 - R_n)*x12 = 1 and R_A*x13 + (1 - R_A)*x12 = 0.692. The solution, x13 = 1007.7 and x12 = -10.3, is not possible. 2. IPCC can't be pinned down on its well-mixed conjecture because it never quantifies what well-mixed means, (and because it has no mechanism to respond to challenges). IPCC ought to report the mixing as the variability in standard deviations divided by the average, or something equivalent, and then compare the ratio to a standard or requirement before qualifying it. IPCC admits that gradients exist in atmospheric CO2, detectable EW and an order of magnitude greater NS, which seems to be an admission that the gas is not well-mixed. IPCC shows that the ocean outgasses CO2 dominantly in the Eastern Equatorial Pacific, and absorbs a major portion in the polar regions, which are the headwaters of the thermohaline circulation. IPCC shows these effects in its Takahashi diagram. AR4, Figure 7.8, p. 523. However, the fluxes in the Takahashi diagram add to about an order of magnitude too small compared to IPCC's total fluxes in Figure 7.3. Deep, cold water saturated with CO2 is drawn to the surface by the Ekman suction on the Equator, where it is warmed to tropical temperatures to outgas CO2. The surface water then follows mean surface circulation patterns, arriving at the poles about a year later to feed the THC at about 0ºC. All along the year-long route, surface water cools, on average absorbing CO2. This creates a background flux of CO2 in the atmosphere that should be detectable without IPCC's calibrations. IPCC gives no indication in any of its Assessment Reports that its models account for these ocean and atmospheric circulations. NASA published a July 2008 image from AIRS of mid-tropospheric (8 km) CO2 here. The AIRS chart from July 2003 here showed much weaker patterns. NASA's 2003 caption includes this under-stated observation: This global map of mid-troposphere carbon dioxide shows that despite the high degree of mixing that occurs with carbon dioxide, the regional patterns of atmospheric sources and sinks are still apparent in mid-troposphere carbon dioxide concentrations. Climate modelers are currently using AIRS data to study the global distribution and transport of carbon dioxide. Note that atmospheric CO2 in 2003 had a high degree of mixing, no longer well-mixed. Still apparent indeed. CO2 patterns at the surface must be much more pronounced than the extreme lumpiness of CO2 evident at 8 kilometers. The atmosphere acts as a filter to reduce both resolution and evidence of surface patterning. It is not well-mixed above 8 km; it is even less well-mixed below. Whatever IPCC means by well-mixed, the satellite measurements puncture the conjecture. 3. The CO2 concentration rise is surely natural. As the Vostok record shows, it is in sync with temperature, but always lagging. The increase is a local effect at MLO, and IPCC's calibration to make other measuring stations agree with MLO is unwarranted. Furthermore, an intense pattern of CO2 rising from the Eastern Equatorial Pacific splits poleward, enters the Hadley Cells, then the Westerlies, with half descending across MLO as it cools. This puts MLO in a plume of outgassing, a major source amounting to about 60% of the estimated 90 GtC/yr from the ocean. The bulge at MLO is not 30-40% of 8 GtC/yr, but about 3-4% of 90. If that plume were stationary, then the rise seen at MLO might be just due to sea surface temperature. However, the plume might be wandering, a slow, climatic effect moving its ridgeline closer to MLO in modern times. This is speculation, but necessary on the heels of the failure of the IPCC model. An analysis of MLO data closer to raw data, along with wind vector, might shed light on why MLO CO2 concentration has been rising for the last half century. 4. Nothing can be established using thermodynamic equilibrium because it doesn't exist on Earth. It is precisely IPCC's reliance on that fiction that leads to a severe debunking. 5. I don't find any use for a net effect of the ocean. It always uptakes CO2 at 0ºC and at today's partial pressure before the water descends to the bottom. It outgasses CO2 from water 500 to 1000 years old, effectively at the concentration then, but released at the tropical temperature now.
  15. scaddenp, 5/11/11, 13:50 PM [sic] CO2 residence time IPCC's First Assessment Report (FAR) has an introductory part titled Policymakers Summary. The Second (SAR), Third (TAR) and Fourth (AR4) have an introductory part titled Summary for Policymakers. IPCC explicitly addresses no one else in its Reports. The Policymakers associated with the IPCC would include US Democrats, formerly including Al Gore, and other Western politicians on the left. What they are supposed to do is heap honors on IPCC and its climatologists, turn a blind eye to scientific challenges to IPCC's model, fund evermore super supercomputers and studies with them, and redistribute world GDP among all nations by voluntarily crushing energy use in proportion to national GDP.
  16. IPCC summaries the published science for consumption BY policy makers. The IPCC are not policy makers themselves. Your other assertions are simply political statements. They express what you wish to believe without a trace of supporting evidence and are laughable to those who know the people involved.
  17. "The CO2 concentration rise is surely natural. As the Vostok record shows, it is in sync with temperature, but always lagging." Nope. CO2 isotope signature in ice bubbles shows is carbon-cycle CO2. CO2 in atmosphere today shows its FF in origin. By your logic the isotope signatures should be the same.
  18. I tried reading it slowly JG but you still aren't making much sense. Are you saying that the oceans have not absorbed a lot of CO2? If so, do you have an alternative explanation for the observed decrease in ocean pH? Currently the concentration of CO2 in the atmosphere is increasing. This means the supply processes are greater than the removal process. That is, once CO2 is added to the atmosphere it stays for a long time (= long residence time) because it is not removed.
  19. drrocket, I am looking at the diagram that you linked (just to confirm: http://www.ipcc.ch/publications_and_data/ar4/wg1/en/figure-7-3.html) and I see only 0.8 - 70.6 + 70 or "net 0.2 into the ocean" for nCO2. For red arrows interacting with the ocean I see only 22.2 in and 20 out or "net 2.2 into the ocean" for ACO2. Seems a little odd until we consider that the red ACO2 is really the "new" CO2 and about 1/3 of the 6.4 "new" Gt/yr goes into the ocean, about 1/6 of the 6.4 into the biosphere and the rest (1/2 of the 6.4) ends up in the atmosphere. I'm not sure the IPCC directly defines "well-mixed" but (CAGW skeptic) Jack Barrett has a nice graph of the isotope ratios as they vary by season and latitude: http://www.barrettbellamyclimate.com/page33.htm which shows that mixing between hemispheres is generally slower than a season otherwise the NH peaks would bleed into the SH instead being damped out by the seasonal vegetation uptake in the NH. Both Barrett and Ferdinand Engelbeen (another skeptic) show that CO2 is well mixed in most circumstances (F.E. here: http://www.ferdinand-engelbeen.be/klimaat/co2_measurements.html#Variations_due_to_local_circumstances:) #3, some of the rise in CO2 is indeed "surely natural" but only a few percent. The reason is that without man-made CO2, there would have been a natural rise in CO2 of about 5 ppmv due to natural warming from the LIA (sorry I don't have a reference from that, but again it is from CAGW skeptic sources that consider the majority of observed warming to be natural). The analysis of M Loa raw data is in the link from F.E. above, very much worth reading. In particular, where he talks about reasons for local variations (e.g. upslope winds from local agriculture which lowers the CO2). No mention of pacific ocean outgassing and F.E. is nothing if not thorough. BUt remember that even though some small amount of the rise is "natural", the entire increase in CO2 atmosphere comes from the anthropogenic sources since nature is actually absorbing about 1/2 of the ACO2 as I pointed out above.
  20. drrocket"39 wrote "The CO2 concentration rise is surely natural" If this were true, then the annual rise in atmospheric CO2 would be greater than anthropogenic emissions (as both man and the natural environment would be net emitters of CO2 to the atmosphere). However, we know this is not the case, we have good estimates of anthropogenic emissions and good measurements of atmospheric CO2, and these show that the annual rise is only about half the level of anthropogenic emissions. This means that the natural environment (as a whole) is a substantial net carbon sink, and hence is not causing the observed increases. The CO2 concentration rise is surely anthropogenic. It is one of the few things in climatology that we know for sure.
  21. scaddenp, 5/12/11, 10:20 AM CO2 residence time It was you on 5/11/11, 13:50, not I, who asked ambiguously about the role of IPCC's Policymakers. I responded politely, correcting your ambiguity by showing associated with the IPCC, your words, in italics. 5/12/11, 7:46 AM. Your position now seems to be those who agree with IPCC are not being political, otherwise those who correct IPCC errors, much less even doubt IPCC, are political. That does seem to be true enough. Scaddenp, 5/12/11, 10:23 AM IPCC, the owner of AGW, doesn't use the isotope signature from ice bubbles. The observed decrease in ocean pH does not match any mass balance analysis for CO2. If it did, IPCC surely would have used that signature, but IPCC chose not to reveal its mass balance computation (e.g., AR4, ¶7.3.1.2, p. 514) in its Assessment Reports, and chose to fabricate signatures and to rely on coincidence, i.e., correlation, for Cause & Effect. Instead IPCC prepared a graph, AR4, Figure 2.3, analyzed as Figure 25 here, in which it jockeyed the two right hand ordinates to give the false impression in Fig. 25(a) that the decline in atmospheric O2 matched the increase in CO2, and in (b) that the decline in δ13C matched the rise in global emissions. This jockeying is graphical fraud committed by (1) not plotting full scale on the right, and (2) adjusting the scale factor to make contradictory evidence no longer contradictory. The curves match only in IPCC's graphical coordinates, not in a mass balance analysis. Doug Mackie, 5/12/11:31 AM The oceans absorb a lot of CO2. I take IPCC's number of about 92.2 GtC/yr at face value. The land takes up another 122.8 GtC/yr. IPCC agrees with your bit about CO2 increasing. It is increasing at MLO, although IPCC's published data for MLO are not quite real data, but a troublesome, heavily filtered reconstitution. A proper scientific method is to show raw data in a scatter diagram with the fitted curves overlaid. IPCC just shows its fitted curves. CO2 is increasing at other measuring stations because IPCC's investigators admittedly calibrate the stations into agreement. CO2 stays in the atmosphere between 1.51 years (with 270 PGC/yr leaf water) and 3.48 years (without) using IPCC's data and IPCC's valid formula. As I said above, IPCC ignores its formula so that it can baldly proclaim CO2 to be long-lived, and thereby do its calibrations without further justification. You wrote, This means the supply processes are greater than the removal process. That is, once CO2 is added to the atmosphere it stays for a long time (= long residence time) because it is not removed. The first sentence is obviously true. The second does not follow, and is false. Eric (skeptic), 5/12/11, 11:53 AM You have the correct diagram. You might also notice that IPCC has the surface ocean outgassing 90.6 GtC/yr from the Surface Ocean reservoir or 918 GtC. The outgassing is 20/90.6 = 22.1% ACO2 from a reservoir that is 18/918 = 1.96% ACO2. The outgassing is supported by IPCC's atmospheric division of 165/762 = 21.6% ACO2 under Henry's Law under the assumption that ACO2 and nCO2 have separable partial pressures, or something equally bizarre about separable partial pressures by isotopic weight. When I wrote about AGW proponents, I was including Ferdinand Engelbeen. He is a reliable source of information, a good source for additional climate material, and possessing the good skeptical instinct required of a scientist. He is a gadfly that sticks it to realclimate.org from time to time. But he is more of a supporter of AGW than not. For example, he rationalizes that the carbonate equilibrium coefficients are valid in a state of dynamic equilibrium, and therefore would disagree with my entire summary on 5/11/11 at 8:43 AM, above. The Zeebe & Wolf-Gladrow article in the Encyclopedia of Paleoclimatology, etc., coupled with the cited laboratory procedure for measuring the coefficients contradict Ferdinand's assumption that one can substitute dynamic equilibrium for thermodynamic equilibrium. This is a symptom of a lack of skill in thermodynamics, a most delicate science. The well-mixed assumption is quite false, notwithstanding its defenders. Its origins in the long-residence time assumption contradict the plain formula approved by IPCC, and it is severely challenged by the AIRS data since 2003. NASA backed away from the well-mixed conjecture in 2003, then deleted that position in 2008. Dogma trumps data. You observe that Ferdinand omitted the outgassing plume, and suggest that he is thorough. That is far from an arguable rationale. His omission instead is evidence that he is not sufficiently skeptical about IPCC's work. Your closing remark about the origin of the CO2 increase is a restatement of IPCC's fatal error of misattribution and data manipulation with nothing new. It only says to count you as Eric (Believer). Skeptical science is a blog misnamed to shield that it is dedicated to debunking skeptical science. Are you a shill for the blog? If you are a skeptic, what are your bona fides? Did you refer to Ferdinand as a skeptic in the same sense that you and Skepticalscience.com are skeptics? Dikran Marsupial, 5/12/11, 17:43 PM [sic] The annual rise in atmospheric CO2 would be greater than anthropogenic emissions if the atmosphere retained all the emissions. Your assumption that the natural environment is a net emitter is true when the climate is warming. Taking IPCC data at face value again, we can say that the bulge in CO2 at MLO is equivalent to about half the ACO2 during the industrial era. The notion that the bulge is made up of ACO2 is a misattribution, necessary to make AGW work. It's half of a coincidence, not a Cause & Effect with origins in physics. Natural emissions are about 210 GtC/yr and ACO2 currently just under 8 GtC/yr, including land use. Using a linear estimate for the growth over the industrial era, ACO2 is about 4/210 = 2% of the emissions. That's likely the proportion that can be attributed to the atmospheric CO2. IPCC modified its charter to assume AGW as its baseline. Then it rejected any tendencies in its model to attribute climate to natural causes, and replaced them with anthropogenic causes. Similarly, if it were engaged in a scientific endeavor, it would have looked for any natural causes for the atmospheric δ13C to be about -7.8 per mil, and tested the assumption that δ13C was zero for nCO2 and -27.2 for ACO2. An honest appraisal here, supported by a mass balance analysis, should support whatever attribution is best for the ACO2 contribution to the atmosphere. IPCC's misattribution comes from its conjecture not just that CO2 accumulates in the atmosphere, but the ludicrous, irrational assumption that only ACO2 accumulates in the atmosphere. That assumption is rationalized by the equally ludicrous and preposterous assumption that the surface layer is in thermodynamic equilibrium. Neither species of CO2 accumulates in the atmosphere more than a year or two. Without that build-up of ACO2, AGW does not exist.
  22. drrocket@46 wrote "Your assumption that the natural environment is a net emitter is true when the climate is warming." Perhaps you ought to read my post again a bit more carefully, I made no such assumption. The natural environment is a net sink, not a net emitter. This isn't an assumption, it is a demonstrable fact (assuming conservation of matter, but I would argue that is a pretty solid assumption). "Neither species of CO2 accumulates in the atmosphere more than a year or two." You (like e.g. Robert Essenhigh) are confusing residence time and adjustment time. They are not the same thing, both are well defined in e.g. the IPCC reports. "but the ludicrous, irrational assumption that only ACO2 accumulates in the atmosphere" They assume no such thing. Here is a challenge for you. Let E_a be annual anthropogenic emissions, E_n be annual natural emissions, U_n be annual natural uptake and dC be the annual increase in atmospheric CO2. Assuming conservation of matter dC = E_a + E_n - U_n Now, give values for dC, E_a, E_n and U_n such that the annual rise is less than anthropogenic emissions (dC < E_a) but where the environment is a net emitter (E_n > U_n). You will find you can't. The fact that the observed annual rise is always less than anthropgenic emissions establishes without doubt that the natural environment is a net carbon sink, and hence is not the cause of the increase. If you disagree, I suggest you avoid a career in accountancy! ;o)
  23. Drrocket To repeat, we as scientists know these things with great confidence. 1. CO2 is increasing. 2. Stable isotopic signatures clearly indicate that the added CO2 is derived from plant matter. 3. That plant matter could only be from losses of terrestrial biomass (through land-use changes) and burning of fossil fuels. 4. The increase has been less than predicted if human emissions stayed in the atmosphere. 5. There has not been a large enough change in terrestrial biomass to account for the change. 6. The ocean is acidifying even though it is warming, (which should cause pH to increase as CO2 outgasses) That means it is a sink for CO2 at present. There is simply no way to reconcile those facts with the statement "Neither species of CO2 accumulates in the atmosphere more than a year or two." You would need to identify a massive previously unidentified net transfer of C13 enriched carbon into the earth's atmosphere. Even if the atmospheric CO2 relaxation half-life were on the order of centuries (as we think), the net transfer would have to equivalent to 1/2 the living plant matter on earth over the last 150 years. With a relaxation half-life of <1 year (as you suggest), you would be talking quite a bit larger. What is your proposed source?
  24. Sorry...I meant a net transfer of C13 depleted carbon.
  25. Dikran Marsupial, 5/13/11, 03:37 AM CO2 residence time On 5/12/11 at 17:43, you wrote on the If this were true, then the annual rise in atmospheric CO2 would be greater than anthropogenic emissions (as both man and the natural environment would be net emitters of CO2 to the atmosphere). The second part about the natural environment conditionally being net emitter is an assumption, your assumption, and one that doesn't follow from your hypothesis that the CO2 concentration rise is surely natural. I used your exact words; there was no problem in reading or citing what you wrote, then or now. Could it be that what you object to is your assumption being called an assumption? You assumed the conclusion would follow from your hypothesis. You say, You (like e.g. Robert Essenhigh) are confusing residence time and adjustment time. They are not the same thing, both are well defined in e.g. the IPCC reports. How did I confuse what I didn't use? Here's what IPCC says on this subject: Response time The response time or adjustment time is the time needed for the climate system or its components to re-equilibrate to a new state, following a forcing resulting from external and internal processes or feedbacks. Bold added, AR4, Glossary. I was addressing nothing like the so-called equilibration time for the climate. I would have no use for adjustment time under any circumstances because the climate system never reaches equilibrium. I was talking about the average time molecules of CO2 stay in the atmosphere, and that is given by the residence time applied to some scenario for emissions. I was talking about CO2 uptake, not about climate equilibration. Your formula, dC = E_a + E_n – U_n, doesn't have enough variables. It's missing E_a altogether. Using your symbology, IPCC's ludicrous, irrational assumption is that U_a = 0.6E_a while U_n = E_n, where E_a ~ 8 GtC/yr and E_n ~ 210 GtC/yr. What you might have written is dC = E_a – U_a + E_n – U_n = 8.0 – 4.8 + 210.2 – 210.2 = 3.2 GtC/yr This is the equation for the air-sea flux in AR4, Figure 7.3, p. 515, where I happen to score IPCC's 20 GtC/yr of ACO2 flux between air and ocean as nCO2 with no loss of generality. The problem is that IPCC's ratio of U_a/E_a = 0.5 while its ratio of U_n/E_n = 1 is unjustified, if physically possible at all, considering that ACO2 and nCO2 are just different mixes of 12CO2:13CO2:14CO2. If you have any accountancy homework, just post it here, too, for lessons.

Prev  1  2  3  4  Next

Post a Comment

Political, off-topic or ad hominem comments will be deleted. Comments Policy...

You need to be logged in to post a comment. Login via the left margin or if you're new, register here.

Link to this page


The Consensus Project Website

THE ESCALATOR

(free to republish)


© Copyright 2024 John Cook
Home | Translations | About Us | Privacy | Contact Us