Climate Science Glossary

Term Lookup

Enter a term in the search box to find its definition.

Settings

Use the controls in the far right panel to increase or decrease the number of terms automatically displayed (or to completely turn that feature off).

Term Lookup

Settings


All IPCC definitions taken from Climate Change 2007: The Physical Science Basis. Working Group I Contribution to the Fourth Assessment Report of the Intergovernmental Panel on Climate Change, Annex I, Glossary, pp. 941-954. Cambridge University Press.

Home Arguments Software Resources Comments The Consensus Project Translations About Support

Bluesky Facebook LinkedIn Mastodon MeWe

Twitter YouTube RSS Posts RSS Comments Email Subscribe


Climate's changed before
It's the sun
It's not bad
There is no consensus
It's cooling
Models are unreliable
Temp record is unreliable
Animals and plants can adapt
It hasn't warmed since 1998
Antarctica is gaining ice
View All Arguments...


Username
Password
New? Register here
Forgot your password?

Latest Posts

Archives

How do we know more CO2 is causing warming?

What the science says...

Select a level... Basic Intermediate Advanced

An enhanced greenhouse effect from CO2 has been confirmed by multiple lines of empirical evidence.

Climate Myth...

Increasing CO2 has little to no effect

"While major green house gas H2O substantially warms the Earth, minor green house gases such as CO2 have little effect.... The 6-fold increase in hydrocarbon use since 1940 has had no noticeable effect on atmospheric temperature ... " (Environmental Effects of Increased Atmospheric Carbon Dioxide)

At-a-glance

To make a statement like, "minor greenhouse gases such as CO2 have little effect", is to ignore 160 years of science history. So let's look at who figured out the heat-trapping properties of carbon dioxide and when.

Experiments involving various gas mixtures had demonstrated the heat-trapping properties of water vapour, CO2 and methane in the 1850s. But those effects were yet to be quantified - there were no meaningful numbers. It was to be another 40 years before that happened.

Swedish scientist Svante Arrhenius (1859-1927) was the person who crunched the numbers. The results were presented in a remarkable paper, "On the Influence of Carbonic Acid in the Air upon the Temperature of the Ground", in 1896.

The many calculations in the 1896 paper include estimates of the amounts of CO2 increase or decrease required to drive the climate into a different state. One example used was the Hothouse climate of the Cenozoic, around 50 million years ago. Another was the glaciations of the last few hundred millennia.

To get a temperature rise of 8-9°C in the Arctic, Arrhenius calculated that CO2 levels would have to increase by 2.5 to 3 times 1890s levels. To lower the temperature 4–5°C to return to glacial conditions, he calculated a drop in CO2 was needed of 0.62-0.55 times 1890s levels.

We know CO2 levels in the 1890s from ice-core data. They were around 295 ppm. Let's do the sums. A reduction factor of 0.55 to 0.62 on 295 ppm gives 162.2-183.9 ppm. Modern ice-core measurements representing the past 800,000 years show that in glacial periods, CO2 levels fell to 170-180 ppm.

What we now know due to additional research since 1896 when Arrhenius worked on this, is that CO2 was an essential 'amplifying feedback'. That means changes triggered by long term, cyclic variations in Earth's orbit cause warming or cooling and CO2 release or entrapment in turn. Those changes in CO2 levels affected the strength of Earth's greenhouse effect. Changes in the strength of the greenhouse effect then completed the job of pushing conditions from interglacial to glacial - or vice-versa.

Arrhenius also made an important point regarding water vapour: "From observations made during balloon voyages, we know also that the distribution of the aqueous vapour may be very irregular, and different from the ideal mean distribution." This statement holds true today: water vapour is a greenhouse gas but because water exists in gas, liquid and solid forms in the atmosphere, it is continually cycling in and out of the air. It is distributed in a highly uneven fashion and is uncommon in the upper atmosphere. That's where it differs from CO2.

Once CO2 is up there, it's up there for a long time. As a consequence it has a pretty even distribution: 'well-mixed' is the term. As Arrhenius quantified all that time ago, once it's up there it constantly absorbs and re-radiates heat in all directions. That's why dumping 44 billion tons of it into our atmosphere in just one year (2019 - IPCC Sixth Assessment Report 2022) is a really bad idea.

Please use this form to provide feedback about this new "At a glance" section. Read a more technical version below or dig deeper via the tabs above!


Further details

Good scientific theories are said to have ‘predictive power’. In other words, armed only with a theory, we should be able to make predictions about a subject. If the theory’s any good, the predictions will come true.

Here’s an example: when the Periodic Table of the chemical elements was proposed in 1869, many elements were yet to be discovered. Using the theory behind the Periodic Table, the Russian chemist Dmitri Mendeleev was able to predict the properties of germanium, gallium and scandium prior to their discovery in 1886, 1875 and 1879 respectively. His predictions were found to be correct.

The effect on Earth's greenhouse effect of adding man-made CO2 is predicted in the theory of greenhouse gases. This theory was first proposed by Swedish scientist Svante Arrhenius in 1896, based on earlier work by Fourier, Foote and Tyndall. Many scientists have refined the theory since Arrhenius published his work in 1896. Nearly all have reached the same conclusion: if we increase the amount of greenhouse gases in the atmosphere, the Earth will warm up.

Where there is less agreement is with respect to the exact amount of warming. This issue is called 'climate sensitivity', the amount the temperatures will increase if CO2 is doubled from pre-industrial levels. Climate models have predicted the least temperature rise would be on average 1.65°C (2.97°F) , but upper estimates vary a lot, averaging 5.2°C (9.36°F). Current best estimates are for a rise of around 3°C (5.4°F), with a likely maximum of 4.5°C (8.1°F). A key reason for this range of outcomes is because of the large number of potential climate feedbacks and their variable interactions with one another. Put simply, some are much better understood than others.

What Goes Down…

The greenhouse effect works like this: Energy arrives from the sun in the form of visible light and ultraviolet radiation. The Earth then emits some of this energy as infrared radiation. Greenhouse gases in the atmosphere 'capture' some of this heat, then re-emit it in all directions - including back to the Earth's surface.

Through this process, CO2 and other greenhouse gases keep the Earth’s surface 33°Celsius (59.4°F) warmer than it would be without them. We have added 42% more CO2, and temperatures have gone up. There should be some evidence that links CO2 to the temperature rise.

So far, the average global temperature has gone up by more than 1 degrees C (1.9°F):

"According to an ongoing temperature analysis led by scientists at NASA’s Goddard Institute for Space Studies (GISS), the average global temperature on Earth has increased by at least 1.1° Celsius (1.9° Fahrenheit) since 1880. The majority of the warming has occurred since 1975, at a rate of roughly 0.15 to 0.20°C per decade."

The temperatures are going up, just like the theory predicted. But where’s the connection with CO2, or other greenhouse gases like methane, ozone or nitrous oxide?

The connection can be found in the spectrum of greenhouse radiation. Using high-resolution FTIR spectroscopy, we can measure the exact wavelengths of long-wave (infrared) radiation reaching the ground.
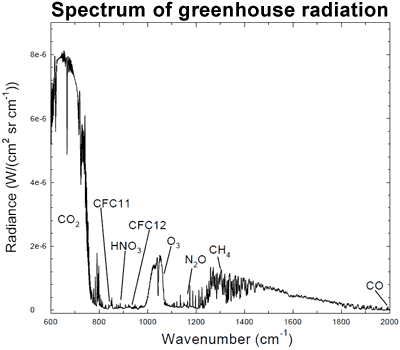
Greenhouse spectrum

Figure 1: Spectrum of the greenhouse radiation measured at the surface. Greenhouse effect from water vapour is filtered out, showing the contributions of other greenhouse gases (Evans 2006).

Sure enough, we can see that CO2 is adding considerable warming, along with ozone (O3) and methane (CH4). This is called surface radiative forcing, and the measurements are part of the empirical evidence that CO2 is causing the warming.

...Must Go Up

How long has CO2 been contributing to increased warming? According to NASA, “Two-thirds of the warming has occurred since 1975”. Is there a reliable way to identify CO2’s influence on temperatures over that period?

There is: we can measure the wavelengths of long-wave radiation leaving the Earth (upward radiation). Satellites have recorded the Earth's outgoing radiation. We can examine the spectrum of upward long-wave radiation in 1970 and 1997 to see if there are changes.
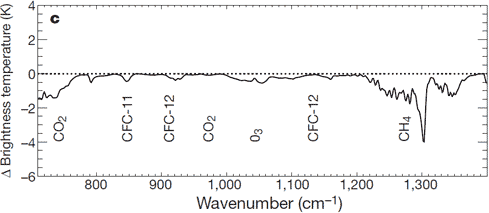
Change in outgoing radiation

Figure 2: Change in spectrum from 1970 to 1996 due to trace gases. 'Brightness temperature' indicates equivalent blackbody temperature (Harries et al. 2001).

This time, we see that during the period when temperatures increased the most, emissions of upward radiation have decreased through radiative trapping at exactly the same wavenumbers as they increased for downward radiation. The same greenhouse gases are identified: CO2, methane, ozone and so on.

The Empirical Evidence

As temperatures started to rise, scientists became more and more interested in the cause. Many theories were proposed. All save one have fallen by the wayside, discarded for lack of evidence. One theory alone has stood the test of time, strengthened by experiments.

We have known CO2 absorbs and re-emits longwave radiation, since the days of Foote, Tyndall and Arrhenius in the 19th Century. The theory of greenhouse gases predicts that if we increase the proportion of greenhouse gases, more warming will occur.

Scientists have measured the influence of CO2 on both incoming solar energy and outgoing long-wave radiation. Less longwave radiation is escaping to space at the specific wavelengths of greenhouse gases. Increased longwave radiation is measured at the surface of the Earth at the same wavelengths.

Last updated on 16 July 2023 by John Mason. View Archives

Printable Version  |  Offline PDF Version  |  Link to this page

Argument Feedback

Please use this form to let us know about suggested updates to this rebuttal.

Further reading

A good summation of the physics of radiative forcing can be found in V. Ramanathan's Trace-Gas Greenhouse Effect and Global Warming.

Denial101x video

Comments

Prev  1  2  3  4  5  6  7  8  9  10  11  12  13  14  15  16  17  18  19  Next

Comments 101 to 125 out of 451:

  1. Aye, agreed.
  2. (-Snip-)
    Response:

    [DB] Again, you must finish up what you initiated on the It's the sun thread before you can initiate something on another.  What you are doing is trolling.  If you persist in this behaviour your posting privileges will be reconsidered.

  3. DB, we are not responding to Mace on the "It's the sun" thread because he has still not properly responded on The 2011 Climate B.S.* of the Year Awards thread.
    Response:

    [DB] Thank you for your guidance, and your efforts.  Mace has found compliance with the SkS Comments Policy too onerous & has recused himself from further participation.

  4. http://www.engineeringtoolbox.com/spesif...d_159.html Gas or Vapor kJ/kg Air 0.287 Carbon dioxide 0.189 Water Vapor 0.462 Steam 1 psia. 120 – 600 oF That’s what it takes to change the temperature 1 degree K. When CO2 changes from 1 to -1 C, a change of 2 degrees C, it radiates 2(0.189 kJ/kg) = 0.378 . http://en.wikipedia.org/wiki/Enthalpy_of_vaporization When water vapor changes from 1 to -1 (and condenses) it radiates 2257 kj/kg + 2(0.462 kJ/kg) = 2257.853776 kJ/kg. It does this every single time you see a cloud. But CO2 has no phase change so it carries no heat – the numbers: All gases at the same temperature have the same number of molecules per unit volume. (Avogadro) Water, being light, masses 18g/mole and CO2 masses 44 g/mole Using 1 mole of air, just to make math easy: We lowball the water in the atmosphere at 1% of the molecules So, in a mole of atmosphere, we have 0.01 moles of water = 0.18g now we highball the CO2 at 500ppm which is 0.0005, or 1/2000 of a mole of CO2. 1/2000 * 44g/mole = 0.000484 moles of CO2 = 0.021296g So in our mole of air with but 1% H2O and a generous 500ppm CO2- the water condensing radiates 0.18g * 2257.853776 kJ/kg = 406.41367968 J while the CO2 radiates 0.021296g * 0.378 kJ/kg = 0.008049888 J the ratio of 0.008049888/406.41367968 = .00001980712855516645290496438242332 or as much to say that water vapor in the example carries 50486.873814890343815963650674393 times more heat than the CO2 does. And that’s just rain. If it turns to snow- multiply by 5-6. Meanwhile, Venus is a ball of active volcanoes with a dry heat pump to radiate it poorly. That is why Earth’s climate doesn’t resemble that of Venus. Forget about CO2.
    Response: [JH] "Dana69" is not an SkS author.
  5. Dana69 @104, I'll grant you that it is a novel approach. To bad that you make such fundamental errors. The most important error is that there is no requirement that the heat be radiated away. In fact, most of the heat will be carried away by collisions with other molecules. Therefore your assumption that be comparing the heat content of molecules you can determine the relative contribution to the Outgoing Long wave Radiation, and hence the overall temperature of the Earth is a simple non sequitur. In fact, the radiation of IR radiation by each gas is a direct function of it temperature, emissivity and concentration, and nothing else. The heat capacity determines how long it takes for the gas to heat, or cool given a particular flow of heat. Indirectly it helps determine the lapse rate in the troposphere. But beyond those two factors is has no further bearing on the greenhouse effect. Finally, those so equipped can easily determine the absurdity of Dana69's suggestion. The need merely direct an IR camera at a cup of water as it is first heated then cooled. They will find that as it warms (and hence is absorbing more energy than it give of) it radiates more, whereas when it cools (and hence is giving of more energy than it absorbs) it radiates less. If you compare the IR flux measured using the camera, you will find the same flux for a given temperature regardless of whether it is warming or cooling.
  6. But, Tom, what Dana69 says looks interesting. It's got numbers, and calculations, and references to laws. And it has an attempt to stop dialogue at the end of it--the hallmark of a good faux skeptic.
  7. And aren't Venus' volcanoes all but extinct? No more plate tectonics?
  8. Rob the volcanoes found on Venus are not of the type associated with plate movements. The front running theory on the planet's geology is that of periodic volcanic resurfacing, no plate tectonics. Although no active volcano has been observed, evidence of volcanic activity is everywhere to be seen on the surface.
  9. Any increase in backradiation’s contribution to warming would still be subject to the defect of GMST; that is (A + B)^4 > A^4 + B^4 which shows that backradiation, like all Stefan-Boltzman effects, is subject to regionalised variation which defeats any averaging that AGW relies on as a metric.
    Response: [JH] "Dana69" is not an SkS author.
  10. Dana69 - Variations in surface temperature will increase the energy radiated, and Trenberth 2009 discusses that. Their estimates of 396 W/m^2 are an increase from the 390 W/m^2 stated in the earlier version of the paper for that very reason. "...regionalised variation which defeats any averaging..." - This is an issue recognized by folks in the field, where temperature variations are taken into consideration. Certainly not a "gotcha" moment, wherein it turns out that all of the science is wrong due to an overlooked variable... As I recall, you were involved in a discussion of CO2 and radiation over at the CO2 is just a trace gas thread. You demonstrated some understanding of the issues there, which makes your current comments puzzling.
  11. KR, They are perhaps puzzling since both #109 and #104 are copied and pasted from comments on science of doom. #109 is posted under user cohenite while #104 is posted under Dave McK, appearing again at WUWT
  12. IanC - That's absolutely fascinating... Dana69 - Perhaps you could either offer your own opinion, or clearly link and credit to issues you feel important, rather than plagiarizing other folks words? I'm getting the distinct impression of a troll, rather than someone who holds their own views on the subject.
  13. Fascinating stuff, IanC. So either Dana69 is cohenite (aka Anthony Cox), or Dana69 is an intentional plagiarist. If Dana69 = Cox, your puzzlement, KR, is resolved. Cox has a vested interest in maintaining a specific position re climate. Until he can demonstrate an ability to accept his own error (learn), his posts can be considered nothing but trolling. If Dana69 is not Cox and is a plagiarist, then Dana69's ability to express his/her actual understanding is suspect, and further dialogue is probably (but not certainly) a waste of time (since one never knows who one is actually engaging in dialogue with -- a pastiche or the original brain). All of this is obvious, but it's worth pointing out to anyone tempted to respond to Dana69 (until such a time as Dana69 addresses the issue, of course).
  14. DSL - Given that Dana69 has copied posts from two different authors (assuming that cohenite doesn't also post as Dave McK), I would suspect that it's not cohenite under another handle. DNFTT
  15. Dana69 @109 appears to not recognize that climate predictions are made with climate models that use (relatively) high resolution grids of the surface. The GISS-HYCOM model, for example, uses a 4 degree latitude by 5 degree longitude grid, thereby dividing the Earth's surface into 3240 cells. The model has 20 layers for the atmosphere, meaning the atmospheric model divides the atmospheric model divides the atmosphere into 64,800 cells in total. Oddly enough, the model does not constrain all cells to maintain the same temperature, a necessary constraint for Dana69's comment to have any relevance. GISS also runs a 2 x 2.5 degree model, which therefore has 12,960 surface cells, if that is not enough resolution for you. Dana69 may feel that dividing the Earth into 12,690 cells does not sufficiently account for regionalization, but that tells us more about Dana69 than climate science. When will the fake skeptics wake up to the fact that pretending climate science is based on a single zero dimensional model, as Dana69 has done, reveal them to be cranks pushing an agenda in no uncertain terms?
  16. And of course whoever originally wrote post #104, that was plagiarised by dana69, also neglected to discuss evaporation: whereupon liquid water absorbs all that extra energy to become the water vapour that is able to release energy. I presume they just forgot...
  17. skywatcher @116, are you suggesting that averaged over time, just as much water falls to the ground as raine (or snow etc) as evaporates. What sort of radical new theory is that. (/sarc)
  18. Tom #117, Apparently, according to #104, all the water you and I naively feel as rain, actually is dropped off by passing comets, the water having never evaporated from the ground. This also accounds for sea level rise and so there is nothing to worry about. /sarc
  19. "A good summation of the physics of radiative forcing can be found in V. Ramanathan's Trace-Gas Greenhouse Effect and Global Warming." Is a broken link.
    Response:

    [DB] Fixed link, thanks. The actual URL is: http://www-ramanathan.ucsd.edu/files/pr72.pdf

    A portion of V Ramanathan's publication list can be found here.

  20. From the introductory paragraph, surely this is incorrect: "The Earth receives energy from the Sun in the form of visible light and ultraviolet radiation, which is then re-radiated away from the surface as thermal radiation in infrared wavelengths." About half of the energy in sunlight is near and short wave IR, and surely it is mostly this component of sunlight which heats the planet and is rebroadcast as longwave IR.
  21. Ruffy, can you give a reference to a reputable scientific source for the claim of half of the energy in sunlight being near and short wave IR?
  22. Dikran Marsupial, I know it's not a science paper but Wikipedia puts the sun's input to the planet at about 1 kilowatt per square meter of which "527 watts is infrared radiation, 445 watts is visible light, and 32 watts is ultraviolet radiation". There is also a graph showing the ultraviolet, visible and infrared boundaries linked to the "Sunlight" page. The source looks credible and contains a spreadsheet of the wattage values for each wavelength. Significan energy in wavelengths longer than 0.74µm is also shown in the blackbody emission graph of the sun and earth on the Science Of Doom's excellent page on back radiation.
  23. Ruffy wrote: "About half of the energy in sunlight is near and short wave IR, and surely it is mostly this component of sunlight which heats the planet and is rebroadcast as longwave IR." So what do you imagine happens to the energy from visible light? Does it magically cease to exist or 'go away' somewhere? If so, why is it that white objects (which look white precisely because they reflect most visible light) do not heat up as much as black objects (which absorb most visible light)? Why does electromagnetic radiation in the range that we have arbitrarily labelled 'infrared' behave differently than that in the range we can see?
  24. @Sapient fridge, many thanks, Wikipedia is fine for me (where it has external references), at least as a start. I think the thing that Ruffy might be missing is that a lot of that radiation will be absorbed by the GHGs in the atmosphere before it gets to the surface (which will only see the IR that is not in the absorption bands of H2O, CO2 etc.). I suspect most of this gets re-radiated back out into space (at each "layer" in the atmosphere half is re-radiated up and half re-radiated downwards, so the amount heading downwards decreases logarithmically?). That would be my intuition anyway. The point still remains however, as CBDunkerson mentions, that increasing CO2 will still increase warming at the surface by absorbing the IR re-radiated from the ground from incoming visible, UV and unabsorbed IR (which will be re-radiated at wavelengths included those that are absorbed by GHGs).
  25. Ruffy @120, to put this into perspective here is a graph of the energy content of solar radiation to the Earth by wavelength, along with important absorption bands: As you can see, the 49% figure is about right. However, very little of that 49% is in the wavelengths of the outgoing radiation, as can be seen by this diagram: You will note that nearly all of the incoming solar radiation is absorbed by water vapour, or by the surface. As nearly all the water vapour in the atmosphere is in the bottom four km of the atmosphere, that means nearly all of the energy is absorbed at, or near the surface. Therefore I must disagree with Dikran Marsupial @124, not because his analysis is wrong, but because his assumption that the incoming energy is at frequencies where there is significant absorption by well mixed greenhouse gases (ie, GHG other than water vapour and ozone) is false. It should be noted that the energy absorbed by water vapour near the surface from the sun is very small compared to the energy absorbed from the surface. Based on the energy balance by Fasulo and Trenberth, the near surface atmosphere absorbs around 450 W/m^2, compared to around 80 W/m^2 absorbed in the atmosphere (as significant proportion of which is UV radiation absorbed by the ozone layer). Given this, and given that convection ensures a well structured temperature profile in the lower atmosphere, the energy absorbed in the lower atmosphere can be treated as being absorbed at the surface for nearly all practical purposes. That being the case, the IR radiation from the sun does not differ significantly in its effects from the visible light from the sun. It is absorbed at the surface. It is not directly reradiated but rather, redistributed as heat through the collisions of molecules, some of which then emit IR radiation at an entirely different wavelength, that radiation constituting the Earth's thermal radiation. And, of course, to maintain an energy balance, the energy received by the Earth must equal the energy which leaves the Earth. If the Earth's IR radiation came only from the IR radiation received from the Sun, then about 50% of the Sun's energy would not be reradiated back to space. The resulting energy imbalance would be a catastrophe worse than a full nuclear exchange, even if maintained for a single day. So, yes the Earth does receive IR radation from the sun, primarily at wavelengths where it is absorbed at or very near to the surface; but no it is not this component alone (or primarily) that results in the Earth's IR radiation from the surface or to space.

Prev  1  2  3  4  5  6  7  8  9  10  11  12  13  14  15  16  17  18  19  Next

Post a Comment

Political, off-topic or ad hominem comments will be deleted. Comments Policy...

You need to be logged in to post a comment. Login via the left margin or if you're new, register here.

Link to this page


The Consensus Project Website

THE ESCALATOR

(free to republish)


© Copyright 2024 John Cook
Home | Translations | About Us | Privacy | Contact Us