How to use short timeframes to distort reality: a guide to cherrypicking
Posted on 25 September 2013 by John Mason
Cherrypicking is the practice, widespread amongst climate change contrarians, of carefully selecting particular points in the noisy short-term climate datasets and using them to show 'trends' that are not representative of the true situation. The huge global surface air temperature spike that accompanied the monster El Nino of 1997-98 is thus chosen as the starting point for the "no warming in 17 15 16 years" that you may read in internet comment-threads below climate stories (the number varies, apparently at random, from commentator to commentator). This year we have seen the Arctic sea-ice melting season once again reported by contrarians as a recovery, although as the graph below, from the National Snow and Ice Data Center, clearly shows, there have been a number of 'recoveries' in previous years too. The long-term trend, as shown by the dotted trendline, is downwards.
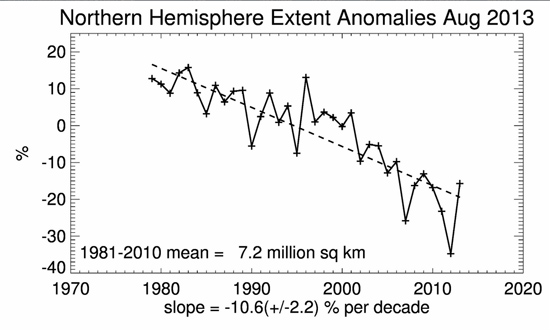
But that long term trend is exactly what the contrarians, their media allies and echo-chamber denizens do not want the public to read or hear about. Right now, in the run-up to the release of the IPCC Fifth Assessment Report (WG1) Summary for Policymakers, the contrarians are especially busy bombarding everywhere they can with climate change myths. Why not keep tabs on which myths are featuring the most, using our Most Used Climate Myths section on the left of this page? Cherrypicking is a vital tool in their armoury, so let's illustrate it with a working example: how to make Northern Hemisphere summers colder than winters. Sounds like ridiculous fantasy? It is, and is thus in good company with the other climate change myths that the contrarians like to put out.
So just to illustrate how cherrypicking is done, we'll take the upwards temperature trend from winter to summer in the Northern Hemisphere. I've downloaded the monthly HadCET (Central England Temperature) mean dataset, available here, and for 2012 (it should work for any year), I've put the values from January through to July into Excel and plotted a graph:
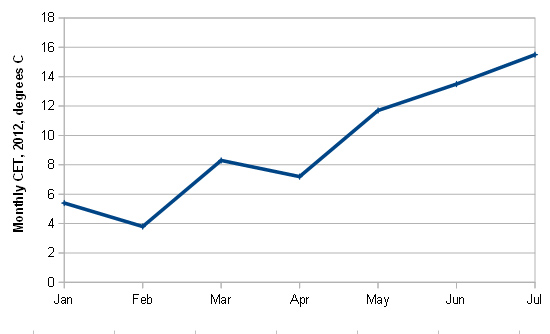
No suprises there. It shows a typical UK winter and spring, doesn't it? A chilly January, a colder February, a nice mild March followed by a disappointing April then a warmer but not especially hotter trend through May, June and July (2012 will be remembered in the UK for its awful wet summer).
We can even fit a trendline (red dotted line) to the data and, indeed, it shows that despite the ups and downs, the trend from winter to summer is that it gets warmer:

But how would we go about it if we wanted for some silly reason or other to show that it gets colder in the Northern Hemisphere instead? Well, the first thing to do would be to look for a short-term cooling trend, and we have one, from January into February: so we focus entirely on that, ditching everything else, and voila!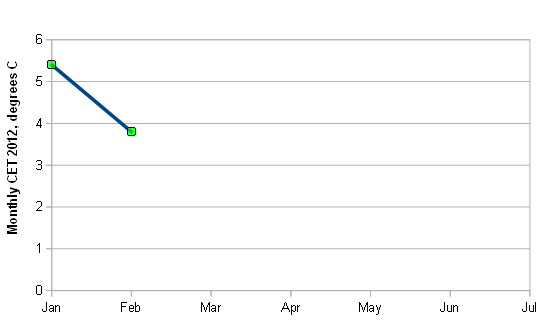
Let's fit a trendline to that and extrapolate. Hey Presto! there will be blizzards instead of heatwaves and by the start of the Summer Recess of the House of Commons, ice floes will be coming down the Thames past the Houses of Parliament!
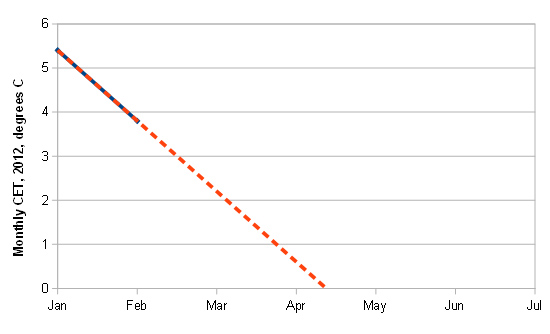
Looks daft, doesn't it? But that, dear readers, is exactly what cherrypicking can accomplish. Unfortunately for the contrarians, in this case it starts warming again into March, but the cooler April gives them another shot at making the same claim, before the May-July warming renders the tactic unusable. Never mind: they can move onto some other argument for a while and then it'll be time for the autumn-winter cooling trend - party-time! At that point, you will very likely hear, "look at all that sea-ice that's forming in the Arctic!", as if it was something new and unusual (it isn't), or, "look at that snow! And they told us we were warming!", as if anybody had even remotely suggested that climate change will make the seasons come to a crashing halt.
Thus, if you come across someone saying or writing things about trends that appear to wildly contradict mainstream science, be they talking about Arctic sea-ice, surface air temperatures or whatever, carefully check their starting point. Was there anything unusual about it? Think of the noise factor: was it particularly big or particularly small? With a bit of practise, cherrypicking is easy to spot, and as illustrated above, it really can be used to claim the impossible.
The global warming signal itself is a multidecadal feature of the climate, but just like the seasonal example above, it has been possible at times to take one period of one temperature record - surface air temperatures in most cases - and do a 'January-February' job with it, thereby making the claim that temperatures are flatlining or even cooling. This tactic works (so far as the contrarians are concerned), of course, until the next record warm year occurs, at which point they have to start out again. However, one may also expect a proportion of them, at that point, to direct their firepower on the temperature-record itself, claiming it is all wrong somehow - yes, the very same temperature record that they had previously been using to 'show' that "global warming had stalled"!
On the bigger scale of things, then, taking carefully-selected bits of the temperature-record that are way too short to be anything but noise, and using them to try and pretend that global warming has stopped, is such a popular contrarian trick that we illustrated it with 'The Escalator':
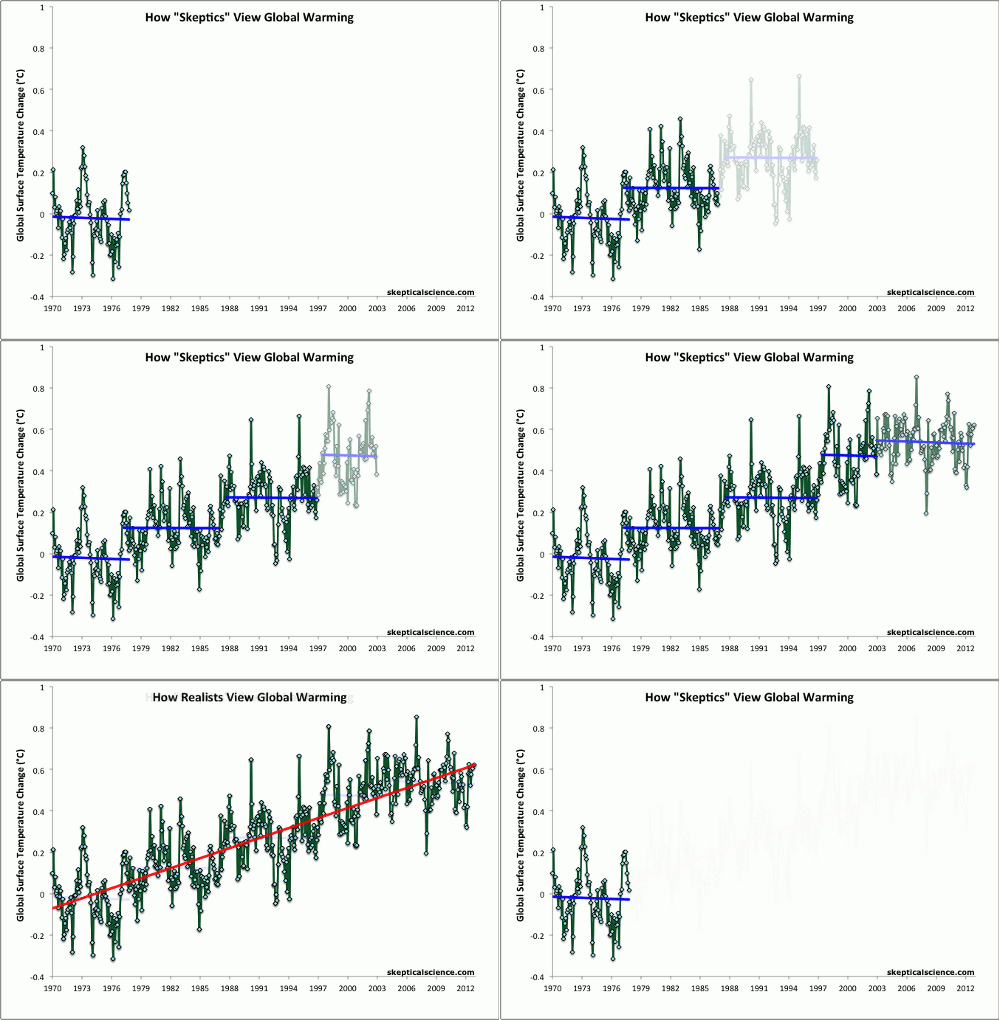
The same principles may be applied to other ongoing aspects of global warming such as sea-level rise or Arctic sea-ice retreat. We'll be taking a look at some other tactics popular with the opposition in forthcoming posts, but to see these things for what they really are, you need not to pick the odd cherry here and there, but step back and look at the reality of the whole tree.


 Arguments


Good stuff! I coded a (interactive but not very good controls!) similarish thingyo - in the "cell(2)" tab it shows how you can claim winter is summer / summer is winter etc about 30% of the time if you choose a 29 day OLS. (You can also load climate data from woodfortrees.org).
This sort of thing seems pretty intuitive to me - perhaps it really isn't and I've forgotten that I learned the intuition over a period of time. It's certainly turning out to be an horrifically effective denial weapon despite being one of the easiest things to demonstrate is wrong.
Tamino has a similar post up right now. He finds from 1992 to 2006 that the surface temperature went up at a rate of 0.28 oC per decade, much faster than the IPCC predicted!! Those IPCC guys must be deliberately underestimating global warming!! In fact, Ramsdorf et al suggested that the rapid increase in temperature was due to natural variation on top of global warming.
The Tamino post is a great antidote; it's dismaying seeing how strongly the "global warming has stopped" stuff has got hold of even key mainstream news outlets...
Well it doesn't bloody help when scientists themselves (hello Kosaka & Xie) use "global warming" interchangeably with "global mean surface temperature." Chris Mooney came to our university last night to give a talk, and while I buy his overall message (account for the personality features of your target audience, and don't target the fact of their irrationality), I also think that a lot of denialist firewood would disappear if scientists weren't so loose with the terminology.
Is there a reason why a linear trend is shown for the NH sea ice extent, where a second order polynomial fit trend is shown on the Arctic Sea Ice Escalator graphic?
Is there scientific evidence that either of the trends can be extrapolated for future predictions?
Smith, linear is easier for the general public to understand, even if it doesn't capture the acceleration over the past decade.
Complex coupled models (CMIP3/5) suck at short- and medium-term Arctic sea ice projection. My understanding is that the Arctic laboratory, especially when the ice is primarily thin, is subject to too many significant short-term forces to get a good grip on short-term projections -- weather, outflow rates into the North Atlantic, river outflow temp, ice flow within the Arctic, surface temp, ocean top layer temp, etc. All of that combines to produce each unique melt and freeze season. Someone may eventually figure out an indicator that works a year out, but the more accurate short-term projections will likely come when the fine mechanics of the Arctic are more robustly incorporated into models. Projecting Arctic sea ice is halfway between projecting weather and projecting climate. It's a tough gig, even if the general direction is clear.
The deniers have painted themselves into a corner, but the sad thing is that the can say/predict basically anything they want and the media will not report on it when denier predictions fail miserably, a year or two later. Remember all the hoopla over the sea level back in 2011? So when sea level rise accelerated again, could we read about failed denier predictions in the major papers? No. Same thing will happen when we beat the 2012 minimum, likely within 3 years from now. Deniers won't be questioned about the recovery that they were screaming about in 13'. Rather, they will be able to claim that the new record is due to a natural cycle and that they had predicted the record years ago. The major press won't ask a single difficult question. Sad state of affairs.
So many thoughts come to mind.
An important aspect to keep in mind is "the motivation for people to believe nonsense".
This issue is not really about the legitimacy of the climate science. Attempts to discredit the science are not expected to be seriously evaluated by their “target audience”. They are expected to be accepted without question.
The real issue is the profit, pleasure, comfort and convenience that will be more difficult for the most fiortunate to continue to obtain if burning non-renewable resources becomes "officially unacceptable".
In some cases it isn't even the fact that sustainable living will require more personal awareness and effort. Some people have gambled by betting (investing or hoping to get more money from employment), on specific non-renewable resources being profitably extracted and burned. If they are "globally prohibited" from employing a few people in pursuit of that "interest" their bet becomes worthless. The result of that realization would be a "major loss of fantasy wealth that many believe is real".
There is major motivation for many very wealthy people to employ as many smart people as they can find who are willing to do the most disgusting thing a smart person can do - deliberately misinform others rather than most fully inform them to attempt to delay the "development of a sustainable better future for all". They can also “buy media coverage sympathetic to their interest”.
It is easy for them to gather popular support because so many people in the wasteful, harmful, industrial, mass-marketed mass-consumption developed economy are desperate to get more for themselves. Most of them have decent lives but are convinced they will "live in caves" if the burning of non-renewable resources was not allowed. Of course, since burning non-renewable resources for energy will eventually be impractical they are basically declaring hey do not care about the future. That is when they start claiming things like the people of the future will have magic. They are immersed in a grand delusion.
Challenging them if they think it is decent that future humans will not be able to continue living that way the current generation of fortunate people do may wake some of them up. However, the ones that are too deep in the delusion will never change their mind. They will have to be forced to behave decently, and that is claimed to be “taboo” in the “free-world”.
The actions required to change the developed economy to a sustainable economy that could sustain its own growth, as well as all other life on this planet, would be to the short-term deserved disadvantage of the ones among us who only want a better present for themselves. They will use all their influence to get as much for themselves as they can. There are some who are so jaded and callous that they simply will never care about the future. Pointing out the obvious flaws in their claims is important but should be matched with a challenge for them to explain why they don’t care about the future.
The scientists must continue to gather more information to best understand what is going on on this one and only planet we know to have life on it. And that understanding needs to continue to be delivered to the global leaders and the rest of the global population. Increased understanding and awareness is the only chance for all life to have a better future.
@DSL,
If that's what they've done then no, that doesn't help at all. Surface air temperature, while likely to be the component of the climate system that we are most aware of (for the time being, then hello, sea levels!) is still but one component of an interactive system that exchanges energy with other components over time, and energy continues to accumulate within the whole....
Esop,
I agree. It seems to me that, for any noisy trend, there will always be a denialist argument available to deny the trend. When extreme values occur, there will usually be short-term factors that have led to the extreme, and these can be emphasized. When the inevitable regression to the mean occurs, this can be portrayed as a recovery. So, if there is a record melt season, blame it on storms or weather, after the record season, point out the recovery, etc. If the surface temp heats up during an el nino, blame that, but then forget about the el nino when using the same data point as the cherry-picked start of a trend. It's tiresome and obvious to most of the readers here, but seems to work every time for those readers predisposed to accept a contrarian viewpoint.
Out of interest, would it be possible for one of you clever people on this site to cherry pick the La Nina low years either side of the 97 high, and stick it in a chart to show what the trend would look like. Thanks.
Zen,
Look at the Tamino link in 2.
Michael:
Just what I need - thanks.