


 Arguments


Recent Comments
Prev 1057 1058 1059 1060 1061 1062 1063 1064 1065 1066 1067 1068 1069 1070 1071 1072 Next
Comments 53201 to 53250:
-
Climate sensitivity is low
dana1981 - Actually, it's that those models with low sensitivity don't simulate humidity changes very well, not clouds. They note that clouds are a more difficult phenomena to observe, too. Fasullo and Trenberth 2012 (described here) appears to be much in the same vein as Spencer and Braswell 2011, where they examined how climate models matched observations, although S&B 2011 was clearly refuted due to poor technique and the exclusion of models they themselves tested which refuted their conclusions. -
Chris G at 07:08 AM on 10 November 2012Fred Singer - not an American Thinker
Thanks Dana; I can reproduce the same PMOD curve using an 11-year running mean over at WoodForTrees, but I do think the rightmost downtrend is slightly over-emphasized because there are less than 3 complete cycles and the last ebb was deeper and longer than the others. Present minus 11 years does not bring you back to the same place in the cycle; it brings you to a peak, and we are a long way from a peak now. -
dana1981 at 06:35 AM on 10 November 2012Climate sensitivity is low
I'll have a post on that paper next week, DSL. I wouldn't say they've constrained climate sensitivity - more accurately they showed that models with climate sensitivity below 3°C don't simulate cloud changes very well, so climate sensitivity is likely on the high end. -
chriskoz at 06:33 AM on 10 November 2012Book review: Rising Sea Levels: An Introduction to Cause and Impact by Hunt Janin and Scott Mandia
John@8 More important quote from this article is:Hurricane Sandy stayed well off the North Carolilna coast but still overwashed N.C. 12, which runs through the Outer Banks, in three places. Winter storms could turn those sites into new inlets, said Stan Riggs of East Carolina University.
That means the typical every-season weather is already affecting NC coast. A strong proof undermining those moronic legislators in NC looking for nothing but greed & money. -
DSL at 06:01 AM on 10 November 2012Climate sensitivity is low
I'm sure Ari will be loading this one into the next weekly installment, but Trenberth and Fasullo have apparently constrained sensitivity even further -- or at least made a major advancement. -
BillEverett at 05:54 AM on 10 November 2012The Big Picture (2010 version)
Tom Dayton: Thanks. Hare & Meinshausen 2006 use the equivalent radiative forcing and "conventional IPCC uncertainty range for climate sensitivity" in their projected scenarios. I am interested in learning about work on the equilibrium between atmospheric carbon dioxide and the planet temperature and on estimating the approach-to-equilibrium curve. I adopted the formula T=0.098c-27.1 from Byalko 2012, cited at Can We Predict the Global Future? Part 2. -
Doug Bostrom at 02:07 AM on 10 November 2012The Big Picture (2010 version)
Also see Chap. 9 section 3 of the third iteration of the world's largest literature review on climate science, AKA IPCC AR3: Projections of Climate Change Getting on 12 years old but many of the fundamentals there have not changed. -
John Hartz at 01:48 AM on 10 November 2012Book review: Rising Sea Levels: An Introduction to Cause and Impact by Hunt Janin and Scott Mandia
More sobering facts about sea level rise to ponder… “Sea level along 600 miles of the Atlantic coast from Cape Hatteras to north of Boston has risen three to four times faster since 1990 than it has globally, says a U.S. Geological Survey study published in June. That alone is enough to add 8 to 11 inches to the global average this century.” “Sea level on the Atlantic coast has risen since the late 19th century at the fastest pace in 2,000 years, the University of Pennsylvania’s Benjamin Horton, Yale scientist Andrew Kemp and colleagues showed. East Carolina University geologist Stanley Riggs’ team found a similar trend in northeastern North Carolina.” Source: North Carolina's coast is 'hot spot' for rising sea levels by Bruce Henderson, The Charlotte Observer, Nov 4, 2012 -
Tom Dayton at 00:00 AM on 10 November 2012The Big Picture (2010 version)
Bill, for curves showing what would happen in different scenarios of emission reduction, see the RealClimate post Climate Change Commitment II. -
BillEverett at 20:26 PM on 9 November 2012The Big Picture (2010 version)
There are a couple points in the section "The Warming will Continue" that I would consider. "...if we continue to emit large amounts of greenhouse gases, the planet will continue to warm." Yes, but if we totally stopped emitting any greenhouse gases today, the plant would continue to warm. When there is an imbalance between the greenhouse gases in the atmosphere and the planet temperature, the temperature will change until equilibrium is reached. If we emitted no more greenhouse gases, then the atmospheric concentrations might decrease, which would result in the final equilibrium temperature being lower. On the other hand, if the rising temperature resulted in massive releases of methane from the permafrost and from the ocean bottom, then the greenhouse gases might increase. I am not aware of much work on the carbon dioxide-temperature equilbrium curve. The first-order approximation that I use is T=0.098c-27.1, where T is the equilibrium temperature in degrees Celsius and c is the atmospheric carbon dioxide concentration in ppm. This gives 0.34 degrees C for 280 ppm CO2 and 11.12 degrees for 390 ppm CO2. This means a 10.78 degree C increase over the preindustrial equilibrium. A relevant question is how long to reach equilibrium? I am using an estimate of about 700 years, which leads to rate of increase of a bit more than a degree per century if we assume a linear approach (very crude assumption). "The precise sensitivity of the climate to increasing CO2 is still fairly uncertain: 2–4.5°C is a fairly wide range of likely values. However, even if we're lucky and the climate sensitivity is just 2°C for doubled atmospheric CO2, if we continue on our current emissions path, we will commit ourselves to that amount of warming (2°C above pre-industrial levels) within the next 75 years." The equibrium approximation gives a temperature of 27.78 degrees Celsius for 560 ppm CO2, an increase of 27.44 degrees. I am not sure what the approach-to-equilibrium curve should look like. Naively, I would expect an initially slow response because it would be necessary to "overcome" some hysteresis in the planetary system. Then the rate of increase should become proportional to the difference between the equilibrium and the current temperatures. In other words, I would expect a slow increase gradually passing into a rapid increase that ultimately slows down to an asymptotic approach to equilibrium. I really have no idea just where 75 years from now would fall on such a curve covering about 700 years. Do you (or anyone) know of more detailed work on the equilibrium between atmospheric carbon dioxide and the planet temperature and on estimating the approach-to-equilibrium curve? -
Trent1492 at 18:31 PM on 9 November 2012Book review: Rising Sea Levels: An Introduction to Cause and Impact by Hunt Janin and Scott Mandia
Does anyone knew when or if this book going to be available in E-book form for the Barnes and Noble Tablet? -
idunno at 10:57 AM on 9 November 2012WSJ, Sandy, and Global Warming - Asking the Right Questions
Hi Dana, I think that the last sentence of this piece is flawed, in a way that begs an important question. You refer to "climate experts and policy makers". That's not who reads the WSJ. The WSJ is read by investors. The WSJ is also paywalled, as is the FT. So they are ONLY read by investors, in their own little internet ghetto. During the Storm though, the WSJ dropped the paywall, and I went to check their coverage of this year's Arctic Sea ice Cryogeddon. This was, in my opinion, insufficient to serve as a guide to investors in the energy sector. I could only find one piece, and this was apparently about Arctic foxes. Over on forbes magazine, which is not paywalled, which is also read by investors, we have James Taylor, of Heartland. At the end of the comments section on his reaction to Sandy... http://www.forbes.com/sites/jamestaylor/2012/10/31/leave-it-to-the-global-warming-alarmists-to-make-fake-lemonade-out-of-hurricane-sandy/ ... a commenter suggests that he is now guilty of "journalistic malfeasance". I don't think that it is within any of our best interests to get involved in that discussion, but I presume that editors at WSJ may be aware that this discussion is going on here; and that the rules governing the accuracy of financial journalism are more particular than those governing opinion pieces, or the environmental pages. I have written quite a lot here about the absence of just one word - "investors" - from your otherwise admirable critique. If this is OT, or OTT, please feel free to delete it. But I feel that while "climate experts and policy makers" are being well served by SkS, a third group - "investors" - are possibly being neglected. And this is perhaps unfortunate. As we are told, the market will decide, and the market is always right. Unless, of course, the market has been relentlessly fed with inaccurate, partial information by an extremely well-financed PR campaign. In that case, the market temporarily develops a huge bubble, and then there is a correction. Then the market is right again, obviously, because the market is always right, apart from when it isn't. Or summat like that. -
Doug Bostrom at 10:17 AM on 9 November 2012WSJ, Sandy, and Global Warming - Asking the Right Questions
Beyond Tom's point, reading other literature on this topic (including that employing the "normalization" speculative interpretation with attendant conjectures in place of data concerning what might have happened if chunks of chronology and happenstance had not been laid out in their actual order) shows it's at least arguable there's presently a ratio between loss attributable to entirely natural causes and loss involving a change of climate. If not so long ago that ratio couldn't be found, then it seems reasonable to think there's a rate of change involved. In any case it seems as though we have instrumentation sufficient to obviate the need for proxy measurements so riddled with pitfalls. I can see the fascination of a challenge, but if I were undertaking some construction and had a choice between a blueprint in one piece as opposed to a jigsaw puzzle with permanently missing pieces I'd choose the intact print. -
Tom Curtis at 07:18 AM on 9 November 2012WSJ, Sandy, and Global Warming - Asking the Right Questions
KR @52, I agree that the weather related catastrophes as normalized relative to geophysical catastrophes show that climate change has probably caused part of that increase. Never-the-less, Munich re is quite clear that in their opinion the major contributor to the increase has been increased population and wealth. In a study of impacts of US hurricanes, Schmidt, Kemfert and Hoppe (2008) assign responsibility for the increased losses on a ratio of 2.9 to one in favour of socio-economic factors (see quote below). If that is typical of other sorts of disasters (and in may well not be), then about 75% of the 2.5 fold increase in weather related damages is due to socioeconomic factors, and only 25% due to climate change. It should be noticed that, as normalized against geophysical catastrophes, meteorological catastrophes (including hurricanes)have increased by 100%. If the ratio found by Schmidt et al is maintained across all meteorological events, the contribution of global warming to that increase is just 63%. That is, normalization against geophysical events has reduced the impact of socioeconomic factors, but not eliminated them."Given an inflation-adjusted increase in capital stock of 438% in the region investigated, and loss elasticity of 0.44 in response to a 1% change in capital stock, it can be inferred that the loss increase due to the rise in capital stock since 1950 was approx. 190%. Although storm intensity increased by only 23.1%, loss elasticity in response to a 1% change in intensity is as much as 2.8. It can therefore be concluded that the increase in losses due to greater annual storm intensity was 65%. That is to say, the change in socio-economic conditions has a lower specific impact on the losses than the change in storm intensity. However, the loss trend is dominated by socio-economic conditions insofar as they changed much more than (climate-change induced) storm intensity during the investigation period. "
-
BWTrainer at 07:13 AM on 9 November 2012WSJ, Sandy, and Global Warming - Asking the Right Questions
@ Brian There are plenty of people far more capable than I am of debating the science with you, but I would like to address one point of yours: "The fact that he makes fairly mild assertions (not the more dramatic and unsupportable ones) makes it even harder to explain the fierceness of the criticism leveled at him." Easy. Everything Pielke Jr. says and writes is an effort to undermine taking action to combat climate change. It's especially frustrating because, unlike the common Internet trolls, Pielke is very intelligent, which means it's highly probable he recognizes that he is contradicting the majority of scientists. His constant obfuscation is totally unnecessary and unproductive. Pielke Jr. is the worst kind of denier because what he says sounds believable, which means countless time is lost refuting him when we should have already moved on to figuring out what to do about the problem. The science tells us that we can expect drought to increase both in area covered and severity, sea levels to rise and at an accelerated rate, increasing floods, hotter temperatures that threaten lives, possibly stronger hurricanes, damaged ecosystems that we depend on, and possibly an increase in insect borne diseases, among other negative consequences. So why harp on about something so incredibly narrow and short sighted as whether or not normalized losses in America due to hurricanes have increased as of 2012? Especially given the lag in the response time to burning fossil fuels, which means we wouldn't necessarily have expected to see huge changes yet. Ask the people of New York and New Jersey (not to mention the Carribean islands) if they think we should mitigate and adapt now or wait 100 years until we have a clearer signal... -
Son of Krypton at 04:48 AM on 9 November 2012Fred Singer - not an American Thinker
Singer: "Even if any of these were true, they don't reveal the cause and certainly cannot furnish temperature data like thermometers." Laced with his usual humour, I think Bill Maher managed to address this one pretty well a few weeks back: "...because heat melting ice is 'just a theory'" -
M Tucker at 03:34 AM on 9 November 2012Fred Singer - not an American Thinker
Singer is nothing more than a political creature, a conservative political creature, and his affiliations expose his bias. His rant, or Gish Gallop, is intended to give ammunition and support to the average conservative voter and elected officials who wish to oppose any legislative action at local, state, or national levels to address climate change. The level of denial with other officials I have heard recently on the media range from “humans are not responsible for the warming” to “it will not be as bad as the alarmists are predicting.” This gives a wide range of rhetorical options to the conservative man(or woman)-in-the-street to argue against a carbon tax or carbon cap legislation or expensive adaption or mitigation efforts. So they can say with confident impunity we don’t need government interference in the fossil fuel business, we don’t need expensive new seawalls or storm surge barriers, we don’t need to redesign and reengineer the subway, we don’t need to elevate streets and homes, we don’t need to relocate electrical junction boxes and circuit breakers. Some conservatives are showing signs of intelligent thought but the majority are with Singer: doubling down on stupidity. -
dana1981 at 03:18 AM on 9 November 2012Fred Singer - not an American Thinker
Whoops, Figure 8 says it's got an 11-year running average. -
dana1981 at 03:18 AM on 9 November 2012Fred Singer - not an American Thinker
Chris G @3 - the PMOD data are of TSI, but Figure 8 appears to be smoothed to remove the 11-year cycle, perhaps with a 5-year running average (it's a John Cook creation so I'm not certain). I've fixed the link to go to the PMOD page. -
Chris G at 03:10 AM on 9 November 2012Fred Singer - not an American Thinker
I'm a little puzzled about figure 8; is that solar activity by sunspots, or TSI in terms of energy output? I believe there is pretty good correlation between the two, but the leftmost part, from 1979 on, of the solar line does not have the same pattern I remember seeing before, which looked much like a sine wave with a slightly down trend. So, I wanted to see the source, but the PMOD link is broken. Otherwise, a nice encapsulation of the problems with Singer's argument, including his argument from authority in which he exposes his authority as being biased. He was summed up as something like a 'professional contrarian' on the show. That struck me as the best way to characterize him. I can't read his mind, but he certainly seems attracted to whatever position goes against the mainstream. -
vrooomie at 02:41 AM on 9 November 2012Hurricane Sandy and the Climate Connection
"So there is a (not significant) trend in US hurricane landfalls. And it's negative. Should we thank global warming for that?" Well, a few more years' worth of data should go a long way towards answering that: if indeed, AGW results in a lower rate of landfalls for Atlantic storms, good. However, I can hear it now, from the denialistas: "AGW causes LESS hurricane destruction! Alarmists never predicted that, did they?" Ah, sir...... }:-P -
Doug Bostrom at 02:26 AM on 9 November 2012The View from Germany: Tackling the real questions
quokka I really wish we could move on from this type of discussion. Seconded. Shall we starve because we don't wish to break eggs while making breakfast? Perfection can always be employed as the enemy of the good enough. The same vapid arguments about peripheral, transient fabrication emissions are employed against every technology threatening fossil fuel combustion. I'm sure we can do better than the defenders of neolithic habituation during our discussions of how we're going to claw our way out of this mess. -
WSJ, Sandy, and Global Warming - Asking the Right Questions
Tom Curtis - I agree entirely about exposure changes due to development and technology improvements affecting observed catastrophes, events thresholded by some minimum damage. That's why I pointed out Tamino's normalization to geophysical events. That normalization should at the very least minimize or remove the influences of population changes, areal development, and building codes. It will not remove the influence of better warning systems, but quite frankly weather predictions have improved faster than geophysical predictions, and therefore those normalized climate catastrophe trends are likely underestimates. Even normalized loss costs (if those can be accurate) have thresholds. For example, failure of a sea wall or a landslide is a threshold event, a divider between quite minor effects and major/expensive effects. Raw event counts would be the best measure, if you can account for changes in observations (storms not observed, for example). But (IMO) normalizing climate to geophysical events is a very useful method for trend identification - correcting for both exposure and resiliency, unaffected by repair costs. Whereas economic loss measures lead directly to conflated issues in cost estimation, inflation, exposure, resiliency, building codes, etc., and (again, IMO) are therefore both less accurate and prone to (mis)interpretations and confirmation bias effects such as Pielkes. -
gws at 01:02 AM on 9 November 2012The View from Germany: Tackling the real questions
Thanks for the links. I do not want to have the discussion either. Where I disagree with you is the statement "Nobody claims nuclear is zero emissions ...". I venture to say that this is but one example to the contrary from the industry. Not lying, just misleading ... The highlighting of that meme rather than the actual issues of large-scale switching to nuclear (@27) is what bugs me. To have a few points here about that may help onlookers to make up their mind about what efforts they might want to support to decarbonize energy production. Germans decided that renewables are the way to go, the Brits may decide to include a major nuclear component, and the US may decide ... oopsModerator Response: [DB] Fixed link. -
AndersMi at 00:51 AM on 9 November 2012Hurricane Sandy and the Climate Connection
@dhogaza, skywatcher If I understand what you're saying, you claim that the trend can be strong, but yet not statistically so relevant to be taken for sure. However, a stronger trend should also be easier to detect from a noisy background, so the fact that any detected trend doesn't even show a statistical significance suggests per se that the trend must be small, not large. Indeed, here's what Tomas Knutson from NOAA says (http://www.gfdl.noaa.gov/global-warming-and-hurricanes ): "We find that, after adjusting for such an estimated number of missing storms [storms that weren't detected by ships], there is a small nominally positive upward trend in tropical storm occurrence from 1878-2006. But statistical tests reveal that this trend is so small, relative to the variability in the series, that it is not significantly distinguishable from zero (Figure 3)." So Knutson seems to confirm what I was saying. He goes on writing: "In addition, a new study by Landsea et al. (2010) notes that the rising trend in Atlantic tropical storm counts is almost entirely due to increases in short-duration (<2 day) storms alone. Such short-lived storms were particularly likely to have been overlooked in the earlier parts of the record, as they would have had less opportunity for chance encounters with ship traffic. In short, the historical tropical storm count record does not provide compelling evidence for a substantial greenhouse warming induced long-term increase." But specifically for the Atlantic and the US? "If we instead consider Atlantic basin hurricanes, rather than all Atlantic tropical storms, the result is similar: the reported numbers of hurricanes were sufficiently high during the 1860s-1880s that again there is no significant positive trend in numbers beginning from that era (Figure 4, black curve, from CCSP 3.3 (2008) ). This is without any adjustment for "missing hurricanes". The evidence for an upward trend is even weaker if we look at U.S. landfalling hurricanes, which even show a slight negative trend beginning from 1900 or from the late 1800s (Figure 4, blue curve). Hurricane landfalling frequency is much less common than basin-wide occurrence, meaning that the U.S. landfalling hurricane record, while more reliable than the basin-wide record, suffers from degraded signal-to-noise characteristics for assessing trends." So there is a (not significant) trend in US hurricane landfalls. And it's negative. Should we thank global warming for that? -
Don9000 at 00:51 AM on 9 November 2012Fred Singer - not an American Thinker
Well done, dana. Singer strikes me as a man very much in his intellectual "anecdotage" as Ambrose Bierce liked to say about old U.S. Civil War veterans. Bierce said this in the late 19th century because the veterans loved to retell old stories of the "late lukewarmness" (Bierce's phrase)between the states that had grown variously distorted through repeated self-serving retellings and embellishments. -
Kevin C at 23:03 PM on 8 November 2012WSJ, Sandy, and Global Warming - Asking the Right Questions
Tom, Jake: Good research! One interesting thing to come out of this thread is the value of a critical voice, since the analysis in the comments has gone significantly further than the original article. That's why peer review (both pre- and post-publication) is so important in science. -
quokka at 20:55 PM on 8 November 2012The View from Germany: Tackling the real questions
@gws nuclear is not a zero CO2 emissions technology as the industry wants you to believe. Why do these discussions always have to degenerate into refutations of claims such as this? It gets nobody anywhere. It is a straw man. Nobody claims nuclear is zero emissions, nobody claims any renewables are zero emissions. While any technology is built and operated in high carbon economies there must be full life cycle emissions. The best statement from the nuclear industry is the meta study done by the World Nuclear Association on full life cycle emissions Comparison of Lifecycle Greenhouse Gas Emissions of Various Electricity Generation Sources The numbers are quite similar to those in APCC AR4: http://www.ipcc.ch/publications_and_data/ar4/wg3/en/figure-4-19.html I really wish we could move on from this type of discussion. -
gws at 19:36 PM on 8 November 2012The View from Germany: Tackling the real questions
Thank you Pete, I share your sentiment. I see from the responses to my last post that at least some of my points were understood. At little background: I grew up in Germany, and like Jonas, lived through the Chernobyl accident, which was somewhat of a formative event back then in Germany. Many turned skeptical (hint to Speedy: your derogative "anti-nukes" and other name calling does not help) about nuclear energy, so did I. In the 90s I learned about Global Warming, which I began to consider the larger issue early on. I had no preconceived notion about emissions numbers back then, but as an aspiring scientist I learned about the Oekoinstitut and appreciated its work in providing neutral scientific assessments in many areas where industry numbers went previously unchallenged, for instance regarding safety in nuclear facilities (Oekoinstitut studies in this field are nowadays regarded as a benchmark in German political discussions). When the nuclear industry began to promote its technology as "zero emission" (I think around 2000 in Germany; they do so to this day), I knew this was wrong as I had seen the Oekoinstitut report on this years before. The fact that nuclear is widely believed to be "zero CO2 emissions" is thanks to an effective industry PR campaign, not the science behind the numbers. They ignore the live cycle and they ignore that nuclear almost exclusively generates electricity (for the very few exceptions see above). Of course the numbers will change a bit when altering some input assumptions, but that does not change the simple fact that nuclear is not a zero CO2 emissions technology as the industry wants you to believe. The reactions above to the calculations done by the Oekoinstitute I think actually illustrate nicely a pschycological effect new information that does not fit into our preconceived notions has: We attack it, we do not want to accept it, it does not fit. If it does not go away, we throw all sorts of arguments at it (e.g. see Gish Gallop @46), some useful, most not. Or we ignore the evidence. It may become so bad that we go in denial, completely shutting out the evidence hurled at us. SkS has a post on that. I used to be "anti-nuke", but I have since realized that nuclear energy could make a small contribution to GHG reduction. Small, because the realities I listed above prevent current technology from a possibly larger role (bty, this is also what the Oekoinstitut says). Decarbonization is likely to be much faster if renewables are given priority, and Germany is on a track demonstrating that. Am I certain about that? Come on, only folks like speedy are "absolutely certain" about the future. -
quokka at 19:26 PM on 8 November 2012The View from Germany: Tackling the real questions
@DB, Mangano & Sherman have been repeatedly debunked. For example in this very telling piece: A curious case of cherry-picking data for the greater good. Quite similar in style to Tamino's debunking of some of the denialist nonsense including stuff that has got past peer review. I'm sure you approve of Tamino's work? It's very far from clear that there is a "real" as in statistically significant increase in mortality. If the data analysis was robust (which it is not), there is still a multitude of bridges to be crossed before any connection to the Fukushima accident could be established. Not the least being biological plausibility. Where is the evidence that people just drop dead from very low radiation dose? The WHO estimates that average dose to residents of Japan in prefectures other than Fukushima and adjoining to be in the range 0.1-1mSv (5-50% of annual natural dose in Japan) and for adjoining countries and the rest of the world to be < 0.01mSv ie < 0.5% of annual natural dose. Perhaps equivalent to one day's natural dose or less. These are almost trivially small and if there is any evidence of instant mortality from them, I'm sure many people would like to hear about - not the least being radiologists. So, not only is there no established "correlation", there is an enormous wall to climb to establish "causation". I am disappointed that this paper has been raised here.Moderator Response:[DB] The only points worthy of discussion about the Mangano & Sherman paper are:
1. Does the paper add to the understanding of the science in that area?
2. What does the peer-review have to say about the paper?
Your linked blog post at least attempts to deal statistically with Mangano & Sherman. It is a pity that the actual analysis is brief and lost among the spin and rhetoric. Which makes your blog post different from other blog contributions to the literature: Tamino has published rebuttals into the literature (Foster and Rahmstorf 2011, Foster et al 2008), as has Skeptical Science (Nuccitelli et al 2012). Even the estimable Anthony Watts has made a credible contribution to the published literature (Fall et al 2011). Others, such as Climate Audit (still no published replication of the hockey stick in the several years since they began their audit, a task in which others completed in as little as 2 days [Muir Russell Report]), have fallen short of any substantive contribution.
Since you obviously wish to make positive contributions to the literature, I'm sure that you and your linked blog post will be submitting a robust writeup to serve as a proper rebuttal of Mangano & Sherman. If you need suggestions for papers to publish in, just ask and someone will oblige you. Until then, let us discontinue what amounts to an off-topic soliloquy from the OP of this thread.
-
Albatross at 17:15 PM on 8 November 2012WSJ, Sandy, and Global Warming - Asking the Right Questions
Tom @47, That is an interesting thought. I wonder if information supporting your idea could be gleaned from census data? -
Albatross at 16:28 PM on 8 November 2012WSJ, Sandy, and Global Warming - Asking the Right Questions
Brian@48, People, especially scientists, tend to be bemused when someone makes a myriad of unsupported claims and assertions, regardless of how detailed they might be. You could have saved people here and yourself a lot of trouble had you cared to make the effort to support your claims using vetted and reliable sources-- sorry, but claiming that "formatting" is not your forte is not an excuse, cut and paste links if need be. So feel free to be "bemused", but I'm afraid you really only have yourself to blame. Brian, please don't quote mine my text, I did not say "cease to make....". What I said was: "In closing, could I request that if you insist on continuing to post here and defend Pielke Junior that you cease to make…. " That is not quite the same as how you presented it. As for the ACE index, my apologies, I missed where you acknowledged that Kevin C (not KR as I said above). Good that we agree that the ACE has been on the the increase, as has the PDI incidentally. You say @34 that, "Let's be clear: all the statements we see in the blogosphere and from politicians and other commentators attempt to attribute current losses to AGW. There is no scientific basis for such claims and this is Pielke's point. " That is exactly the topic of Dana's post. I am not personally aware of people attributing the total cost of Sandy's destruction to AGW. Some have (very likely) incorrectly stated that AGW "caused' Sandy, but asking that misguided question misses the important key issues. Oddly, Pielke cannot bring himself to agree with Dana (and by extension SkS) on this key issue, choosing instead to hurl personal insults from afar. Dana and others have made a very detailed and sound argument against the tactics and games being played by Pielke. So your quote above misses the point of Dana's post. -
Brian B at 15:37 PM on 8 November 2012WSJ, Sandy, and Global Warming - Asking the Right Questions
Albatross (#41), I appreciate the time and effort you've taken to engage my comments. I do intend to respond when I have more time. I must confess to being a bit bemused, however, over your comments such as "Well, a few people here have already pointed out errors in your posts without you acknowledging or correcting them." and "cease to make unsupported claims and instead show respect for people reading this thread" Please note that I am one person against a large number of responders, so I can't respond to everyone in the same depth that you have responded to me. Please also note that I have responded to and acknowledged multiple posts above, at all times showing respect. My responses have been detailed and substantive, especially in addressing the attached links. It's true that I haven't added links or too many quotes, but that's only because formatting is not my forte. Other than the issue of whether the ACE graph shows a trend (which response I immediately acknowledged and accepted), there haven't been too many "errors" pointed out. Mostly, posters have accepted much of what I said and then engaged in additional dialogue. You, on the other hand, appear to be more combative and perhaps that's coloring your impression of what's been said above. Regarding your many points and quotes, I do intend to respond in some detail, but I must confess to seeing very little that conflicts with anything I've said. That you think it does suggests, perhaps, that I haven't made myself sufficiently clear. -
Uncle Pete at 15:27 PM on 8 November 2012The View from Germany: Tackling the real questions
Thanks everyone for the contribution to this interesting post. My final comment is that we are all aware of the critical importance of reducing GHG emissions. It is in my view not a matter of either /or , but more of an all of the above. Whichever technology is suitable, should be deployed. And yes , for me ,I would gladly live under the cooling towers of a nuclear plant, having grown up within 2 kilometres of a sooth belching nitrogen fixing plant , fed by low quality coal.Not something I remember fondly ! -
Composer99 at 15:26 PM on 8 November 2012Fred Singer - not an American Thinker
If memory serves, in the PBS Frontline program, Singer was identified as a retired atmospheric physicist. So, by rights he should know better. -
Bernard J. at 14:35 PM on 8 November 2012Book review: Rising Sea Levels: An Introduction to Cause and Impact by Hunt Janin and Scott Mandia
I am wondering if insurance companies will be leading the charge now. They may well refuse to insure parts of the east coast of the US, meaning property owners won't be able to rebuild, and their land will become worthless overnight. Then you can imagine people demanding insurance from the government, and threatening legal action if none is forthcoming, but I suspect they would lose that battle.
I know several NSW local government staff are wondering about their councils' legal liabilities for future flooding damage from sea level-related events now that the conservative NSW government has ditched the 2009 Labor policy that had previously required councils to consider IPCC projections of sea level rise. Their concern seems to be that without this instrument with which to justify prevention of ill-advised development, they will bear the cost of damage when people who chose to construct or to buy badly-sited buildings suffer the inevitable damage and can't get their insurance companies to pay up. Or who couldn't get insurance in the first place. I'm not au fait with local council by-law practice but I'm wondering if it's possible, when there are no state legislations to protect them, for councils to make through by-law an explicit part of the permission-to-develop the condition that developers and buyers of flood-risk properties carry themselves all responsibility for future damage resulting from sea level rise. And that such responsibility is transferred with explicit and informed notification to future owners of these properties. By its very nature poperty threatened by sea level rise is usually owned and/or developed by people with considerably more wealth than most, but who are also not averse (and in fact are predisposed) to holding others responsible for the cost of damage to their properties - properties that were acquired by ignoring the best advice of scientific experts. Pre-empting this welfare-for-the-privileged by holding them a priori responsible for their own decisions is surely the most logical and the most fair way out of this mess. -
Tom Curtis at 14:01 PM on 8 November 2012WSJ, Sandy, and Global Warming - Asking the Right Questions
dana, not quite what I was saying. I think that in addition to improvements in technology, there is a further factor from increased intensity of dwelling that needs to be corrected for. A population of 500 people dispersed among 120 houses will be more vulnerable to hurricanes than the same population population in a single high rise block of units. That is because the high rise unit will have much greater structural strength than the individual houses of necessity simply to remain upright. That structural strength then provides substantial protection from storm damage. There would be additional compounding effects. In a city center with many high rises, the increased number of high rises would reduce wind speeds, and reduce the amount of air born debris both because they would lack roofs that could be blown of and because there would be fewer trees that could blow down. So, a 2012 high rise would be safer than a 1926 high rise; just as a 2012 house would be safer than a 1926 house through an improvement in technology. But additionally, a shift in population from living in houses to living in high rises would provide further protection. This is particularly important because the improvement in technology would have an approximately equal effect in all areas, whether rural or urban. But the additional protection from switching from primary residence in houses (or small flats) to primary residence in high rises will be focused in exactly those areas with the highest population rise over the twentieth century introducing a massive and systematic bias into Pielke's normalization. -
dana1981 at 13:20 PM on 8 November 2012WSJ, Sandy, and Global Warming - Asking the Right Questions
Tom @41 - I think we're saying the same thing in different ways. My point was that Pielke's method of adjusting for population and value growth is fine, but it's also insufficient, because of the failure to account for technological improvements. I think that's basically the same point you're making as well. Very informative comments by the way, thanks. -
Tom Curtis at 12:38 PM on 8 November 2012WSJ, Sandy, and Global Warming - Asking the Right Questions
KR @43 Pielke's normalization procedure handles the extra expense in sea walls, hurricane proof construction etc in an obtuse way. By increasing current building costs, and hence current estimated wealth per capita, these defensive measures will inflate the normalized costs of damages done by earlier hurricanes. Having said that, the Munich re data (used by Tamino) cannot be used without qualification. The definition of a catastrophe is based on either a minimum level of economic damage or lives lost. Therefore some events that would have been catastrophes in the past will not be catastrophes now (based on lives lost) because of better warning systems and/or construction; and a number that are catastrophes now may not have been catastrophes in the past (based on the monetary limit) due to increased wealth and populations at risk. Consequently a count of numbers and intensity of hazards would be even better. With that in mind, and with direct reference to Sandy, the results from Grinsted et al are particularly interesting: The positive trend in strong surge events (and hence hurricanes) is straightforward, as is the increase in US (not North Atlantic) -Accumulated Cyclone Energy.
-
Neven at 11:15 AM on 8 November 2012WSJ, Sandy, and Global Warming - Asking the Right Questions
Thanks for the extra info, Tom Curtis. I had seen that graph on Pielke's blog, and that Great Miami Hurricane peak made me think of the elephant that wriggles his trunk. -
WSJ, Sandy, and Global Warming - Asking the Right Questions
I would strongly argue that number of events is a much more useful statistic than normalized loss. Loss reductions due to technology or building codes come at their own (and notably absent from Pielke's normalization) costs, namely the cost of those advances and the extra building materials needed to weather such storms. Number of events, if properly normalized for observation rates, is by contrast technology neutral. it tracks actual changes in the environment (not how much concrete you put into a seawall), reflects an ongoing rate of investment (how many seawalls are needed for future conditions, and how many need to be rebuilt due to changes?), and tells us something about the world we live in. I would strongly suggest looking at Tamino's post on Unnatural Catastrophes, as per the Opening Post: based upon Pielke Jr's misdirection and suggestions from commentors (including me), he uses non-climate catastrophes such as earthquakes, volcanos, and tsunamis (I cannot see the last two being strongly affected by any climate changes to date) to normalize weather catastrophes against technologies, demonstrating that climate events do indeed have a strong upward trend. Normalized losses lead directly to arguments over inflation, discount rates, population density, etc. - I suggest dropping that thread entirely as simply a region of confusion. Event counts are a much cleaner statistic. -
quokka at 11:05 AM on 8 November 2012The View from Germany: Tackling the real questions
At the risk of inviting moderation I am going to raise the CHP issue again. Here is an IEA report on CHP: Combined Heat and Power Figure 7 corresponds exactly with my understanding of CHP and shows a 21% improvement in emissions/energy efficiency over separate gas turbine and boiler installations. The IEA's 75% efficiency figure corresponds to ~297 g CO2/kWh assuming natural gas combusted at perfect efficiency has emissions of 223g/kWh. I regard the IEA as an authoritative source, and this is my last comment on this. -
Doug Bostrom at 11:01 AM on 8 November 2012Book review: Rising Sea Levels: An Introduction to Cause and Impact by Hunt Janin and Scott Mandia
Thanks to being torn between forces opposed to reality and reality itself, at least in the United States insurance companies find themselves in a quandary. They're at risk of large liabilities and being sued by customers if they do reference climate change, while simultaneously facing the threat of shareholder lawsuits if they don't. They're not getting much useful assistance or guidance from the domestic side. More details here. In other parts of the world insurers and re-insurers are biting the bullet and getting past this difficult moment, employing correct arithmetic as accounting practice demands. Wishful thinking doesn't show up in balance sheets, P&L, etc. -
Albatross at 10:57 AM on 8 November 2012WSJ, Sandy, and Global Warming - Asking the Right Questions
BrianB @15 and @33, You say "I don't believe I've made any erroneous claims, certainly none has been pointed out above, but I am open to correction if I have." Well, a few people here have already pointed out errors in your posts without you acknowledging or correcting them. We'll see how you respond to my comments, but to be honest I expect you to either ignore them or double down. While I do not disagree with everything you say, the literature does not support many of the unsupported/unsubstantiated assertions that you make in your post nor are matters as clear cut as you suggest. In fact, you seem to be using the very same debating technique that Pielke Junior uses. On to addressing your claims: 1) "The signal, whatever it might be, is much smaller than the noise. This will remain true for at least a century. No amount of wishing is going to make it so." Why would someone wish for hurricane damage to increase? Nevertheless, the emergence of the signal is not 100 years as you claim. From Emanuel (2011) (my bolding): "For the three climate models that have increasing damage, the climate change signal emerges from background variability, according to a recently published criterion, on time scales of 40, 113, and 170 yr, respectively; the decreasing signal of the fourth model is not clearly distinguishable from noise even after 200 yr. On the other hand, the probability distributions of damage in a warming climate become distinguished from those of background climate in as little as 25 yr; thus, we argue that those concerned with future U.S. country-wide tropical cyclone damage on decadal time scales would be well advised to include climate change as a consideration." See also Composer99`s comment @21. 2) "There can be no AGW signal in hurricane losses in the U.S. because there has been no change in landfalling hurricane frequency or strength since record-keeping started. The trends, though not significant, are both down, in fact. " Emanuel(2011)recently addressed this issue, "While basin-wide metrics of tropical cyclone activity show statistically robust changes in the aforementioned model-based projections and may already be evident in observations, there is little evidence for a trend in tropical cyclone–related damage in the United States (Pielke et al. 2008). This is not surprising, as most wind-related damage is done by tropical cyclones that happen to be at high intensity at the time they make landfall. This is a small subset of all storms over a relatively small fraction of their typical life spans, thus the statistical base of potentially damaging events is small compared to that of the basin-wide set of storms." This issue was also dealt with a while ago when Pielke Junior attempted to undermine a 2005 paper by Emanuel. That did not end well for Pielke. Also, does it not strike you odd that on the one hand Pielke likes to now focus on land-falling category three hurricanes in the USA? When someone pointed out to him recently that there has been an increase in insured losses for specific disaster types in the USA and Germany, Pielke's retort was, "It is a big planet, I can find up and down trends for various phenomena over various time periods. Such arguments are very similar to "Temperatures have cooled in Atlanta over 80 years so global warming is false." That is just bluster. It also demonstrates that he seems to choose regional areas or the globe depending on which one best fits with his narrative. Such contradictory and internally inconsistent arguments made by contrarians and delayers is commonplace. 3) "Whether that detected trend is true or not, he agrees that no attribution of losses can be made to hurricanes since the signal is missing in the landfalling data." Can you provided a citation please? The point is that, unlike Pielke, Emanuel looks at all the data. From a recent Nature paper by Mendelsohn et al. (2012) (on which Emanuel was a co-author): "One potential impact from greenhouse-gas emissions is increasing damage from extreme events. Here, we quantify how climate change may affect tropical cyclone damage. We find that future increases in income are likely to double tropical cyclone damage even without climate change. Climate change is predicted to increase the frequency of high-intensity storms in selected ocean basins depending on the climate model. Climate change doubles economic damage, but the result depends on the parameters of the damage function." Also, from Emanuel (2011), "Thus, the weight of current evidence suggests a possibly substantial increase in damaging Atlantic hurricanes over the current century, though uncertainty remains large." and from Villarini and Vecchi (2012), "Under uniform SST warming, these results indicate that there is a modest sensitivity of intensity, and a decrease in tropical storm and hurricane frequencies. On the other hand, increases in tropical Atlantic SST relative to the tropical mean SST suggest an increase in the intensity and frequency of North Atlantic tropical storms and hurricanes." Yet we still have some people arguing for delay in reducing GHG emissions or people like Pielke Junior providing fodder for those who deny the theory of AGW, or those who are against implementing measures to make meaningful reductions in GHG emissions. No wonder planners and those tasked with protecting the public and property are not listening to the likes of Pielke Junior. 4) "Unfortunately, Emanuel's data has problems as well, since long-term coverage of the Atlantic basin storm record is spotty at best and suffers from measurement bias induced by the satellite era. Emanuel's improved statistics are of questionable value given the uncertain status of systematic errors." As I suspect you know, all datasets and all methods have their limitations. Odd then that you choose to highlight those in Emanuel's data, yet ignore the uncertainties and limitations in Pielke et al's methods and data. From SREX: "Long-term trends in economic disaster losses adjusted for wealth and population increases have not been attributed to climate change, but a role for climate change has not been excluded (high agreement, medium evidence). These conclusions are subject to a number of limitations in studies to date. Vulnerability is a key factor in disaster losses, yet it is not well accounted for. Other limitations are: (i) data availability, as most data are available for standard economic sectors in developed countries; and (ii) type of hazards studied, as most studies focus on cyclones, where confidence in observed trends and attribution of changes to human influence is low. The second conclusion is subject to additional limitations: (iii) the processes used to adjust loss data over time, and (iv) record length." Further, as numerous people have pointed out now, the normalization technique used by Pielke and others take into account those factors which can increase the losses, but fail incorporate (or properly account for) those factors that work to reduce losses. Furthermore, many studies on losses look only at the impacts from wind, when water damage is a huge factor; for superstorm Sandy the massive storm surge and flooding was responsible for much of the damage, yet many insurance companies do not provide coverage for flooding. So any metric that ignores the observed acceleration of the hydrological cycle will underestimate the full impact of the storms. 5) "Please note that the graph given above for Atlantic basin ACE appears to have no statistically significant trend with the noise as large as it is. If you think the trend is significant, please provide the uncertainty." Your interpretation is incorrect. We don't "think" the trend is positive (please don't play rhetorical games), rather the data show that your assertion is false and that the data do have a statistically significant trend as demonstrated by KR above. 6) "The arguments repeatedly made above about improvements in adaptation, such as better building codes, having an effect on losses are misguided. While substantial improvements in building codes have indeed been made, few of these adaptations are aimed specifically at hurricane losses,...." This is false. It is also chock full of unsupported claims. Installing "hurricane straps", for example, has been required for many years now in certain locales. Other measures to specifically mitigate hurricane damage have been implemented as shown by jake above. In closing, could I request that if you insist on continuing to post here and defend Pielke Junior that you cease to make unsupported claims and instead show respect for people reading this thread by investing some time and providing citations and supporting evidence from reliable and vetted sources to support your claims. Otherwise, you are just wasting everyone's time. Thanks! -
John Brookes at 10:37 AM on 8 November 2012Book review: Rising Sea Levels: An Introduction to Cause and Impact by Hunt Janin and Scott Mandia
I am wondering if insurance companies will be leading the charge now. They may well refuse to insure parts of the east coast of the US, meaning property owners won't be able to rebuild, and their land will become worthless overnight. Then you can imagine people demanding insurance from the government, and threatening legal action if none is forthcoming, but I suspect they would lose that battle. But this will happen all over the world, as many cities are now "in the wrong place". Practical decisions will have to be made to either defend or abandon. Hopefully the rise will be slow enough for an orderly retreat. -
Tom Curtis at 10:31 AM on 8 November 2012WSJ, Sandy, and Global Warming - Asking the Right Questions
Neven @14, Pielke shows the following graph of normalized annual losses: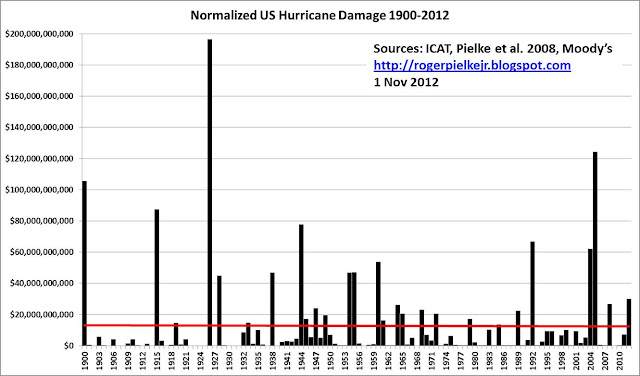 The figures are normalized to 2012 values. Looking at his data for Pielke et al, (2008),he shows only seven land falling hurricanes showing greater than 35 billion dollars damage, normalized to 2005 levels (ie, approx 40 billion normalized to 2012 levels). His claim that Sandy would rank as only the 17th most damaging hurricane is therefore false, assuming Moody's estimates are reasonable.
Oddly, Pielke shows a Sandy estimate of 30 billion, contrary to Moody's, which he cites and links to. Moody's actually gives an estimate of 30-50 billion; from which it appears that Pielke has deliberately reported the low end of the estimated range as being Moody's estimate.
Further, it is illegitimate to quote his "normalized damages" as data for the most costly hurricane. The most damaging hurricane based on his normalized costs was the Great Miami Hurricane of 1926, with normalized losses of 157 billion dollars (normalized to 2005), but the actual cost in 1926 was just 105 million dollars, equivalent to a cost of one billion dollar in constant 2005 value, or 1.15 billion in 2012. Quoting the actual price parity cost is misleading because the increase in costs are largely a consequence of increasing population and wealth; but that does not excuse Pielke's inaccurate language.
What is more, and contrary to Dana, I have severe doubts about Pielke's normalization procedure. As noted, the most highest normalized cost of any land falling Hurricane in the US, according to Pielke is, 157 billion dollars (2005 value). That means normalization has increased the recorded value by nearly 1,500 fold. By contrast, the other two hurricanes making landfall in 1926 have multipliers of 1250 (Hurricane 1, landfall in Florida) and 150 (Hurricane 3, landfall in Louisiana). The second most costly hurricane in Pielke's data was the 1900 hurricane of Galveston ($78,000,000,000; multiplier approx 2,600). That multiplier contrasts starkly with the 160 multiplier of hurricane 4 of 1901.
It is not difficult to recognize the issue involved. Lousiana's population has increased 2.2-fold since 1926, whereas that of Miami has increased more than ten fold in the same period. Galveston is also an area of very high population growth. That population growth has been matched by an increase in land values and in intensive residency. Both population and wealth per capita are factors in Pielke's normalization.
Crucially, however, when cities develop very large populations, construction techniques do not stay constant. Miami, for example has moved from low houses and flats towards large reinforced concrete sky scrapers. The result is a significant loss of vulnerability to storm damage quite independent of any issues related to superior construction techniques for individual housing.
Put simply, dropping a tree on a house destroys it. Doing the same to the Empire State Building will shatter a few panes of glass. You cannot "normalize" the destructive impact of the former relative to the later simply by multiplying costs by the increase in population per square kilometer and the per capita wealth. Such a simplistic approach can only work in regions where the dominant style of construction has remained constant over time, ie, in rural areas and/or small cities and towns.
The crucial point here is that Pielke's flat trend in normalized losses depends on the existence of a very few, very costly (in normalized terms) storms early in the record. Without Galveston 1900, Galveston 1915, Great Miami 1926 and Hurricane 11 1944 (Florida land fall), the trend in normalized damages would undoubtedly be upwards. If Pielke's normalization took proper account of change in building design and standards (demonstrated by Jake above), his data would provide clear evidence that hurricanes are becoming more damaging with increased global temperatures.
The figures are normalized to 2012 values. Looking at his data for Pielke et al, (2008),he shows only seven land falling hurricanes showing greater than 35 billion dollars damage, normalized to 2005 levels (ie, approx 40 billion normalized to 2012 levels). His claim that Sandy would rank as only the 17th most damaging hurricane is therefore false, assuming Moody's estimates are reasonable.
Oddly, Pielke shows a Sandy estimate of 30 billion, contrary to Moody's, which he cites and links to. Moody's actually gives an estimate of 30-50 billion; from which it appears that Pielke has deliberately reported the low end of the estimated range as being Moody's estimate.
Further, it is illegitimate to quote his "normalized damages" as data for the most costly hurricane. The most damaging hurricane based on his normalized costs was the Great Miami Hurricane of 1926, with normalized losses of 157 billion dollars (normalized to 2005), but the actual cost in 1926 was just 105 million dollars, equivalent to a cost of one billion dollar in constant 2005 value, or 1.15 billion in 2012. Quoting the actual price parity cost is misleading because the increase in costs are largely a consequence of increasing population and wealth; but that does not excuse Pielke's inaccurate language.
What is more, and contrary to Dana, I have severe doubts about Pielke's normalization procedure. As noted, the most highest normalized cost of any land falling Hurricane in the US, according to Pielke is, 157 billion dollars (2005 value). That means normalization has increased the recorded value by nearly 1,500 fold. By contrast, the other two hurricanes making landfall in 1926 have multipliers of 1250 (Hurricane 1, landfall in Florida) and 150 (Hurricane 3, landfall in Louisiana). The second most costly hurricane in Pielke's data was the 1900 hurricane of Galveston ($78,000,000,000; multiplier approx 2,600). That multiplier contrasts starkly with the 160 multiplier of hurricane 4 of 1901.
It is not difficult to recognize the issue involved. Lousiana's population has increased 2.2-fold since 1926, whereas that of Miami has increased more than ten fold in the same period. Galveston is also an area of very high population growth. That population growth has been matched by an increase in land values and in intensive residency. Both population and wealth per capita are factors in Pielke's normalization.
Crucially, however, when cities develop very large populations, construction techniques do not stay constant. Miami, for example has moved from low houses and flats towards large reinforced concrete sky scrapers. The result is a significant loss of vulnerability to storm damage quite independent of any issues related to superior construction techniques for individual housing.
Put simply, dropping a tree on a house destroys it. Doing the same to the Empire State Building will shatter a few panes of glass. You cannot "normalize" the destructive impact of the former relative to the later simply by multiplying costs by the increase in population per square kilometer and the per capita wealth. Such a simplistic approach can only work in regions where the dominant style of construction has remained constant over time, ie, in rural areas and/or small cities and towns.
The crucial point here is that Pielke's flat trend in normalized losses depends on the existence of a very few, very costly (in normalized terms) storms early in the record. Without Galveston 1900, Galveston 1915, Great Miami 1926 and Hurricane 11 1944 (Florida land fall), the trend in normalized damages would undoubtedly be upwards. If Pielke's normalization took proper account of change in building design and standards (demonstrated by Jake above), his data would provide clear evidence that hurricanes are becoming more damaging with increased global temperatures.
-
John Hartz at 10:03 AM on 8 November 2012WSJ, Sandy, and Global Warming - Asking the Right Questions
The editorial, Recent storms highlight need for Northeast hurricane mitigation plan posted on Business Insurance on Nov 4, 2012 nicely dovetails with Dana’s OP and undercuts Roger Pielke Jr’s rather shallow analysis. -
dana1981 at 09:21 AM on 8 November 2012WSJ, Sandy, and Global Warming - Asking the Right Questions
Kevin @38:"My objection is that all we're really saying is that ACE is more correlated with ocean temperature than with time"
Indeed, and ocean temperature is of course correlated with human-caused global warming, which is increasing over time. Really you just can't escape the fact that global warming makes hurricanes more intense. Pielke tries to escape that by arguing that this increased intensity hasn't directly impacted economic losses along the US coast yet, which may or may not be true, but even if true, there's no reason to expect this fortune to continue in the future. Which is the point of this post. -
Kevin C at 08:50 AM on 8 November 2012WSJ, Sandy, and Global Warming - Asking the Right Questions
Brian: OK, so the Grinsted and Mann papers achieve a homogenous record but don't measure quite what you want them to. Unfortunately when dealing with proxies you have to take what you can get. If ACE is the only measure which specifically addresses your questions, then I guess we have to work with that. So the next step is to see if we can extract any further information from the ACE. Hurricane activity is certainly correlated with AMO (unsurprisingly, because AMO is primarily a temperature measure). So if we do a multivariate regression with AMO and a linear term, we will get a better fit to the data and thus reduce the uncertainties, unless the extra parameter in the denominator is enough to counter the improvement. I can give that a go over the next few days, but it's a bit of work, so if you have any objections to the methodology then please make them now. (My objection is that all we're really saying is that ACE is more correlated with ocean temperature than with time. I'm very happy to re-frame the discussion in those terms, but unless RPJr is projecting an imminent end to warming I think it is unhelpful to his case.) -
quokka at 08:50 AM on 8 November 2012The View from Germany: Tackling the real questions
@michael sweet There are currently zero nuclear power plants being financed by private money in the entire United States As far as I am aware the Vogtle AP1000s build is privately financed. There is an offer of a federal loan guarantee, but it is not yet agreed and the senior partner, Southern, is saying that it may not be necessary as their financing costs so far have been less than projected. Southern Co CEO says nuclear loan guarantee less enticing Construction is underway, and I would ask for any evidence that Vogtle is not (mainly) privately financed. As I understand it there will be some customer levy to help offset financing costs. I can't see anything wrong with that in principle. In Germany the retail levy paid by consumers to support renewables is to rise to over 5 Euro cents per kWh. I see no problem in principle with that either. The question is whether the money is being wisely spent to achieve decarbonization as rapidly as possible. Surely that goal is the point of all of this.
Prev 1057 1058 1059 1060 1061 1062 1063 1064 1065 1066 1067 1068 1069 1070 1071 1072 Next


