


 Arguments


Recent Comments
Prev 1250 1251 1252 1253 1254 1255 1256 1257 1258 1259 1260 1261 1262 1263 1264 1265 Next
Comments 62851 to 62900:
-
Dikran Marsupial at 03:11 AM on 28 February 20122nd law of thermodynamics contradicts greenhouse theory
Bottom of page 5 "For example if the object absorbs visible light, then it will reemit infrared light, which we can't see, and therefore it still appears black" Postma half-corrects his initial definition of a blackbody here (would have been better just to get it right in the first place), but this statement is obviously incorrect. As an example, consider solar power plants which can be used to make objects glow white hot (and thus be producing visible light) Virtually every scientific statement Postma has made by the end of page 5 is wrong. -
Dikran Marsupial at 03:05 AM on 28 February 20122nd law of thermodynamics contradicts greenhouse theory
Catastrophic error - second paragraph of page 5 When a blackbody has reached thermal equilibrium, it can no longer absorb more light for heating and therefore has to reemit just as much energy as it is absorbing" This is factually incorrect; the blackbody never stops absorbing light - it is a blackbody, that is what they do. Likewise if it is above absolute zero it also never stops emitting radiation. It reaches radiative equilibrium when its emissions (which depend on temperature) rise suffuciently high that emission matches absorption. If Postma can't even explain radiative equilibrium or what a blackbody does correctly, I think we can safely say that YOGI needs to pick his/her has up off the floor. -
Dikran Marsupial at 03:00 AM on 28 February 20122nd law of thermodynamics contradicts greenhouse theory
Next problem, first paragraph of page 5 tries to explain "radiative thermal equilibrium" without mentioning that the blackbody is constantly radiating heat. Not strictly speaking an error, but again it doesn't inspire confidence. -
Dikran Marsupial at 02:56 AM on 28 February 20122nd law of thermodynamics contradicts greenhouse theory
Next error, page 4 "A blackbody is simply exactly what it sounds like: an object that is completely black. The reason why it is black is because it absorbs 100% of the light that strikes it, and doesn't reflect any of it back. Therefore it appears black" The sun is a blackbody, doesn't appear very black to me. The middle sentence is sort of true, a blackbody does absorb all the light that falls on it, but that doesn't mean that it appears to be black. I know that is only a fairly trivial point, but it doesn't encourage confidence when it comes to less trivial issues. Note this is the second scientific point in the paper so far and Postma has made errors in both of them. -
Dikran Marsupial at 02:50 AM on 28 February 20122nd law of thermodynamics contradicts greenhouse theory
Well I got as far as page 3 before spotting the first scientific error (mainly becuase the first two and a half pages are rhetorical posturing and essentially free of any scientific content). Postma writes "Does back-scattered infrared radiative transfer act like a blanket upon, and explain the temperature of, the surface of the Earth, analogeous to the way a greenhouse building works..." Immediate fail. Greenhouses work principally by preventing convection. Nobody claims that the Greenhouse effect works in the same way an actual greenhouse, even Fourier knew this. -
Camburn at 02:20 AM on 28 February 20122nd law of thermodynamics contradicts greenhouse theory
I think YOGI has to understand that all mass exibits energy, and that all mass is continuously cooling by emitting energy. What slows that cooling is the absorbtion of energy. The mass doesn't care if the energy came from a colder object or a warmer object. When mass absorbs a photon from a colder object, all that happens is the RATE of cooling slows a bit. The whole crux is that the Sun adds energy, which will result in warmth, but matter is still doing its thing by trying to cool. -
Bob Lacatena at 02:18 AM on 28 February 2012Satellites find over 500 billion tons of land ice melting worldwide every year, headlines focus on Himalayas
45, Matthew L,My problem with the missing heat being at the bottom of the ocean is that heat will expand the sea wherever it is hidden.
I think the problem with this premise is two-fold. First, the volume of water involved in this in the deep ocean is huge, so you are distributing that heat over a very, very large volume of water. As such, the per-mole addition of heat, and hence any expansion, is very, very small. Second, the water in question is under intense pressure, so I think the percentage increase in volume will be greatly reduced. I know very little about the behavior of liquids, however, so this last is an assumption on my part, not a fact. -
Utahn at 01:58 AM on 28 February 2012The Year After McLean - A Review of 2011 Global Temperatures
"I have recently been in contact with McLean, who has promised to write a post about his prediction and results, which he claimed might somehow surprise me..." I just looked at the link but couldn't see anything, is it on the front page or have we heard anything? -
Matthew L at 01:52 AM on 28 February 2012Satellites find over 500 billion tons of land ice melting worldwide every year, headlines focus on Himalayas
Apologies for a couple of issues with that last post (new here!). I could not get the image to embed properly from Photobucket despite resizing it to a width of 450. Just click on the link below the broken image to see it. Also the final question should be: Is it possible to calculate how much extra water must be located on land to explain the slow-down in sea level rise?Response:[DB] Photobucket is notoriously difficult to link to from this Forum, with images sometimes appearing for a time and then disappearing. Proper linking syntax is here.
Fixed image, for now.
-
Matthew L at 01:46 AM on 28 February 2012Satellites find over 500 billion tons of land ice melting worldwide every year, headlines focus on Himalayas
I recently had an e-mail exchange with Dallas Masters at the CU Sea Level Research Group at the University of Colorado. I was interested in creating a graph of the trend in sea level rise over the period of the satellite record. I calculated a 12 month moving average and then applied a 5 year linear regression analysis to arrive at the following chart. He confirmed that it was a reasonable representation of the trend.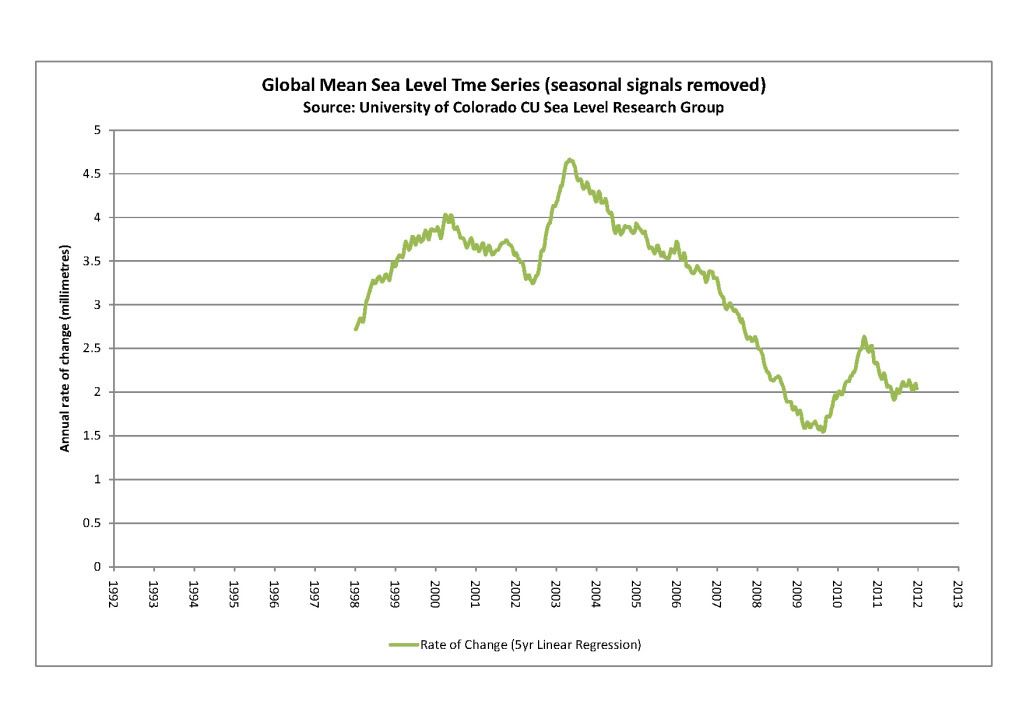 Global mean sea level reducing trend
My problem with the missing heat being at the bottom of the ocean is that heat will expand the sea wherever it is hidden. Surely the sea would be expanding more quickly rather than less if both the temperature of the deep oceans was rising and the glaciers melting? I have seen the explanation of recent flooding due to La-Nina but am sceptical that this could account for such a large and sustained decline in the rate of sea level rise.
Is it possible to calculate how extra water must be located on the Earth to explain the slow-down in sea levels?
Global mean sea level reducing trend
My problem with the missing heat being at the bottom of the ocean is that heat will expand the sea wherever it is hidden. Surely the sea would be expanding more quickly rather than less if both the temperature of the deep oceans was rising and the glaciers melting? I have seen the explanation of recent flooding due to La-Nina but am sceptical that this could account for such a large and sustained decline in the rate of sea level rise.
Is it possible to calculate how extra water must be located on the Earth to explain the slow-down in sea levels?
-
David Kirtley at 01:33 AM on 28 February 20122012 SkS Weekly Digest #8
I'm from the U.S. In no particular order here are my top 5 climate science sites: Climate Progress Open Mind Climate Denial Crock of the Week RealClimate DeSmogBlog I see that Richard Lindzen gave a talk to the British House of Commons. It appears to be the same old stuff. But is there any chance you'll do a debunking post on it? -
CBDunkerson at 01:30 AM on 28 February 20122nd law of thermodynamics contradicts greenhouse theory
DB, actually the PDF specified by YOGI appears to be a different screed by Postma wherein he insists that the "Greenhouse Theory" contradicts the laws of thermodynamics. Including alot of the usual 'energy cannot flow from a colder area to a hotter one' idiocy. So, complete nonsense... but on topic nonsense.Response:[DB] Noted. But as Dikran points out, Postma commits a great number of grievous errors in this new piece. Perhaps a continuing series on Postma, with this one comprising "Joseph Postma is Wrong About _________, Pt. 4"?
-
muoncounter at 01:12 AM on 28 February 2012Satellites find over 500 billion tons of land ice melting worldwide every year, headlines focus on Himalayas
mspelto#42: That's what I was afraid of. As with Arctic ice melt, this is another one of those 'its worse than we think' moments. Would it be possible to do a 'ground truth' calibration, bringing the GRACE-derived ice loss computations into better agreement with what you actually see? (I'm old enough to remember the world before satellites, when you actually had to use measurements made by folks in the field). -
muoncounter at 01:06 AM on 28 February 2012The Deep Ocean Warms When Global Surface Temperatures Stall
RobP#67: "the warming rate abruptly shrinks after 2003, when the more precise ARGO data makes up the majority of ocean temperature measurements." If you are suggesting that the change in rate is due to the changeover in data acquisition systems, wouldn't it be better to say 'the warming rate apparently shrinks'? But even that case in not well-supported by the error bars in your figure b: On the more recent data, uncertainty appears to be ~3x that of the older data. Are we able to show a statistically significant difference between, for example, the central NODC bar of 0.5+/-0.2 (early) and 0.1+/-0.6 (later)? This combination of 'surface temperatures stall' and 'ocean heating slows' seems to be the message we hear from the opposition. A better message could be phrased: Thermal cycles in the oceans are as yet not completely measured; we do know they have the capacity to mask and delay what we see on the surface by storing large quantities of energy. Despite that, as FR2011 show, there's been no change in the underlying atmospheric warming rate. And thus we really should be worried what will happen when that heat comes back to see us, especially since even the la Nina years keep getting warmer. -
Matthew L at 01:05 AM on 28 February 2012Satellites find over 500 billion tons of land ice melting worldwide every year, headlines focus on Himalayas
Numbers aside, am I the only person here troubled by the choice of map projection used in Figure 1 for the GRACE trend? I thought we had long ago abandoned using projections that showed Greenland as almost the same area as Africa! They were first used to make Europe and the USA seem bigger and more important than they really are. In this instance it makes the "blue" areas of ice loss closer to the poles much larger and more important than they warrant, and the "pink" areas of ice gain closer to the equator smaller and less important. Also, can somebody explain where the ice is that appears to have accumulated in the Amazon basin, Zambia and Singapore? I think the problem for this map is that it is mapping ALL changes in gravity, not just ice loss. I was under the impression that India was still slowly crashing into Asia and pushing up the Himalayas. If that is the case could the growth in mass there be down to accumulated build up of crust material rather than ice in glaciers? -
YOGI at 01:03 AM on 28 February 20122nd law of thermodynamics contradicts greenhouse theory
[DB] I`ll hang my hat on this: http://www.tech-know.eu/uploads/Understanding_the_Atmosphere_Effect.pdfResponse:[DB] You are thus relatively off-topic on this thread. The more appropriate thread for your discursion is Postma disproved the greenhouse effect. Everyone please respond there.
Yogi: Please read the above thread and the following threads in their entirety
-
Tom Curtis at 00:42 AM on 28 February 20122012 SkS Weekly Digest #8
Like Adelady (who is from Adelaide, Australia for the non-Aussies for whom it may not be so obvious) I am from Australia, but from further East and North a bit at Brisbane. My favourite climate science sites (excluding SkS) are: Open Mind for detailed dissection of so-called skeptical arguments; Science of Doom for detailed analysis of the science a very readable undergraduate level; Deltoid for detailed discussion of Australian Media coverage of climate science, and some other gems; Rabbett Run for a quirky look at climate science, climate politics and just about anything that takes his fancy (I did mention quirky, didn't I); and because you've got to laugh if your not going to cry - Throbgoblin, which unfortunately has been inactive for three months but well worth reading back posts if you haven't already. Cutting the list down to five does a great disservice to a number of other excellent blogs, but that is the way the question was framed. I'll cheat a bit and direct you to my largely inactive blog for the full list of blogs I watch.Moderator Response: [JH] Asking readers to name their top five sites seemed to be a resonable request. Asking for readers to list more than that would discourage responses. -
Dennis at 00:40 AM on 28 February 2012DenialGate - Highlighting Bob Carter's Selective Science
Two things stand out from this. First, it should be a relatively straight-forward exercise for skilled scientists to publish peer-reviewed articles which highlight and correct the errors in articles like McLean et al. (2009). I don't want to overburden the excellent work SkS does, but it seems we need a database on those flawed articles that points directly to the published rebuttals (and, in some cases, articles waiting for publication). Second, you mention how Carter has published science in non-science journals. I think it's time for the established organizations in social sciences and other fields, like economics and political science, to step up and start publicly chastising journals for publishing "findings" outside their area of expertise. There's a lot of this out there (think E&E) that gets mentioned in the public policy arena, but they are not peer reviewed by qualified scholars. Economists, political scientists, sociologists, etc. know nothing about about physics, chemistry and biology, so they should stop writing that they do, and be called out when they try. -
mspelto at 00:39 AM on 28 February 2012Satellites find over 500 billion tons of land ice melting worldwide every year, headlines focus on Himalayas
muoncounter that is a safe assumption. What looks more reliable detailed mapping of thousands of glaciers indicating large net losses, or a mountain wide assessment that does not fit other observations and is at odds with the Matsuo and Heki (2010) analysis of the same are using GRACE just a year ago. -
OPatrick at 00:27 AM on 28 February 20122012 SkS Weekly Digest #8
I'm in the UK First stops of call for discussion of the science and impacts, after here as you say, are Real Climate, Open Mind (Tamino), My View on Climate Change(Bart's) (when he's in the mood to post anything), Science Daily andThe Guradian, though that's as much to see what the media are saying as to get new info. I think I ought to visit The Science of Doom more often. Then places like Planet3.0 for meta-discussions. -
Lotharsson at 21:51 PM on 27 February 2012David Evans' Understanding of the Climate Goes Cold
And also, Ms. Nova has been told repeatedly that her beliefs on the science pertaining to this are in error, so Evans knows that too, but insists on perpetuating myths and misinformation.
She is still making that claim as well - e.g. in comments here. -
Lotharsson at 21:43 PM on 27 February 2012David Evans' Understanding of the Climate Goes Cold
Evans has a (new?) somewhat similar article that is being cited by "skeptics". He argues that net feedback is so strongly negative that climate sensitivity is perhaps as low as 0.25 x 1.1 = 0.275 degrees C per CO2 doubling - although he allows that it may be as high as 1 C per doubling. (No citation for that claim though!) And at the bottom the article cites his Electrical Engineering Ph.D. - and argues that EE is "...The area of human endeavor with the most experience and sophistication in dealing with feedbacks and analyzing complex systems...". That's particularly interesting, because the article argues that:If a system instead reacts to a perturbation by amplifying it, the system is likely to reach a tipping point and become unstable (like the electronic squeal that erupts when a microphone gets too close to its speakers). The earth's climate is long-lived and stable — it has never gone into runaway greenhouse, unlike Venus — which strongly suggests that the feedbacks dampen temperature perturbations such as that from extra CO2.
This argument would garner him a Fail in his undergrad automatic control theory classes. He is effectively suggesting to his uninformed audience that there can only be either positive runaway feedback or negative ("dampening") feedback - and that positive non-runaway feedback that merely amplifies a signal does not exist (in practice, perhaps even in theory). His former EE professors might want to have a quiet word with him on that point, as would many amplifier designers. And there's more to dig into in that article... -
Rob Painting at 20:38 PM on 27 February 2012Monckton Misrepresents Reality (Part 3)
owl905 - The model therefore shows that greater amounts of heat are being sequestered in the deep ocean when global surface temperatures are in hiatus periods And note the summary at the end: "Heat buried in the deep ocean remains there for hundreds to thousands of years. It is not involved in the heat exchange occurring in shallower layers" But the surface layers are warming. We experience that as global warming. This appears to be a common fallacy - that the deep ocean warming means the surface ocean isn't warming. That's clearly not correct, and perhaps needs a blog post to dispel this canard. -
Philippe Chantreau at 20:22 PM on 27 February 2012The Deep Ocean Warms When Global Surface Temperatures Stall
Adelady, that instructor was correct. Most people approach airplanes from their exeperience driving cars but they are much more similar to boats. They move in a fluid. That was a major message I tried to pass on to my flight students. It applies in all conditions, not only bad weather. Another important message was that one should not find himself in bad weather if applying proper decision making... -
Lloyd Flack at 19:53 PM on 27 February 2012Monckton Misrepresents Reality (Part 3)
I think talk of fraud is wrong headed. I think Monkton indulges more in willful blindness than in lying. He knows what he wants to believe and reads to find something that supports it. He belives his own BS because he can't bear to admit that he might have to come to an accomodation with political opponents. Like most deniers! And there can be other things such as conceit as well. -
owl905 at 19:26 PM on 27 February 2012Monckton Misrepresents Reality (Part 3)
@Tom Curtis, thanks for the effort, but you angled off in the wrong direction. The objection isn't that heat doesn't get to the deep oceans. The objection isn't that an energy-imbalance is masked at the surface by the oscillation ('hiatus' is a mirage). The objection is to the unsupported claim that the heat transfer down deep is interim or temporary (and it is part of this article). Maybe the words from the recommended thread will register: "The model therefore shows that greater amounts of heat are being sequestered in the deep ocean when global surface temperatures are in hiatus periods." For THC cycles, that's 800 to 1,000 years ... and longer if the only draw out is during the millennial cooling towards the next Ice Age. Again, thx for the time and effort in responding. -
heijdensejan at 19:12 PM on 27 February 20122012 SkS Weekly Digest #8
I am Dutch and my most favorite sites are: climate change: The Next generation Has a very good collection and archive of news Tamino Statistics climate crock of the week Good fun and the videos started my skeptical view to the "skeptic" point of view Jules klimaat blog Unfortunately not active enough but some good refence to the Dutch "sceptics" Barry Bickmore For a different point of view -
adelady at 19:08 PM on 27 February 20122012 SkS Weekly Digest #8
My country of residence is pretty obvious. Same as Doug for Crock of the Week, Real Climate and Climate Progress. then Arctic Sea Ice or The Chatter Box for ice related stuff and Science Daily: Earth & Climate for the occasional surprising item. -
Doug Hutcheson at 18:51 PM on 27 February 20122012 SkS Weekly Digest #8
The ones I regularly visit are: deSmogBlog Climate Denial Crock of the Week Real Climate Climate Progress I'm not claiming they are better or worse than any others, but they are at my (non-scientist) level, in general. -
Rob Painting at 18:50 PM on 27 February 2012The Deep Ocean Warms When Global Surface Temperatures Stall
From Peru - "What changed during the 2000s?" ARGO came along. With its greater precision we now have the capacity to see what is going on in the individual layers. It would take a very detailed re-analysis of the old data, and removal of errors & bias, to ascertain whether this divergence between the 0-700 meter and 0-2000 meter layer in the 'noughties' is in fact a novel feature. -
Rob Painting at 18:44 PM on 27 February 2012The Deep Ocean Warms When Global Surface Temperatures Stall
From Peru - How can a forcing warm the atmosphere and the land, while at the same time producing a much smaller upper ocean warming and then producing significant warming in the deep sea?" That's not correct. The upper ocean, the top 700 meters, has warmed considerably through the noughties, although most likely at a slower rate than the 1990's. A part of the problem is the switch over from the less precise XBT-based system to ARGO. See SkS post: Search For 'Missing Heat' Confirms More Global Warming 'In The Pipeline' and pay particular attention to figure 2: Note how the warming rate abruptly shrinks after 2003, when the more precise ARGO data makes up the majority of ocean temperature measurements. It suggests that a large portion of the apparent slower heating rate isn't actually real, but a consequence of moving from one system to another.
So does that mean there was no slowing of the ocean warming rate? I don't believe so. This is apparent in the thermal component (expansion) of sea level rise. The rate of ocean warming still appears to be lower than the 1990's, but the recent paper Jacob (2012) indicates the melting of land-based ice may be smaller than previously thought, and therefore the estimates of thermal expansion may have to be revised upwards.
Volcanic aerosols (Solomon (2011), and the downward part of the solar cycle would have also contributed to a slower rate of ocean warming through the noughties, and Asian aerosols (pollution particles) may also have played a part. Still awaiting papers to be published on that.
At some point through this ocean warming process we should expect the warming in the subsurface layers to exceed that of the surface layers, because earlier warm periods in Earth's history had surface-to-deep ocean temperature gradients much smaller than today. Of course I'm assuming that such a trend is typical of all warmer periods, it may not be, but so far it seems to be headed in that direction.
Note how the warming rate abruptly shrinks after 2003, when the more precise ARGO data makes up the majority of ocean temperature measurements. It suggests that a large portion of the apparent slower heating rate isn't actually real, but a consequence of moving from one system to another.
So does that mean there was no slowing of the ocean warming rate? I don't believe so. This is apparent in the thermal component (expansion) of sea level rise. The rate of ocean warming still appears to be lower than the 1990's, but the recent paper Jacob (2012) indicates the melting of land-based ice may be smaller than previously thought, and therefore the estimates of thermal expansion may have to be revised upwards.
Volcanic aerosols (Solomon (2011), and the downward part of the solar cycle would have also contributed to a slower rate of ocean warming through the noughties, and Asian aerosols (pollution particles) may also have played a part. Still awaiting papers to be published on that.
At some point through this ocean warming process we should expect the warming in the subsurface layers to exceed that of the surface layers, because earlier warm periods in Earth's history had surface-to-deep ocean temperature gradients much smaller than today. Of course I'm assuming that such a trend is typical of all warmer periods, it may not be, but so far it seems to be headed in that direction.
-
scaddenp at 18:40 PM on 27 February 2012Radiative Balance, Feedback, and Runaway Warming
GC - do any of these theories you mention include predicting the lapse rate (ie these are not variations on Postma's stuff. And also manage to explain the observed DLR somehow does not cause surface temperature to increase? A link to a full, mathematical exposition (preferably published) would be appreciated. -
Jose_X at 18:14 PM on 27 February 2012Radiative Balance, Feedback, and Runaway Warming
Jose_X #36 >Chris #25, I meant Chris #24. Also, thanks for that explanation in #24 since I had seen that equation recently but it had turned me off from reading too much more (of whatever it is I was reading related to feedbacks). -
Monckton Misrepresents Reality (Part 3)
Tom Curtis @2, While I agree with the overall intent of your comment, I believe if there is a clear case of fraud it should be pursued. Bear in mind I do not think there is likely to be enough evidence to convict Monckton. My understanding of the legal requirements is that he would have had to deliberately misled or falsified information with the intention of financial or personal gain. Proving that the deception was deliberate, or that the intent was financial or personal gain, would be hard without some smoking gun. Bear in mind, this is also quite distinct from instances where people are simply (and demonstrably) wrong, even if they argue loudly and repeatedly for those wrong positions. -
Jose_X at 18:07 PM on 27 February 2012Radiative Balance, Feedback, and Runaway Warming
Chris #34, >> But I wouldn't put much meaning into the "average sensitivity" of the planet. .. a lot of people run into mistakes of trying to figure out the sensitivity of a doubling of CO2, from say, how much CO2 contributes to the 33 K greenhouse effect. Exactly. I think this is something that at least some people might not realize. Since I have seen RW's comments on various forums, I not only think this is/was a main issue s/he did not see, but many of the people replying to RW apparently didn't clearly understand this was the problem. The responses did almost inevitably include someone early on pointing out the non-linearity issue, but possibly RW did not realize what that meant and then the conversation moved on to different argumentation. A graph can help people understand that point. Mind you, I haven't seen too many people get hung up on that (certainly not like RW), but the doubt might be lingering without them being able to put it into words. Look at the reaction of sauerj#16 to a related issue.. cleared up by this very nice presentation. Additionally, showing a nonlinear curve that shows H2O effect kicking in gives insight that it's not really CO2 that does the damage. Seeing a graph with the increased (or decreased) slope and a bit of a "knee bend" (when seen from afar.. to see the forest from the trees) helps add urgency and legitimacy to the fears of many climate scientists. >> climate sensitivity is frequently taken as being inversely related to the slope of TOA flux vs. surface temperatures Thanks for the heads up. It still might be interesting to consider the flipped graph since a higher slope is probably more closely associated in the mind with a threat in most uses. A logarithm, for example, is more likely to be seen as "safe" than an exponential curve[*]. This is perhaps another case where those new to the field are likely to misinterpret. Most people's experience (of those who remember) is that we vary the x coordinate to see the effect in the y coordinate. y=f(x). More people might better understand, if you are varying a forcing[**] to then examine the effect on temperature, that you are varying the x coordinate to measure a change in the y. This view is more intuitive probably to most thinking cause-effect relationship. [*] Note, that the main topic being tossed around by laypeople is this "climate sensitivity" value, so it might help to see that relationship directly on a graph as we might be likely to interpret that graph ("cause-effect" <-> "x-y"). [**] "Forcing" is another term that I recently saw clarified that might confuse some people when hearing "CO2 forcing". As concerns the feedback confusion, engineers would likely model CO2 within the system equations. Someone recently wrote somewhere that it's equivalent to knobs being turned in a sound processing unit.. You don't model that as adding a signal strength but rather by varying parameters of the system. Eg, you wouldn't add a force vector but you'd change a viscosity coefficient. Writing an article to explain why 2xCO2 is modeled as a forcing (for sensitivity analysis) could help. >> I think one of the most definitive sources is Roe, 2009. Thanks, I had just downloaded that this week (from a judithcurry link I saved, where she too recommended it). A shorter more accessible description (and on this site) than a 25-page pdf that a friend might point towards might increase the number of people who read that. [I'll go and read it soon I suppose.] >> ice on Earth is only a very small contribution to the planetary albedo I did not realize that. Maybe here too is a lesson of sorts since I probably developed that intuition from comments made by others and from the idea that rays bouncing off the earth makes sense off a white surface. I know that the incident angle plays a much greater role, but I still got the impression ice was significant (although it is at the poles mainly, meaning there is less contribution to average albedo as the incident angle effect already probably dominates). -
CBDunkerson at 17:59 PM on 27 February 20122nd law of thermodynamics contradicts greenhouse theory
YOGI writes: "How come if 239W/m go in and 239W/m go out, that 396W/m exists within the system ? surely that violates the conservation of energy law ?" Really? So, on your world, if the stream feeding into a lake carries 239 m^3/s and the stream flowing out of the lake also carries 239 m^3/s then the lake cannot possibly hold 396 m^3 of water? How very sad for you and your world where clouds do not precipitate out of the atmosphere when the temperature decreases. Here on our Earth planet things work differently. -
Lotharsson at 17:39 PM on 27 February 2012The Latest Denialist Plea for Climate Change Inaction
Speaking of the Angliss-Rutan conversation, reading the full set of comments on the original thread is even more eye-opening. Commenters other than Angliss provide Rutan with a great deal of supplementary information demonstrating that many of his claims are indefensible - and in his responses to them in comments (which are not found in the summary post linked at #52) he ducks, weaves and gallops with the best of them. And speaking of psychological projection - Rutan's schtick is big on AGW communicators engaging in "data presentation fraud" which he argues inappropriately scares the punters - but his own anti-AGW slide deck is so full of it, it's difficult to find one single slide discussing science that presents a fair view of the data. -
Jose_X at 17:08 PM on 27 February 2012Radiative Balance, Feedback, and Runaway Warming
Chris #25, I agree Charlie is correct, but I think you are misunderstanding something. It's not the amplitude of that expression you mentioned that defined pos/neg in the traditional feedback sense since the sign is not changing in that expression (only the magnitude). Net negative feedback from Stefan-B (as Charlie mentioned) means that as we increase temperature we get a counter effect to that raise (a dampening effect.. a "force" that would otherwise make T decrease if it could exist by itself). If we had net positive feedback (in the traditional/engineering sense), on the other hand, we'd get a runaway effect such as one sees when a microphone is brought too close to the speakers.. the signal amplitude blows up very fast (until saturation is hit or some circuit is tripped and shuts it off). Of course, the earth never gets rid of the S-B radiation loss into space, so any "positive feedback" claims would be impossible except within the context of a limited model range (eg, the mic/speaker goes through runaway but only until saturation where the model goes beyond its capabilities... obviously, the mic/speaker runaway doesn't turn into a black hole and suck all the energy from the universe). As stated in Jose_X #30, I do think clarifying well how climate positive feedback is not the same thing at all as traditional (engineering) positive feedback would really get a lot more engineers to pay attention and say "oh, that's what they mean". The climate scientists appear to be in an imaginary world to some engineers first looking at this question of pos vs neg climate feedback. Just like you think Hansen is off, many engineers think all of climate science must likely be off in thinking we are *currently* in a runaway situation that will inevitably consume the entire planet. Perhaps those climate scientists don't even know mathematics. Someone has been conning them to use some computer program and they blissfully live in their own made-up world. [In reality, many engineers probably suspect they are misunderstanding something, but the net result is similar if instead of learning and becoming advocates they lose interest and perhaps afterward sign on to some Internet list of skeptics.] Feedback analysis obviously has limitations. I would not criticize the definitions used in climate science since those appear to be useful definitions for the context, but, I think this change in definitions should be made more clear to an audience composed of technically savvy people. I would consider adding in an "argument" on the website that addresses this feedback issue, even if the audience would be limited. The educated engineer/scientist(?) is an influential audience and can be quiet a thorn or otherwise a useful ally. -
Rob Honeycutt at 16:52 PM on 27 February 20122nd law of thermodynamics contradicts greenhouse theory
YOGI... Look, people are not trying to pile on, even though it may seem like it. What is frustrating is that you're clearly confusing your lack of knowledge on this subject with there being something wrong with greenhouse theory. It's a very complex subject. But rather than assuming that 150 years of research has somehow produced an error that has somehow slipped past 10's if not 100's of thousands of scientists, how about just acknowledging that maybe you need to be better trained to even begin to understand this subject. It's great that you are trying to propose questions but the ones you're asking are really pretty easily answered if you take some time to better understand the subject matter. -
Dave123 at 16:44 PM on 27 February 2012Climate change models underestimate future temperature variability; food security at risk
Apropos these comments about England (expect to be there in 2 weeks), I think you can add this fellow to climate skeptics who make predictions: Doug Proctor Did a drive-by over on real climate. -
Chris Colose at 16:35 PM on 27 February 2012Radiative Balance, Feedback, and Runaway Warming
gallopingcamel, These exchanges really take away from interesting science, and your claims have absolutely no merit. I'd ask that you read an intro radiation textbook (see Grant Petty for a good undergrad level text that is still quantitative and sophisticated enough for solid understanding). -
Chris Colose at 16:33 PM on 27 February 2012Radiative Balance, Feedback, and Runaway Warming
Jose X, thanks for your comments. Your understanding is rather good for being new, but just to reply to a few issues: 1) It's certainly true that climate sensitivity is a function of the equilibrium climate, and to what extent it can be linearized for small changes is still up for some debate. This is one of the issues with using paleoclimate data from the Last Glacial Maximum and applying it to the future. But I wouldn't put much meaning into the "average sensitivity" of the planet. Radiative transfer is a rather non-linear subject, and a lot of people run into mistakes of trying to figure out the sensitivity of a doubling of CO2, from say, how much CO2 contributes to the 33 K greenhouse effect. By the way, I guess I should have specified, but the outgoing radiation in these plots is all from TOA, not surface. Also, climate sensitivity is frequently taken as being inversely related to the slope of TOA flux vs. surface temperatures (e.g., see this graphic) 2) Your point about varying definitions of 'feedback' are well taken. Lindzen does describe the theory of some of this well in several of his papers, but I think one of the most definitive sources is Roe, 2009. 3) Your point 3 is off-target because ice on Earth is only a very small contribution to the planetary albedo (which is dominated by clouds, whose distribution is governed largely by the large-scale dynamics). Ice albedo is important as a local feedback, and there would be a lot of climate consequences to melting the ice (sea level, altering the atmospheric circulation, etc) but it wouldn't have the type of impact on albedo that you're talking about. -
actually thoughtful at 16:22 PM on 27 February 2012The Deep Ocean Warms When Global Surface Temperatures Stall
Actually, from a solar plumbers perspective, convection is harder to swallow than conduction or turbulence. I make my living on water stratification - hot water is more buoyant than cold, thus water heater can deliver almost the entire contents of the tank (cylinder) as the cold water is added at the bottom. We use variations of this trick endlessly to maximize the output of solar thermal systems. However, my earliest design required multiple storage tanks, but only one tank that was exchanging heat with the loads. So I circulated the water, thus moving the heat energy (I think of it as a conveyor belt). And that is the model that I think is more helpful to understand how the heat "bypasses" the upper ocean. It doesn't really, it is an artifact of an incomplete measurement system (ie not enough sensors) and the fact that the heat energy is only sinking in certain areas (and lots of heat is going down in those areas). Conduction and convection (ie a warmer liquid rising and a colder liquid falling due to density), in the absence of turbulent system, don't move heat down in water. But ocean currents that are sinking can carry hot water down with them - and that is the mechanism that explains both how heat gets to the lower ocean at all, and why it isn't uniform (and thus appears to bypass the upper ocean). I should point out I don't have any papers to back up this view - just my livelihood. -
Radiative Balance, Feedback, and Runaway Warming
gallopingcamel - I have two issues with your last post: (1) No links. No references. (2) No assertions or evidence from those authors to be considered. What is it that you are asking? -
Jose_X at 16:14 PM on 27 February 2012Radiative Balance, Feedback, and Runaway Warming
> It's not clear to many that H2O is a dominant effect that has only kicked in aggressively for temperatures in the vicinity of where we are (eg, say within the last 10 K, I'd guess) First of all, I am not clear on this since I have not thought about it for too long and haven't come across the statement above. Second, would I be guessing well by saying that, instead of "10K" (a mistake), 20-30K lower in global average temp would result in non-dominating ghg effect contributions from H2O and the correspondingly lower climate sensitivity, as judging by this graph http://upload.wikimedia.org/wikipedia/commons/4/41/Relative_Humidity.png and considering that H2O is about 70% of the ghg effect today with CO2 making up the majority of the rest? -
gallopingcamel at 16:09 PM on 27 February 2012Radiative Balance, Feedback, and Runaway Warming
Chris, [snipped] Your participation in discussions relating to radiative processes at the "Science of Doom" was stimulating even though we seldom agreed. Here is a question for you. I am a physicist. Other physicists such as Nikolov and Zeller and Robert G. Brown can explain planetary surface temperatures based on TSI, Stephan-Boltzman, albedos and the gas laws. So why do you think that Radiative Transfer Equations (RTEs) have any significant influence? -
Jose_X at 16:03 PM on 27 February 2012Radiative Balance, Feedback, and Runaway Warming
Point 1: I agree with sauerj#16 that more can be done to extend this article, eg, by looking at how H2O affects climate sensitivity all else remaining equal. It's not clear to many that H2O is a dominant effect that has only kicked in aggressively for temperatures in the vicinity of where we are (eg, say within the last 10 K, I'd guess). Of the 33 ghg warming, a major contributions is only "now" being added, because of H2O. In other words, the *average* sensitivity of the planet (eg, starting from no sun or from 1.0 albedo) is much lower than the current sensitivity. We note this by looking at instantaneous tangent line slope (derivative) vs the secant that represents the average slope between our current point and the origin. I started writing up something very similar (but instead TOA flux vs surface flux), as I think showing that graph would help commentator "RW" clear remaining doubts. Ie, it would explain what sensitivity is and how it grows much faster as H2O vapor grows appreciably for a given level of CO2; all other ghg gases remaining constant, add heat from the sun has a much more powerful effect once H2O kicks in past the level needed to match the other ghg effects (earth generally has existed in that range thanks to its distance from the sun, etc). Also, I would place temp on the y axis in order to make it easier for those with modest mathematical bent to follow. You want agreement with the climate sensitivity definition if possible. Greater climate sensitivity should be seen as greater slope on the curve (in the traditional mathematical sense of y_delta/x_delta) and not a smaller/flatter slope. The sensitivity question is a very important one and should be highlighted well.. Point 2: However, I would consider an article view (or related article) to appeal to engineers [can skepticalscience add an "engineer view" for select articles.. beyond the easy, intermediate, advanced views?]. I would clarify that "positive feedback", as it is used in system's analysis and various engineering disciplines, has a different definition than climate positive feedback. This article covered the essence of this point (runaway vs not runaway), of course, but more can be said explicitly to place it in the context of traditional "positive feedback". I have noted that many engineers are skeptic, and I can relate to this particular misunderstanding. So, what describes the earth system is "negative feedback" (in the engineering sense) with a small amplitude component that likely is positive but some skeptic scientists claim could be negative due to clouds. Climate scientists don't expect that positive component to be larger in magnitude than the base negative feedback (at least not any time soon and/or within the confines of existing parameters). The key point is that any net (engineering) "positive feedback" leads to runaway behavior, by the definition used by many engineers, and we want to clarify this issue. It should be clarified that climate scientists call positive feedback simply a less negative feedback. Also, the climate models aren't feedback models, so this distinction is not important for generating future projections. In other words, the scientists' "mislabeling" is inconsequential to the calculations they perform. The "negative feedback" (engineering definition) of climate models is implicit (as mentioned in this article) from the obvious cooling effect of the 0 Kelvin outer space boundary condition and how that is incorporated into the calculations. I will look more carefully at Lindzen's "tropics" feedback analysis (maybe others have already) to see if this issue crops up. It probably isn't an issue, but I am curious. Point 3: I suspect that the albedo might change significantly if ice cover starts to disappear in very large amounts. I might not be thinking clearly, but a change in albedo of say 20% (eg, .06) would be more than merely Apocalyptic when we consider how little the earth's effective emissivity to shortwave changes with a few degrees C change at the surface (right?). Isn't most natural variability equivalent to say +/- .5 C, and isn't this change associated with a tiny percentage change in solar irradiance? Now imagine an increase of 20% incident solar flux rather than a fraction of 1%. [Am I missing something?] [BTW, I am fairly new to this and have lots to learn so I might have misjudged various issues here.] -
Scafetta's Widget Problems
andylee - "I would tackle it from a signal processing and noise reduction point of view - start by subtracting the effect of everything we know from the climate record - volcanic eruptions, ENSO, CO2 signatures etc, and see what is left over." And that's exactly what Foster and Rahmstorf 2011 did for the last 30 years, and what Lean and Rind 2008 did for the last 120 years. Turns out that there really isn't anything left after you account for solar, volcanic, ENSO, and anthropogenic forcings. No mysterious unknown cycles (MUC's), no 'recovery from the LIA', no cosmic ray influence, or distant supernovae, or orbital resonance from Jupiter/Saturn - it's actually just what we expect from the physics. Oh, and our own actions... -
andylee at 15:44 PM on 27 February 2012Scafetta's Widget Problems
I then read the paper... He's obviously spent a lot of time and intellectual energy on this, so I don't dismiss it out of hand. (I take issue with the use of the word "astronomical" - apart from our sun, the nearest star is 4.25 ly away.) He has a point and I don't doubt that planetary influences add some multidecadal red noise to climatic data, but his objective appears to start already from a denialist perspective by distancing himself from AGW advocates: "To understand the reasoning a good start is the IPCC’s figures 9.5a and 9.5b which are particularly popular among the anthropogenic global warming (AGW) advocates" The sun isn't stationary, it is wobbling around a barycentre following a complicated path with approximately a 0.01AU deviation. Consequently the Earth's orbit is not perfectly elliptical and its distance from the Sun also has an n-order Lissajous component. Instead of looking for cycles to fit and then attempting to match them to the climate record to try to mask recent warming, I would tackle it from a signal processing and noise reduction point of view - start by subtracting the effect of everything we know from the climate record - volcanic eruptions, ENSO, CO2 signatures etc, and see what is left over. Then, calculate the waveform of the *distance* of the Earth from the Sun modulated by the sunspot cycle to calculate the irradiance. This is the only method that the planets can affect our climate, short of a collision or extended eclipse. At this point a Fourier transform of both climatic history and derived planetary-influenced irradiance should reveal some common frequencies. Applying the irradiance function to the climate record should automatically damp the signal in the right places, subject to some phase shifting to identify possible latencies in climate response. Anything left over is attributable to something else. Lastly, my favourite sentence: How easy it would be to quantify the anthropogenic effect on climate if we could simply observe the climate on another planet identical to the Earth in everything but humans! But we do not have this luxury. ... ... yet! :-) -
adelady at 15:16 PM on 27 February 2012The Deep Ocean Warms When Global Surface Temperatures Stall
What changed during the 2000s? Little to nothing. It's barely ten years. You need at least another 7-10 years of the same before you could even _begin_ to detect anything different going on.
Prev 1250 1251 1252 1253 1254 1255 1256 1257 1258 1259 1260 1261 1262 1263 1264 1265 Next


