Climate Science Glossary

Term Lookup

Enter a term in the search box to find its definition.

Settings

Use the controls in the far right panel to increase or decrease the number of terms automatically displayed (or to completely turn that feature off).

Term Lookup

Settings


All IPCC definitions taken from Climate Change 2007: The Physical Science Basis. Working Group I Contribution to the Fourth Assessment Report of the Intergovernmental Panel on Climate Change, Annex I, Glossary, pp. 941-954. Cambridge University Press.

Home Arguments Software Resources Comments The Consensus Project Translations About Support

Bluesky Facebook LinkedIn Mastodon MeWe

Twitter YouTube RSS Posts RSS Comments Email Subscribe


Climate's changed before
It's the sun
It's not bad
There is no consensus
It's cooling
Models are unreliable
Temp record is unreliable
Animals and plants can adapt
It hasn't warmed since 1998
Antarctica is gaining ice
View All Arguments...


Username
Password
New? Register here
Forgot your password?

Latest Posts

Archives

The Year After McLean - A Review of 2011 Global Temperatures

Posted on 11 February 2012 by dana1981

In The Day After McLean we examined a prediction by data analyst and member of the Australian Climate Science Coalition John McLean regarding the 2011 global average surface temperature:

"it is likely that 2011 will be the coolest year since 1956 or even earlier"

The title of the post was a reference to the film The Day After Tomorrow (which depicts extremely rapid global cooling) because of the rapid cooling which would have to occur for McLean's prediction to come to fruition, as illustrated in Figure 1.

McLean failure

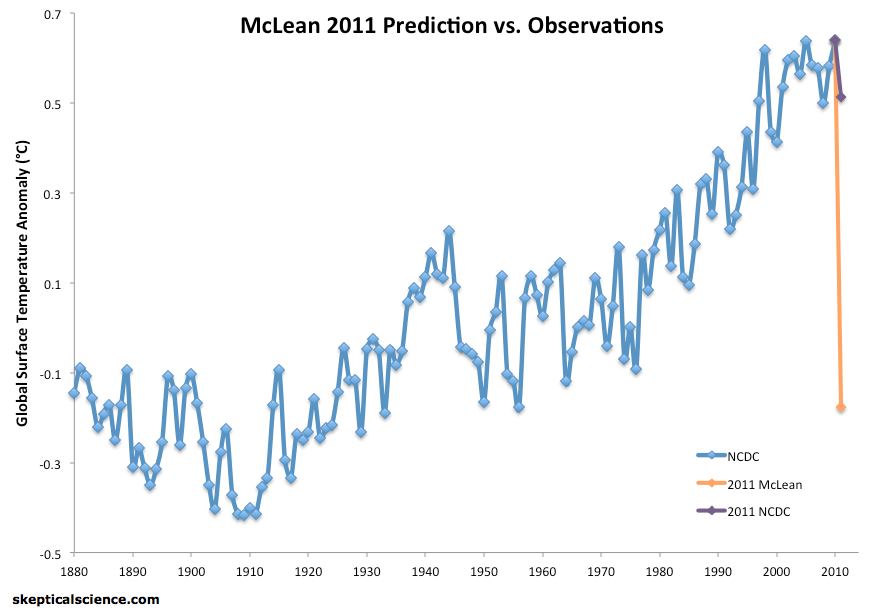
Figure 1: NCDC global average surface temperature from 1880 through 2010 (blue), McLean's 2011 prediction (orange), and the actual 2011 NCDC temperature (purple).

Even without knowing the actual 2011 temperature, the sheer magnitude of the temperature drop predicted by McLean, unrivaled in modern history, makes one wonder: what was he thinking?

La Niña

The basis of McLean's prediction was a paper we have previously examined, McLean et. al (2009).  In their paper, McLean et al. found that the El Niño Southern Oscillation (ENSO) has a large influence on global temperature variability (i.e. short-term changes), but they also slipped a conclusion into their paper which was not supported by their research:

"Overall the results suggest that the Southern Oscillation exercises a consistently dominant influence on mean global temperature"

This claim is simply incorrect, and could not be supported by their research, because the first step in the McLean et al. analysis removed any long-term trends from the original temperature data.  Thus their analysis was incapable of determining the dominant influences on long-term temperature changes.

However, 2011 was indeed influenced by a strong La Niña event.  According to Foster and Rahmstorf (2011), there is a 2 to 4 month lag before changes in the Multivariate ENSO Index (MEI) are reflected in global surface temperatures.  According to the MEI data, when applying a 3-month lag, 2011 was impacted by the 5th-largest La Niña influence of any given year since 1950, and the largest since 1974. 

Thus McLean was correct to predict that La Niña would have a significant cooling effect, but he overestimated the strength of that cooling effect by an order of magnitude. 

Short-Term Natural Temperature Influences

Using the results of the Foster and Rahmstorf (2011) multiple linear regression approach, ENSO had a cooling effect of approximately 0.08°C on the 2011 global surface temperature.  However, the difference between the 2010 and 1956 temperatures (McLean's 2011 cooling prediction) was 0.8°C - McLean predicted that La Niña would have a cooling effect approximately 10 times larger than it actually did.  Moreover, ENSO has not caused more than a 0.2°C year-to-year temperature swing since 1950, and the largest single year-to-year temperature swing in the NCDC record is 0.26°C (1963 to 1964, which was influenced by the Mt. Agung volcanic eruption).

Tamino has provided an update to Foster and Rahmstorf to include the 2011 data.  When the effects of ENSO and solar and volcanic activity are removed from the temperature data, 2011 is either the 2nd- or 5th-hottest year on record, depending on which data set we choose (Figure 2).

2011 FR11

Figure 2: Annual averages of the adjusted data from Foster and Rahmstorf (2011) with the effects of ENSO and solar and volcanic activity removed.

Refusing to Admit Mistakes

McLean has followed the example of fellow fake skeptic Patrick Michaels, who we recently saw has been unwilling to admit his obvious and indisputable errors in distorting the research of James Hansen and colleagues.  In this case, there is no question that McLean's prediction was an exceptionally poor one.  Any reasonably intelligent person would come to the same conclusion simply through a cursory examination of Figure 1 above.

And yet in 9 Months After McLean, we saw that McLean continued to stand behind his initial prediction halfway through 2011:

"Last time I looked 2011 wasn't over yet. It's a bit premature of you to be crowing about an annual average when the year isn't complete."

I have recently been in contact with McLean, who has promised to write a post about his prediction and results, which he claimed might somehow surprise me, but as of yet he has not produced the promised blog post

Although Foster et. al (2010) showed that McLean et al. (2009) could not draw any conclusions about long-term temperature changes or influences, and although the invalid conclusion of the paper has clearly caused McLean to make a very wrong temperature prediction, he still refuses to admit his errors.

2011 - Another Hot Year

Regardless, 2011 predictably turned out to be another hot year.  Taking the average of the NOAA NCDC, NASA GISS, and HadCRUT3 surface temperature records, 2011 was the 10th-hottest year on record.  When the effects of ENSO and solar and volcanic activity are removed, Foster and Rahmstorf find it to be in the top 5 hottest years on record.  Moreover, as the World Meteorological Association found, 2011 was the hottest La Niña year on record despite having the 5th-strongest La Niña influence since 1950, and the strongest since 1974 (Figure 3).  This is a clear indication that human-caused global warming continues its inexorable rise underneath the short-term effects of natural variability.

temps

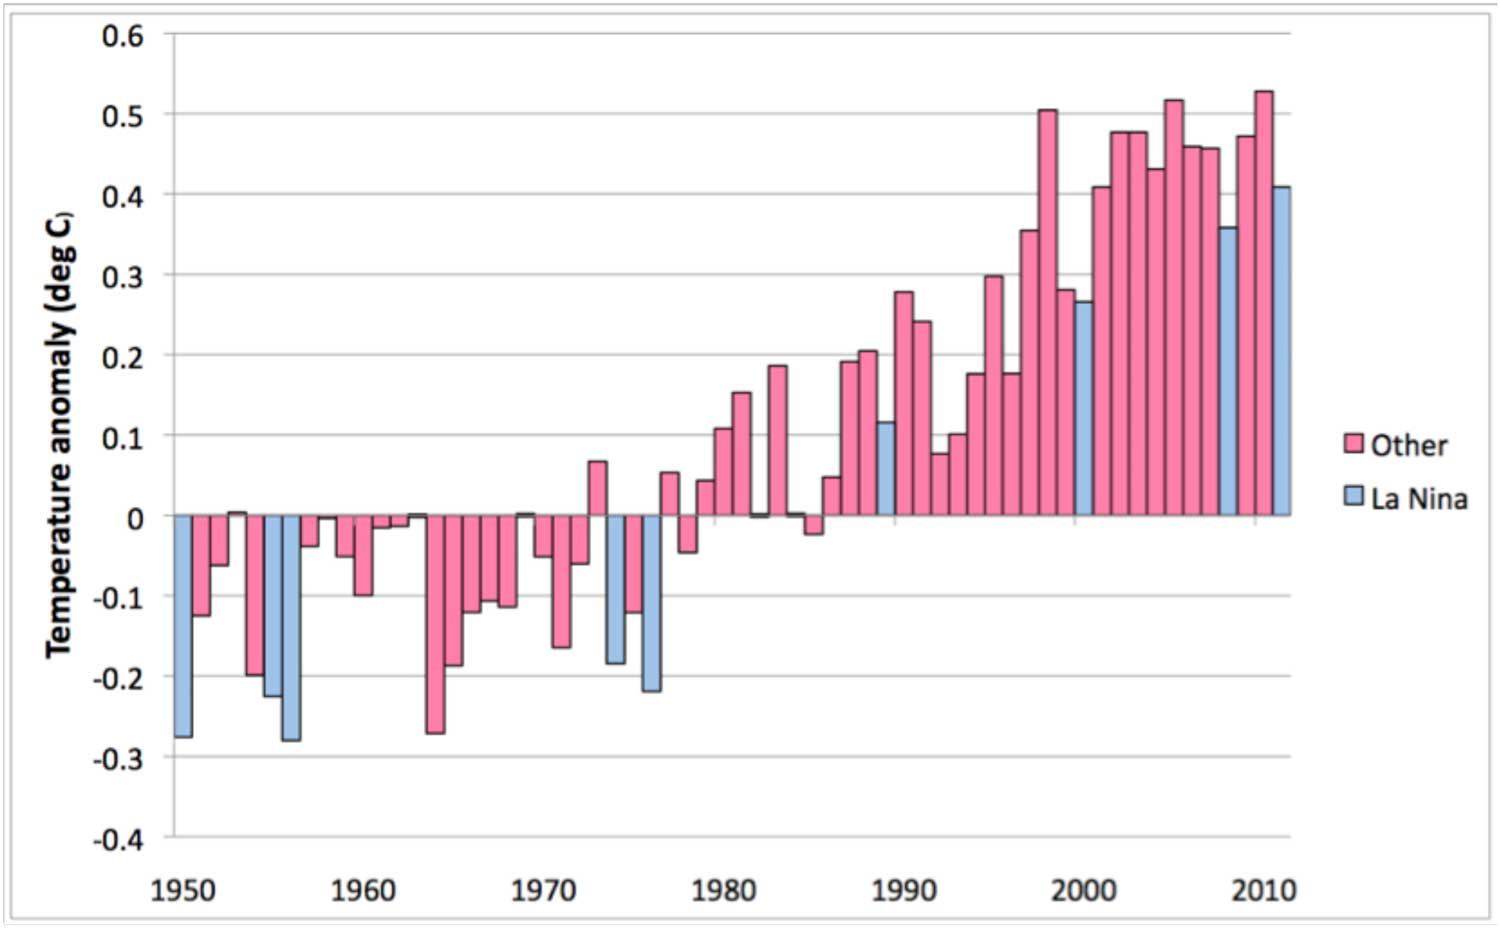
Figure 3: Average of NOAA, GISS, and HadCRUT3 annual global surface temperature anomalies.  Blue bars indicate years influenced by La Niña events.  2011 is the warmest La Niña-influenced year on record (Source: WMO)

0 0

Printable Version  |  Link to this page

Comments

1  2  Next

Comments 1 to 50 out of 76:

  1. McLean should be praised for having made a testable prediction, that at least is good science (Popper would have approved) even if the basis for the prediction wasn't.
    0 0
  2. Under "Short-Term Natural Temperature Influences", "aggression" should be replaced by "regression".
    0 0
    Moderator Response: [DB] fixed, thanks!
  3. McLean's methodology would satisfy Popper's criterion not just if he can derive testable predictions from it but also if he shows some proclivity, after some prediction was falsified, to discard the theory that his methodology rested upon. (One big weakness of Popper's framework, though, is that it's often unclear in particular cases if it might not be reasonable to cling to a theory that has yielded false predictions and rather revise some auxiliary hypothesis. This is a common occurrence in the history of science. But in the present case, it isn't obvious what mere auxiliary hypothesis could have thrown McLean off. It would be interesting to hear his explanation.)
    0 0
  4. Yes, making a testable prediction is laudable. However, continuing to stand behind that prediction when it is clearly wrong, not so much.
    0 0
  5. Add a skin to the trophy wall alongside Ricky Lintzen's 2004 NY Times statement that global warming stopped in 1998. For an encore, check Tony T. Watt's claim (somewhere around January 25th, 2011) that with Cycle 25 showing up as a whimper instead of a bang, 2022 would mark "The end of the Modern Warm Period." The tenants of Hothouse Earth are spending too much time distracted with how big the 'future fire' will or won't be.
    0 0
  6. Dana, In fairness, we don't yet know whether McLean is still standing by his prediction or not. He says that his response will surprise us, so perhaps he will surprise us by admitting that he was wrong.
    0 0
  7. Not likely keith :-) It was also clear in July that his prediction was wrong, and yet he stood behind it at that point as well.
    0 0
  8. Pierre-Normand & dana1981, I completely agree, however if the skeptic scientists made testable projections more often, we would resolve many of the points of discussion much more quickly (whether they stood by them or not)!
    0 0
  9. How come it did not turn out to be right? It seemed so plausible...
    0 0
  10. dana1981 "Foster and Rahmstorf find it (2011) to be in the top 5 hottest years on record." Well of course it should be. When you are on a plateau, the height sort of 'plateaus'. Fig 3 shows that nothing much has happened since 1998 vis-a-vis surface temperature rise. " Tamino has provided an update to Foster and Rahmstorf to include the 2011 data. When the effects of ENSO and solar and volcanic activity are removed from the temperature data, 2011 is either the 2nd- or 5th-hottest year on record, depending on which data set we choose (Figure 2)." Why not remove the effects of solar and volcanoes from all temperature reconstructions back to the start of the Holocene? We might then find a more significant warming trend - but not the actual temperatures - and what would that prove. And ENSO effects are supposed to be internal to the system and not relevant to underlying trends. Why then 'remove' ENSO effects? Using Tamino's adjustments looks like a try hard to get a warming trend over the last 10-12 years by removing ENSO at least, and solar which is usually reported as small (isn't the solar 11 year cycle usually only about +/-0.13W/sq.m) against a purported warming imbalance of 0.9W/sq.m.
    0 0
  11. Ken Lambert, do you have statistically significant evidence that there has been a plateau (i.e. the apparent levelling off of temperatures is not likely to be merely an artifact of the noise)? How many times does it need to be said that temperature trends over roughly decadal timespans are not a reliable indication of what the climate system is actually doing.
    0 0
  12. Well of course it should be. When you are on a plateau, the height sort of 'plateaus'.
    Oh please, not this rusty old saw again. Ken Lambert, paraphrasing a question I repeatedly put to Girma Orssengo on the Matthew England thread at Deltoid, can you tell us what period of time is required to discern from the short-term noise in the global surface temperature record, a warming signal of, say, 1.0 C/century? What period of time would be required to discern a signal of 0.75 C/century, and what period of time would be required to discern a signal of, say, 1.25 C/century? Conversly, and importantly in the context of your fixation with periods of approximately a decade, what rate of temperature change would be required to discern a signal from noise over a period of ten years? What rate of temperature change would be required to discern a signal from noise over a period of five years, and what rate of temperature change would be required to discern a signal from noise over a period of fifteen years? Once you have derived the answers, can you comment on what their magnitudes imply for anyone who claims that there has been no warming for x-years, or that there has been cooling for y years, where x and y are values less than several decades?
    0 0
  13. Oops. I should have refreshed and found Dikran Marsupial's much more succinct response to Ken Lambert, before spraying 20 questions over the board.
    0 0
  14. 10, Ken Lambert, "...looks like..."? What's that supposed to mean? More specifically, what specific arguments do you have to make against the validity of Foster and Rahmstorf (2011)? No "looks like." The world doesn't want your off-the-cuff, rule-of-thumb, eyecrometer opinion of what it "looks like." Be specific. What is wrong with the methodology in Foster and Rahmstorf that would cause you to dismiss their result?
    0 0
  15. 'Skeptics' like Ken can't possibly argue that McLean's prediction was anything short of ridiculous... so instead he trots out nonsensical long disproven arguments about 'plateaus' and 'no warming since 1998' to derail the discussion. McLean was blatantly wrong. Just as every other 'skeptic' who has dared make a prediction has been. There is no way to argue with those facts... and no reason to respond to people attempting to distract from those facts with nonsense. If 'skeptics' cannot admit error even when their 'side' is shockingly ridiculously wrong (as in this case) there really is no point in discussing anything they have to say... they've demonstrated that they will do anything to avoid facing reality.
    0 0
  16. Ken @10 "And ENSO effects are supposed to be internal to the system and not relevant to underlying trends. Why then 'remove' ENSO effects?" So you can remove the noise and better see the underlying trend. Why is that difficult to understand?
    0 0
  17. Ken - as CBD notes, this post is about McLean's failed prediction. If you want to argue about Foster and Rahmstorf, there is a comment thread on that post. If you want to make the 'warming stopped in [insert year]' myth, please take your comments to that post.
    0 0
  18. Further to Robert Murphy's response at #16 (and on topic this time) the ENSO acts to relocate heat around the planet; it does not generate net heat. As Robert notes, removing the confounding influence of this oscillating phenomenon does not affect detection ofunderlying warming trends.
    0 0
  19. "Well of course it should be. When you are on a plateau, the height sort of 'plateaus'." There is, of course, another way of looking at this, in a situation with a trend and variation, the most likely place to have a new high, is following a new high. Random means up and up is as likely as up and down.
    0 0
  20. Bernard J @ 12 I am frustrated by my lack of the maths knowledge to answer your questions, but they seem to me to be interesting.
    can you tell us what period of time is required to discern from the short-term noise in the global surface temperature record, a warming signal of, say, 1.0 C/century? What period of time would be required to discern a signal of 0.75 C/century, and what period of time would be required to discern a signal of, say, 1.25 C/century? Conversly, and importantly in the context of your fixation with periods of approximately a decade, what rate of temperature change would be required to discern a signal from noise over a period of ten years? What rate of temperature change would be required to discern a signal from noise over a period of five years, and what rate of temperature change would be required to discern a signal from noise over a period of fifteen years?
    I imagine the answers would involve quantifying the average magnitude of the observed noise over the periods in question and then establishing the magnitude of signal required to skew the slope of the total data (noise + signal) by a statistically significant amount. It is so frustrating to be able to frame such problems, but not have the education to address them. If only I could go back to about year 10 at school and have teachers who could inspire me with the enthusiasm for math and physics that I have now, in later life. As it is, I have to rely on other minds to spoon feed me. So much to learn, so little time. To put me out of my misery, are those questions valid and are there answers to them? (And where can I go on the web to study high-school math and physics at my own pace ... I wish.)
    0 0
  21. Doug H - You might then be interested in the Separating signal and noise in climate warming thread. The answer appears to be a minimum of 17 years for any trend to be statistically identified in the presence of observed climate noise. Others (ahem) might want to read that as well. Decadal trends are just not enough to identify any trend, whether it's plus, minus, or flat.
    0 0
  22. Doug H. There are simple ways and there are more complicated ways to derive answers to those questions. KR has already directed you to Santer's et al work, and Foster and Rahmstorf consider the problem too. There's an abridged version of the latter at Open Mind, but remember that this analysis removed the influence of exogenous factors such as ENSO, where Santer et al didn't. Thus, Santer's minimum-required time period for statistical significance is a little longer.
    0 0
  23. And Doug H, I feel your pain. Often even the simplest answers appear to be so only in hindsight, and the answers to those questions above don't immediately jump out for many people - sometimes even for people are supposed to understand statistics! Of course, the whole underlying issue completely sails over the heads of the Denialati, no matter how many times it's explained to them - and it's been explained to them repeatedly. When Bolt commented on the Santer et al paper he thought that it meant that because it required 17 years of data to detect statistically significant warming rather than 10 years (according to the paper of Santer et al), it meant that scientists wouldn't know until 2018 (2011 + 7 more years) if the planet was warming. That's either very stupid mind, or a very ignorant mind, or a very mendacious one - or some permutation of any or all of the preceding. And Girma Orssengo certainly didn't ever figure it out - if you read the Matthew England thread you'll see that his answer, when it eventually came, is completely and utterly clueless.
    0 0
  24. KR and Bernard J, thank you both for your contributions. I revisited the 'Separating Signal and Noise' page KR linked and appreciate the information (and the comments afterward). My difficulty is that I don't have the math to follow the arguments very far. It is frustrating to be intensely interested in the topic and be unable to dig deeper into it. I judge the expert advice on this site to be sound, but that is not the same as being able to work it out for myself. Can I have my life all over again please? I promise to try harder next time ...
    0 0
  25. Minor note: If Santer at al. investigate the amount of data needed to detect a trend of 2 degrees per century and get 17 years, if the trend is less than that then a longer timescale will be needed to reliably detect it.
    0 0
  26. Doug H @ 20 and 24 Try Khan Academy . I suggest you google - Ted khan academy for a 20 minute video to get an understanding of the site before you try it. This should (may) be able to get you where you want to go. Also, there was a thread a few months back with suggestions, is that still available? Having a place to discuss and share info that is not directly related to a specific topic may help general readers to discuss and understand without throwing topics off. We are in the same boat Doug H, I trust sks but want to better understand the details.
    0 0
  27. Doug H: For a purely visual guide to separating noise from signal, refer to the video on the Trend and Variation thread.
    0 0
  28. Excellent illustration of the overall warming trend after teasing out natural variation due to ENSO, volcanoes and solar activity. Does anyone know what are the remaining major variables? I note there is a particularly large dip around 1983. What other variation could that be due to? Has anyone analysed the correlation between economic output and CO2 emissions, and any consequent variation in net warming? I wonder if it might not be possible to map recessions (tied to lower energy use) to lower warming, thereby identifying delays in the system. From wikipedia: The IMF estimates that global recessions seem to occur over a cycle lasting between 8 and 10 years. During what the IMF terms the past three global recessions of the last three decades, globaly per capita output growth was zero or negative. It would be interesting if there was a (delayed) statistically significant correlation between global recessions and the remaining variability above.
    0 0
  29. "Does anyone know what are the remaining major variables? I note there is a particularly large dip around 1983." El Chichon, Mexico, erupted in 1982.
    0 0
  30. Robert> That was my first reaction when I was skimming the article. But then I noted the key concept for the adjusted data was: "When the effects of ENSO and solar and volcanic activity are removed from the temperature data". Just wondering what is left after those three variables have been adjusted for. I thought that as the remaining forcing seems to be predominantly due to AGW there may be an economic footprint in there.
    0 0
  31. 30, Luke, The statistical methods used are far from perfect. They attempt to resolve the influence of the various factors, but can't do so perfectly, especially if the actual influence (or in some cases confluence) is not linear. So I think a lot of the variation you still see in the adjusted graph is simply unaccounted residue from volcanic (1983) and ENSO (1998, 2007) events. In a nut shell, there's still more natural variation within the natural variation.
    0 0
  32. Luke wrote: "I wonder if it might not be possible to map recessions (tied to lower energy use) to lower warming, thereby identifying delays in the system." Very unlikely. We can detect the impact of economic activity on GHG emissions, but the variations there are just too small to then in turn pick out their impact on temperatures. Keep in mind that it is the accumulated total GHGs in the atmosphere which determine warming. When a recession comes along we might see the rate of atmospheric CO2 accumulation drop from ~2.1 ppm per year to ~1.9 ppm per year... so even if the recession lasted five years we are only talking about around 1 ppm difference in atmospheric CO2 levels. Compared to the ~115 ppm total accumulated increase over pre-industrial levels that difference is going to get lost in the rounding. Thus, unless our ability to model the atmosphere becomes vastly better than it currently is (to the point that every storm can be precisely predicted weeks in advance) or we see a massive economic collapse, there is no way that we will be able to pick the 'decreased warming signal' of an economic downturn out of the uncertainty range.
    0 0
  33. muoncounter @ 27 Thanks for the link to the video. I enjoyed the simple demonstration when it was first posted at SkS and use it as an example when talking to people. Cute doggy. KBow @ 26 Thanks for the link to the Khan Academy. I am excited by the prospect of breaking through the education barrier and that site looks very promising. I have the home page open as I write and many topics are jumping out at me to be studied. Looks like a great resource and it is now in my Favourites. "8-)
    0 0
  34. Sphaerica #31 What about taking out Jim Hansen's Asian aerosols, and his 'delayed Pinitubo rebound effect' which are supposed to also be masking the CO2GHG warming effect? Problem is that for other experts such as Dr Trenberth - neither exist!
    0 0
  35. Ken, Sphaerica's whole point was that these 'deductive analyses' of temperature trends still contain some variability because there are some factors which we don't have nailed down accurately enough to 'subtract out'. He focused on the remaining natural variations while one of those you cite is anthropogenic, but the issue is the same... until we can nail down the influence of these remaining (comparatively minor) factors to a narrow uncertainty range we can't separate them out. BTW, I doubt either Trenberth or Hansen would argue that the factors cited by the other 'do not exist' as you claim... the uncertainty is over how much impact each has. If you believe otherwise you are free to provide the quotation of Trenberth saying that there are no Asian aerosols rather than falsely describing his position.
    0 0
  36. CBD #35 Forgive my shorthand. Would 'Jim Hansen's Asian aerosols *effect*' as with his 'delayed Pinitubo rebound effect' explain it better? Dr Trenberth has commented that the Asian aerosols *effect* is insignificant in explaining the stasis in surface temperatures and the discrepancy in warming imbalance. There is such a quotation on this site which I have had no time to find - might be in the 'Trenberth on tracking Earth's energ...' or similar thread. As for the Pinitubo rebound effect - that is a Hansen special (maybe an idea of his brainy grandchild) upon which no one will comment fearing it will diminish Hansen's credibility.
    0 0
  37. Ken #34: "Problem is that for other experts such as Dr Trenberth - neither exist!" Ken #36: "Dr Trenberth has commented that the Asian aerosols *effect* is insignificant" Do I need to explain the difference between insignificant (which may also be an exaggeration Trenberth's position) and non existant?
    0 0
  38. 36, Lambert,
    ...upon which no one will comment fearing it will diminish Hansen's credibility.
    What is this supposed to mean? Do you hear black helicopters overhead whenever you think it? Read the comments policy, and obey it.
    0 0
  39. CBD #37 Well yes you do. Clearly I accept your rebuke for having neglected to include the word 'effect' after 'Asian aerosols', as I did when listing the 'delayed Pinitubo rebound effect'. Asian aerosols exist just like Australian aerosols exist and USA aerosols exist - it is the particular effects of same which are in question. I did exaggerate slightly when I said that 'neither exist'. I should have said that the Trenberth opinion was that 'the particular effect of Asian aerosols' was not a cause of the lack of warming imbalance, and that the 'delayed Pinitubo rebound effect' was so bizzare that no other scientist to my knowledge has ever treated it seriously with a comment. For them it does not exist - for Jim Hansen it does.
    0 0
  40. Ken wrote: "I should have said..." You should have said what Trenberth actually said. Then we wouldn't have all this ridiculous back and forth over how best to interpret your misrepresentations of his position.
    0 0
  41. CBD #40 I did find the actual Trenberth quotation on SKS: Quote: "There is discussion in the comments of the supposed finding that increasing aerosol (pollution) from China may be the explanation for the stasis in surface temperatures and I do not believe this for a moment. Similarly, Jim Hansen has discussed the role of aerosol as a source of discrepancy. However, the radiation measurements at the top of the atmosphere from satellites (CERES) include all of the aerosol effects, and so they are not extra. They may well be an important ingredient regionally, and I have no doubt they are, but globally they are not the explanation." endquote One might disagree with Dr Trenberth's analysis however he plainly says that: "increasing aerosol (pollution) from China may be the explanation for the stasis in surface temperatures and I do not believe this for a moment". And futher: "They (Chinese aerosols) may well be an important ingredient regionally, and I have no doubt they are, but globally they are not the explanation." We are talking about global warming and global temperatures here - not regional variations. So though my language was imperfect - my meaning did not misrepresent Dr Trenberth's position on the global effects of Asian (Chinese) aerosols.
    0 0
  42. Sphaerica #38 I can't imagine what the 'black helicopters' remark means, however I am mindful of the comments policy. I don't mind being called by my first name either - or an abbreviation like KL is quite OK. Lambert sounds somewhat schoolmasterish.
    0 0
  43. So Trenberth says that Asian aerosols cannot explain the decreased rate of atmospheric warming. This differs from your previous representations that he was saying they do not exist or that they are insignificant. He says neither. Only that he does not believe they explain the change. Which still falls back to my prior statement that the uncertainty around these minor factors is still too large to separate them out... which is precisely the point Sphaerica was making (in reference to natural variability) that you 'disagreed' with in the first place... which was itself only tangentially on topic as these 'deductive analyses' of temperature anomaly components were one of the reasons it was obvious McLean's prediction was insane from day one... which is the actual topic here.
    0 0
  44. Ken Lambert wrote "Lambert sounds somewhat schoolmasterish", which is amusingly ironic given that the first sentence of his previous post was "I did find the actual Trenberth quotation on SKS". ;o) Having said which, it would be better if this conversation were conducted in a more calm manner on both sides, which requires (i) Ken to be more ready to accept when he has been shown to be in error and (ii) the rest of us to not let ourselves be wound up by the failure of others to accept having been shown to be in error. I know this can be difficult, but at the end of the day, to those that read SkS but don't post, it is likely that calm, patient argument is likely to carry more weight than insults or failure to admit error.
    0 0
  45. CBD and DM Your semantic confection of some sort of 'big error' on my part does not disguise the real points, to wit: McLeans prediction was wide of the mark and I have never argued for it. Trenberth's position on the stasis of surface temperatures conflicts with Hansen's position. It is not a minor factor as CBD is suggesting, because these two scientists are central players in the AGW story. Trenberth says that the imbalance at TOA is still about 0.9W/sq.m globally after all aerosol effects are accounted for; and Hansen plumbs for about 0.6W/sq.m mainly due to the increased reflection caused by Chinese aerosols and other factors (delayed Pinitubo effect etc). Hansen's figure is supported by recent OHC measurement whereas Trenberth is still looking for the missing heat. The warming imbalance is directly relevant to the surface temperature trend from Figs 2 and 3 above. It is heading for 14 years since the El Nino surface temperature of 1998 and several ENSO cycles and one 11 year sun cycle yet nothing much is happening to surface temperatures despite claims of an increasing warming imbalance. You can't have both an increasing warming imbalance and a stasis in surface temperatures.
    0 0
  46. Ken, it is dissapointing that you should respond to my post asking for a calmer discussion in a tone likely to irritate "semantic confection", and by ignoring my advice that you shoud freely admit wehen you are shown to be in error. Note I did not say that it was a "big error", just that it was an error. If you feel it was instead a minor error, then why not just admit to it? This is not a venue for rhetorical debate, it is a venue for discussion of the science. Discussion of science requires that one sets out their position unambiguously, which requires admitting error and reformulating the position when some issue (no matter how minor) is found to be in error. Your last paragraph is also in error, and is a point that has been made repeatedly. Surface temperatures are a small component of where the energy budget imbalance shows up. It is perfectly consistent to have an increasing warming imbalance and a stasis in surface temperatures if ocean circulation has been redistributing sufficient heat. Read the paper by Easterling and Wehner (2009) on this subject.
    0 0
  47. Ken wrote: "Trenberth's position on the stasis of surface temperatures conflicts with Hansen's position. It is not a minor factor as CBD is suggesting, because these two scientists are central players in the AGW story." Umm... both deep ocean heating and aerosol cooling are "minor factors" because they are small compared to other components of the ongoing temperature rise. I really couldn't care less how much 'political significance' you assign to them as theories held by "central players". That's a truly meaningless issue for purposes of understanding the science.
    0 0
  48. Ken Lambert - "You can't have both an increasing warming imbalance and a stasis in surface temperatures." Sure you can! Surface temperatures are but one (small) portion of the globe being heated. See the excellent thread for Breaking News…The Earth Is Warming…Still! - deep ocean temperatures are still rising, and the atmospheric and SST energies are only a fractional segment of the energy storage. Now, if the atmospheric, SST, and the deep ocean stopped warming, and loss of cryosphere stopped, then and only then, when considering all of the masses involved, the entire climate system, could you conclude that the warming imbalance has stopped.
    0 0
  49. Suggest you have a look at my comment on Glenn's piece in "Breaking News…The Earth Is Warming…Still!" I can only get about 0.37W/sq.m of total OHC increase over the last 7 years. The latest Loeb paper quotes total global imbalance at 0.55+/-0.45W/sq.m: 1.0 or 0.1 confidence interval - pretty wide. Hansen quotes 0.6W/sq.m. I have never claimed that the warming imbalance has 'stopped' or even zeroed. I have claimed that it has reduced - much less on some analyses than the modelled 0.9 - 1.0W/sq.m. - or was never of that magnitude to start with - which poses a problem for the theory of *increasing* imbalance from steadily increasing human releases of CO2. [snip]
    0 0
    Moderator Response: [Dikran Marsupial] I have stepped out of this discussion due to the need for moderation. Inflamatory content snipped. EVERYBODY involved in this discussion, please stick to the science; leave enforcement of the comments policy to the moderators.

    Also, please conduct any discussion of OHC on the other thread that Ken mentions so that we don't conduct the same discussion in parallel on both threads. I've added a link to Ken's earlier comment to make it easier to locate.
  50. CBD #47 "Umm... both deep ocean heating and aerosol cooling are "minor factors" because they are small compared to other components of the ongoing temperature rise." How deep is 'deep ocean'? There is nothing much happening over the last 7 years or so in the 0-700m layers. The 0-2000m layer is where most of the claimed warming imbalance is supposed to be; and 2000m - bottom is also being suggested as another possibly significant sink. Aerosol cooling is not a small Item. From memory, Hansen was claiming about -1.5W/sq.m as the Aerosol cooling forcing.
    0 0

1  2  Next

You need to be logged in to post a comment. Login via the left margin or if you're new, register here.


The Consensus Project Website

THE ESCALATOR

(free to republish)


© Copyright 2024 John Cook
Home | Translations | About Us | Privacy | Contact Us