


 Arguments


Recent Comments
Prev 1288 1289 1290 1291 1292 1293 1294 1295 1296 1297 1298 1299 1300 1301 1302 1303 Next
Comments 64751 to 64800:
-
YOGI at 11:49 AM on 24 February 20122nd law of thermodynamics contradicts greenhouse theory
scaddenp*misinformation sites * is there something wrong with NOAA and ISCCP data ? And how do I know that the data in graph at the head of this article is good data ? The two plots show that in the 600 and 750 cm-1 band, 265Mw radiate downwards, but only 225Mw upwards. How is that possible ? -
voice of reason at 11:40 AM on 24 February 2012Models are unreliable
I'll add a nice little discussion here following the revelation that on far easier to measure population data the true figure of climate refugees (based on what the models said would happen) in 2010 was zero. http://newsbusters.org/blogs/noel-sheppard/2011/04/12/flashback-2005-un-predicts-50-million-global-warming-refugees-2010 You do not use computers to do anything more than play games with role playing software, you do not pretend you can guess the future. That tends to come back and bite you in the tushy. -
voice of reason at 11:28 AM on 24 February 2012Models are unreliable
Having been requested to post my view on models here rather than Facebook am happy to add my four pence worth (-Snip-). The 2011 temperature was below the IPCC projection for no increase in CO2 (after quite a large one) while your own sea level example doesn't seem to be consistent with others either in the past (2003, reported in 2008) http://www.worldclimatereport.com/index.php/2008/05/06/slower-sea-level-rise/ or the present (note that you said the projection may have been conservative, but in a truly chaotic system chaotic things happen, in fact they have to as that is its nature) http://www.real-science.com/sea-level-continues-historic-decline Your articles are only as good as the latest data and can so quickly become out of date, (-Snip-). (-Snip-).Response:[DB] Time to acquaint yourself with this site's Comments Policy. You should be familiar with it: that of the SkS FB page was modeled on it.
Multiple violations of the Comments Policy snipped.
-
JMurphy at 10:59 AM on 24 February 2012DenialGate - Infographic Illustrating the Heartland Denial Funding Machine
CraigR wrote : "If I was to seek out funding and declared myself a "skeptic" I doubt funding would be given.....simply put if the world views of the decision makers changed so would the funding." Do you have any evidence to back up your doubts about funding ? Don't Lindzen and Spencer get funding ? -
Glenn Tamblyn at 10:58 AM on 24 February 2012Uncertainty Is Not the Basis for Investment
SB As we noted in recent posts here and here, Ocean Heat Content is the big ticket item, the dog that wags the tail. And since it is still rising, it completely slam-dunks the 'its stopped warming meme' So a real problem for Meyer and the view he puts up? Thats an understatement. -
scaddenp at 10:25 AM on 24 February 20122nd law of thermodynamics contradicts greenhouse theory
Discussion of cloud and humidity does not belong here. DSL has given you the link to the correct thread - and to what is wrong with the data in your links. You will linking to science instead of misinformation sites a better idea. As to water overlap, the real code (referenced) integrates over the full vertical profile of the atmosphere. You cannot draw accurate conclusions from simplistic constructions. -
CraigR at 10:21 AM on 24 February 2012DenialGate - Infographic Illustrating the Heartland Denial Funding Machine
I said ... "Decisions are made and financial benefits are provided particularly from convinced governments to enterprises, groups & business that have a vested interest in proposed solutions and ongoing research" therefore the issue I put forward is not limited to just "climate scientists" it is broader than that. It is quite clear it is not a level playing field. If I was to seek out funding and declared myself a "skeptic" I doubt funding would be given.....simply put if the world views of the decision makers changed so would the funding. I think declaring someone anti-science or pro-science in an effort to discredit them or place them above others is simply wrong "science" is to broader a topic for such generalizations. -
YOGI at 10:07 AM on 24 February 20122nd law of thermodynamics contradicts greenhouse theory
KR: "data on cloud amounts don't show a huge amount of change with temperature" 4% http://www.climate4you.com/images/CloudCoverAllLevel%20AndWaterColumnSince1983.gif "Trenberth estimates that we've seen an increase of ~4% to the total amount of atmospheric water vapor since ~1975" http://www.climate4you.com/images/TotalColumnWaterVapourDifferentAltitudesObservationsSince1983.gif -
dana1981 at 09:55 AM on 24 February 2012Scafetta's Widget Problems
We are trying to get these predictions on the record to hold them accountable. Hence the Lessons from Predictions series. -
YOGI at 09:46 AM on 24 February 20122nd law of thermodynamics contradicts greenhouse theory
scaddenp, I meant that CO2 and water overlap the same absorption band at 600 and 750 cm-1 so some of that effect there must be partly due to the water vapour. Water vapour is 1-4% lower down, so if we say 2%, thats 51 times the amount of CO2, and the the paper you linked says 75.5% for clouds and WV, and a mean of 17.5 for CO2. Which imply volume for volume, CO2 has about 12 times the warming potential of water vapour (from those figures). -
DSL at 09:44 AM on 24 February 2012Scafetta's Widget Problems
Why, wingding? They'll still be publishing the same stuff at WUWT in 2020, oblivious. -
wingding at 09:37 AM on 24 February 2012Scafetta's Widget Problems
hmm I really need to make a list of all the people who in 2020 will have to apologize for predicting cooling. -
DSL at 09:34 AM on 24 February 20122nd law of thermodynamics contradicts greenhouse theory
YOGI, what you're looking for is probably right here, in rebuttal to our star of the month, Lord Viscount Ubermensch Protector of the Realm and the Cure for Cancer, Christopher Monckton. -
2nd law of thermodynamics contradicts greenhouse theory
YOGI - You might be interested in looking at the difference between relative and absolute humidity. A certain relative humidity is required to form clouds (data on cloud amounts don't show a huge amount of change with temperature - 'tho what kind of cloud is going to be very important). Clouds, through precipitation, form an upper limit on the amount of relative humidity - past a certain relative humidity it simply rains or snows. However, as the air warms, the absolute humidity required to give a particular relative humidity increases - warmer air can hold more total water vapor. Trenberth estimates that we've seen an increase of ~4% to the total amount of atmospheric water vapor since ~1975, or roughly (if I recall correctly) the equivalent of Lake Erie. And all that water vapor acts in feedback as a greenhouse gas. -
Doc Snow at 09:05 AM on 24 February 2012Scafetta's Widget Problems
les, I suspect you're being rhetorical? Of course, WUWT espouses ABC--"anything but carbon." They seem to find consistency overrated. -
YOGI at 09:01 AM on 24 February 20122nd law of thermodynamics contradicts greenhouse theory
muoncounter I`m more interested in seeing how much changes in clouds and humidity follow changes in global temperature since 1985. http://www.climate4you.com/ see the graphs in the Clouds + Climate section. I cant see any evidence for positive feedbacks on water vapour/clouds either. -
SocialBlunder at 08:24 AM on 24 February 2012Uncertainty Is Not the Basis for Investment
There is a sentence that struck me as odd in the article: "Even more important for scientists (since the oceans are a much larger heat reservoir than the atmosphere) is the fact that the new ARGO floating temperature stations have measured little or no increase in ocean heat content since they were put in service in 2003." This contradicts what I see in OHC graphs presumably using ARGO data: and
and
 Since he is depending on level ocean temperature to cast doubt on global warming, this seems like a real problem.
-
funglestrumpet at 08:24 AM on 24 February 2012Monckton Misrepresents Specific Situations (Part 2)
Can we really let this obnoxious individual get away with endangering us? Surely the time has come to put a stop to him and his deceit once and for all. This site concentrates on the science of climate change, and does a very good job of it. From my perspective, the only thing missing here, and I guess it is due to a lack of published papers on the subject, is in-depth analysis of what is likely to happen for each degree of warming if the likes of Monckton get their way and we fail to take the necessary action to combat it. I know it is crystal ball stuff, but I think it necessary to be able to produce documentary evidence that Monckton is wrong, has been informed by recognized expert opinion that he is wrong, but ignores such information in subsequent presentations. We also need to demonstrate that he has to be aware of the dangers to human life of hindering or stopping action to combat climate change i.e. the degree by degree analysis. He makes great play of the fact that he is a Lord. Well, I wonder if we can get him stripped of his title on the basis of the dangers he is putting his country in. Though, quite frankly, I would like to see a situation where losing his title would be the least of his worries. As Peter Hadfield, in his Monckton Maneuvers videos, clearly shows, Monckton admits to not being a scientist, says to his audience that he can support any claims he makes, yet not only routinely fails to produce that support when asked, but changes (maneuvers) to a position where he eventually agrees with the science . The trouble is that by the time he gets round to agreeing with the science, the audience have long gone, possibly to rattle the cage of their parliamentary representative in order to demand that any action on climate change be halted because it is not the threat the ‘alarmist research fund seekers’ make it out to be. Meanwhile Monckton is off somewhere else repeating his misinformation to yet another bedazzled audience sitting rapt by this real English Lord, and a Viscount to boot, Wow! There can be no question that he wins the debates he takes part in, while being wrong on nearly every count (and I am sure we can prove that in many instances he is either deliberately so or can’t understand the science). You get a feel for Monckton’s persuasive powers by visiting WUWT –snip– (self censored!) and read the adulation he draws. I expect his theatre audiences feel the same way, “Don’t ya know?” I look forward to part 3 and perhaps the subsequent comments might include some pest control suggestions. -
les at 08:00 AM on 24 February 2012Scafetta's Widget Problems
could someone explain why all the "skeptics" who are convince the climate system and it's models are unpredictable due to chaos etc. Aren't attacking this? I did a search of wozupwidat and found it both supported various 'it's chaos' theories and Nicola Scafetta... I'm confused now. -
dana1981 at 07:54 AM on 24 February 2012Scafetta's Widget Problems
muon - Scafetta does have a 20-year cycle too. And a 10.4, and a 9-year. I'm sure he'll add a couple more in his next paper! Alexandre - this one is hottest because of Scafetta's linear and quadratic terms. Which he wrongly mostly attributes to solar and volcanic forcings. Hence the inclusion of Figure 4 above to show the actual physical cause of the warming trend. What's really interesting is the lack of physical understanding of radiative forcings from Scafetta, who has a PhD in physics (from both the University of Pisa and of North Texas). I'm not sure how you transition from 2 physics PhDs to climastrology in just over 1 decade's time. -
Alexandre at 07:29 AM on 24 February 2012Scafetta's Widget Problems
Ok, so there's this 60-year planetary cycle that is making Earth hot. For whatever reason - let's not nitpick. I suppose we should see regular peaks each 60 years, then. Why is this one the hottest of them all, as far as records/paleorecords go? The dawning of the Age of Aquarius, perhaps? -
David Lewis at 07:28 AM on 24 February 2012New research from last week 6/2012
Re: terrifying aerosols. Just when you thought it was safe to go back into the literature (the theme from Jaws is playing in background of this comment) The 2006 Crutzen paper that was said to have brought discussion of geoengineering out of the shadows might be good to post as a Classic of the Week. Crutzen pointed out that "since it is likely that the greenhouse warming is substantially negated by the cooling effect of anthropogenic aerosol in the troposphere, by 25-65% according to an estimate by Crutzen and Ramanathan (2003), but possibly greater (Anderson et al., 2003a,b), air pollution regulations, in combination with continued growing emissions of CO2 may bring the world closer than is realized to the danger described by Schneider 1996: "Supposing, a currently envisioned low probability but high consequence outcome really started to unfold in the decades ahead (for example 5 degrees C warming in this century) which I would characterize as having potential catastrophic implications for ecosystems... Under such a scenario, we would simply have to practice geo-engineering..." Crutzen noted that as of 2005 the World Health Organization was attributing 500,000 premature deaths per year worldwide to aerosols, which suggests they may in fact be cleaned up a bit. As far as "low probability" events go, given the case Kevin Anderson is making at the Tyndall Centre that civilization is already committed to 4 degrees C, and the fact that a 65% masking effect from aerosols may prove to be a midrange figure instead of the high end as when Crutzen published, it really looks like civilization is committed to geoengineering as of now. Eg: a -1.6 W/m2 cooling effect masking a 3 W/m2 assumed GHG warming effect means a net 1.4 W/m2 is operating. Reduce the aerosols by half, as Hansen suggests would be a "major effort to clean up aerosols" in "Earth's Energy Imbalance...", and you have an increase of the net forcing from 1.4 to 2.2, or 57% greater power we could actually see operating from what is already in the atmosphere. Hansen keeps on calling for actually measuring the cooling power of aerosols. He also keeps on mentioning that the high end of his range is that removing 1/2 of existing aerosols could reveal existing GHG to be 100% more powerful. Pongratz et al., in Crop yields in a geoengineered climate showed this chart as what their model projects temperature will be in a 2X preindustrial CO2 world: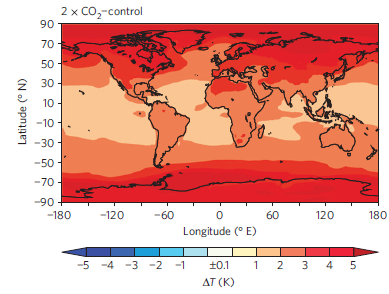 And they unveiled this as what happens if you inject sulphur particles into the stratosphere to cope:
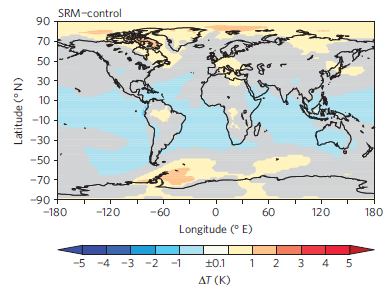 Of course the oceans die but you can't have everything.
Anderson would say we are committed to this now, if "all" the studies saying there are limits to how rapidly the fossil infrastructure can be dismantled are correct. Cheery, eh?
Of course the oceans die but you can't have everything.
Anderson would say we are committed to this now, if "all" the studies saying there are limits to how rapidly the fossil infrastructure can be dismantled are correct. Cheery, eh?
-
muoncounter at 07:21 AM on 24 February 2012Scafetta's Widget Problems
DM: "the problem of explaining why, for example, sulphate aerosols don't cause cooling" I think that's their goal. If everything is a natural cycle, there's no need for those messy physical causes. But this is hardly new science. See Kepler's Trigon, based on the positions of the 60 year conjunctions of Saturn and Jupiter: From the last date shown (1763), fast forward in 60 year increments: 1823, 1883, 1943, 2003! Clearly this explains life, the universe and everything. Of course, the conjunctions actually happen every 20ish years, but we can only count every third one (because that is what fits our preconceived notions).
Rhetorical question: how do you prove imaginary cycles wrong?
From the last date shown (1763), fast forward in 60 year increments: 1823, 1883, 1943, 2003! Clearly this explains life, the universe and everything. Of course, the conjunctions actually happen every 20ish years, but we can only count every third one (because that is what fits our preconceived notions).
Rhetorical question: how do you prove imaginary cycles wrong?
-
dana1981 at 07:13 AM on 24 February 2012Scafetta's Widget Problems
Well, Scafetta says that if (when) his prediction is proven wrong, he'll admit it. We'll see if he lives up to his word. -
scaddenp at 06:51 AM on 24 February 2012Scafetta's Widget Problems
So prediction time. 2018 will come and I rather expect climate to follow physics rather than imaginary cycles. Will Scafetta concede the issue - or magically find another cycle to make the data fit. Ladies and gentlemen, your bets please! -
Eric (skeptic) at 06:32 AM on 24 February 2012Uncertainty Is Not the Basis for Investment
I simply followed Albatross's example, it is obvious that Albatross spent some time reading and digesting Meyer's material. -
william5331 at 06:17 AM on 24 February 2012Monckton Misrepresents Specific Situations (Part 2)
Any chance of an article describing each of the proximity methods for recreating the temperature record before we had weather stations with emphasis on the positive and negative aspects of each method. It could become one of those iconic articles that is often referred to and sent to skeptics and not skeptics alike. -
Pete Dunkelberg at 05:20 AM on 24 February 2012Uncertainty Is Not the Basis for Investment
Eric (skeptic) I'm glad that you spell "Meyer" correctly. Others please follow Eric's example. Matthew @ 54, I think you are on the right track but you forgot CO2. Note that as land and sea warm for the reasons you describe, atmospheric CO2 increases. You can figure out why it might in about a minute. -
Dikran Marsupial at 05:02 AM on 24 February 2012Scafetta's Widget Problems
muoncounter quite, it also leaves them with the problem of explaining why, for example, sulphate aerosols don't cause cooling. I suspect he magnitude of the 60 year cycle is largely dependent on the post 1940s cool period, which is currently largely atrributed to aerosol cooling. If aerosols do cause cooling then Professor Scafettas' analysis is likely to over-estimate the strength of this apparent cycle. -
Martin Lack at 04:58 AM on 24 February 2012Monckton Misrepresents Specific Situations (Part 2)
Hi folks, Lord Monckton chaired the meeting I attended in the UK's Palace of Westminster (22 Feb) at which Professor Lindzen regurgitated his ICCC4 keynote address from May 2010. Unfortunately, there were so many misrepresentations of fact in this, I was foolish to try and address one of them before asking a question (and so was not allowed to ask it). However, it would seem that my 1800 word email to Professor Lindzen is getting noticed, because none other than Lord Monckton joined a discussion on the website of the UK's Independent newspaper a couple of hours ago in order to mock me then disappear again (in typical style). You may be amused to see the ongoing (mostly insane) discussion. I must say I am disappointed by the piece by Simon Carr and the insanity of many contributors to the discussion (I always thought the Independent was a sensible paper); but at least they sent someone to report on the meeting. I will publish my 1800 word email (critique of Lindzen's talk) on 28 Feb. (24 and 27 Feb are already taken up with 'James Delingpole - and ideological sceptic' and 'Climategate 2.0 - the first nail in the coffin of climate change denial' respectively. -
Search For 'Missing Heat' Confirms More Global Warming 'In The Pipeline'
neil - "The point that you are missing though, is that at the same time, the ocean is ALSO taking up heat [NOT releasing heat]. For this reason, surface temperatures remain roughly constant (on the 100-1000 year scale), but the deep ocean warms." That's actually not the case. The whole thing about "warming in the pipeline", or unrealized warming, is that the climate has a response time to forcing changes. Looking at ice core evidence, it takes at least 500-800 years (based upon CO2 delay) to come to equilibrium with such a forcing change. And during that time, as feedbacks kick in, warming (including surface) continues until that equilibrium is reached. The oceans will not prevent surface warming in the meantime. Variability such as ENSO may cause short term (decadal) lows and highs in the rate of temperature rise, but those are variations superimposed on the climate response. In the case of our anthropogenic forcing the climate is only partway through the transient response (roughly a few decades long), let alone the equilibrium response. The climate is still responding to forcing changes from decades ago. If we were to stop emissions in toto tomorrow, we can expect temperatures to continue to rise until that imbalance is canceled out, and the climate once again reaches (averaged) equilibrium. This does not, mind you, even consider the effects of emitted aerosols, which currently provide a significant negative feedback. Those have a fairly short lifetime (months?), and ceasing aerosol emission would immediately increase the TOA imbalance. Best scenario under halting all emissions? Temperatures continue to rise, quite sharply at first as aerosols fade. Then in 50-150 years (sorry, haven't run the math to be more exact) the imbalance should zero and start to reverse (transient response going up, against forcings due to oceanic absorption going down), temperatures will begin to decline, followed by a few hundred years of drawdown, followed by about 20-40% of anthropogenic CO2 that can only be drawn down over near-geologic timeframes. --- This "warming in the pipeline" is not a problem that can be solved like turning off a switch - the climate has immense inertia, and we've been pushing it for quite some time. -
muoncounter at 04:34 AM on 24 February 2012Scafetta's Widget Problems
Scafetta was busy in 2011, with a paper on the shared periodicity of auroral cycles and temperature. ... historical records of mid-latitude auroras from 1700 to 1966 present oscillations with periods of about 9, 10–11, 20–21, 30 and 60 years. The same frequencies are found in proxy and instrumental global surface temperature records since 1650 and 1850, respectively, ... This has the climastrology folks all up in a swirl. Scafetta finds these cycles by first removing an accelerating (concave up) quadratic trend from the temperature data.--source is first link above Among the residuals are numerous cycles, which these folks tie to the harmonices mundi, among other things. But isn't the accelerating quadratic trend the point? It is entirely non-periodic and fits the result of increasing greenhouse gas quite well.
-
idunno at 04:20 AM on 24 February 2012Monckton Misrepresents Specific Situations (Part 2)
Monckton has apparently responded, as was promised, to potholer54 (aka Peter Hadfield's) enumeration of his repeated lies, deceits an misrepresentations. As previously noted on another thread here, I was anticipating that Mr Watts would allow Monckton considerable leeway in his response. This, however, is mind-boggling. Be warned. Get a bucket handy before opening the following link: http://wattsupwiththat.com/2012/02/23/fakegate-why-the-perps-should-be-prosecuted/ -
neil at 04:18 AM on 24 February 2012Search For 'Missing Heat' Confirms More Global Warming 'In The Pipeline'
@ KR 37 , Yes emissions stop, that is the point. I obviously do not expect that to happen in reality, its a thought experiment used to explain a concept, as is widely employed in science. You are right that the carbon takes thousands of years to be removed from the atmosphere, which the ocean does very slowly. The point that you are missing though, is that at the same time, the ocean is ALSO taking up heat [NOT releasing heat]. For this reason, surface temperatures remain roughly constant (on the 100-1000 year scale), but the deep ocean warms. @ Rob 37 Ok. The paper describes a thought experiment - a clean way of isolating warming from "past emissions". This applies to reality too, and its very important for policy, because if as you say a significant amount of future warming will occur from past emissions, then it might well seem that the case is "lost" already. From Mathews and Weaver: "The perception that future climate warming is inevitable stands at the centre of current climate-policy discussions." [Note we are talking about greenhouse warming, to me your article implied that future warming will result as a consequence of something to do with ocean heat storage, which is why I brought this up.]. I don't think Damon Mathews would have three Nature papers on this if it was "utterly pointless", so please lets just take stock here in a respectful and polite manner. I'm quite surprised that you bring up the sea-ice thing, and then admonish my arguments above, well supported by the peer-reviewed literature, on the basis that there is nonsense in the literature and "someone considered it was worthwhile wasting supercomputer time.". As far as I understand, skepticalscience is about having reasonable, discussions based on the peer-reviewed science. To me, your comments seems to contradict this in spirit and letter. I fully agree that you have a point based on aerosols. But "heating in the pipeline" based on ocean heat is simply scientifically incorrect, and this has been demonstrated. If you need the paper, I'm happy to email it to you. @skept.fr 38 : This is is all consistent. If emissions "stop" the surface does not warm, but the ocean continues to warm. -
Dikran Marsupial at 04:16 AM on 24 February 2012Scafetta's Widget Problems
Alexandre I think it would be fair to say that the the calibration period of the cyclic component of Scafetta's model includes 2000-2011, so the cycles are not predictions, but hindcasts/nowcasts. The non-cyclic component is not directly calibrated on 2000-2011 so it is a prediction in that sense. However I wouldn't call it a prediction unless Scafetta had made a prediction in 2000 that temperatures would rise linearly at approximately that rate, rather than 2011. I haven't read all of his papers, so it is possible that he did. The linear trend from 2000 of 0.09°C per decade seems to me to essentially represent Prof. Scafetta's subjective opinion about the future trend in surface temperatures. It is only very weakly supported by the data by his rather arbitrary attribution of part of the rise in temperatures since the 1970s to various factors. There is little physical or statistical justification given for a linear rise as far as I can see. -
DSL at 04:10 AM on 24 February 20122nd law of thermodynamics contradicts greenhouse theory
At the risk of deletion, it could be called the Stuffing-Doltzmann Law or the Law of Diminishing Clarity. -
dana1981 at 03:56 AM on 24 February 2012Scafetta's Widget Problems
Alexandre - he changed it in 2011, but the change during the did not make the 'calibration period' fit any better (although maybe it does when using annual HadCRUT3 data, though I doubt it). The way I look at it, Scafetta is taking a rather wild and unsupported guess as to how future temperatures will change, and he applied that guess starting in 2000. Granted he knew the 2000-2011 temperature changes at the time, but since the fit is no better, he didn't really use that knowledge to his advantage. Then again, it's such a short timeframe and his model is so oversimplified that he couldn't really have used it to his advantage (i.e. the reasons for the short-term slowed global warming are not incorporated into his oversimplified model). -
Alexandre at 03:23 AM on 24 February 2012Scafetta's Widget Problems
dana1981 at 02:58 AM on 24 February, 2012 I understand, but when did he change his model formula? If he changed his model in 2011, than 2000-2011 is "calibration period", not prediction. His paper was written in 2011. Was it about a prediction he did 11 years earlier? Either way, it's poor and pointless curve-fitting, that fails miserably to hindcast past centuries - as you already pointed out. -
Philippe Chantreau at 03:15 AM on 24 February 20122nd law of thermodynamics contradicts greenhouse theory
Brilliant les!! That was the equation missing so that one could make sense of all this mess. I understand now... -
Philippe Chantreau at 03:10 AM on 24 February 2012The Year After McLean - A Review of 2011 Global Temperatures
Oscillation does not mean cycle. I once tried to find references on ENSO periodicity. Within 15 min of googling I had found a variey of papers trying to defend periodicities between 8 and 60 years. It remains to be shown that ENSO has any periodicity at all; it is quite possible that it is purely stochastic. In fact I do not know of solid evidence to the contrary at this point. If there is some, pointers are welcome. -
Uncertainty Is Not the Basis for Investment
Hi Matthew. I agree with you. My original post was deficient in that I didn't provide an estimate of expected warming. I was focussing on the point that feedbacks are well-established and that we cannot dismiss risk by dismissing feedback effects. About 10 hours ago I added a range of IPCC projections to the end of my post to represent likely outcomes. I think a 3 to 4 deg C warmer world has a unique set of risks that I could never cover in a single post. The effect of permafrost melting, drying out of peat lands, changes to forests, increased seasonal drying of soils, changes in ocean currents and sea level are likely to play roles in a warmer world. This is why I cited the Four Degrees collection. To go farther back in time, consider hyperthermals, sudden onsets of warming that occurred on top of an already warmer world than what we have today (e.g., first have of the cenozoic). Though the climate proxies documenting these are much older, I believe their existence is well-established, and therefore what we don't know about hyperthermals should also equate to risk. thank you, jg -
dana1981 at 02:58 AM on 24 February 2012Scafetta's Widget Problems
Alexandre - I would say post-2000 counts as a prediction, because that's when Scafetta arbitrarily changed his model formula. On the one hand he was still able to fit the model to the data from 2000 to 2011, but on the other hand, it's an arguably worse fit than if he hadn't changed the formula (as shown in Figure 3). The blue line in his figure is kind of useless, because it's noisy monthly data. He's mostly bragging that the red line is closer to his prediction than the IPCC projections, but the annual data is between the two, and well within the spread of IPCC model runs (as shown in Figure 6). Estiben - I think it's worth covering because Scafetta made this widget, which some websites (i.e. WUWT) display prominently. So it's important to assess its accuracy (which, as discussed above, is not good). -
Alexandre at 02:53 AM on 24 February 2012Scafetta's Widget Problems
Is he really bragging about a 6-month long "accurate prediction" (the blue part of his graph)? or did I miss something? -
Dikran Marsupial at 02:02 AM on 24 February 2012The Year After McLean - A Review of 2011 Global Temperatures
Ken Lambert wrote "An unsymmetrical ENSO over 10 years implies a larger cycle of ENSO." Nonsense, ENSO is not perfectly periodic, so an assymetry over ten years does not require a "larger cycle of ENSO". If you doubt this, then download one of the ENSO indices and compute the decadal trends, go on, I dare you. William of Ockam most certainly would not have agreed with any deduction that led to a more complicated model that did not explain the observations any better than a more simple model. That is the whole point of his razor. ENSO + solar + aerosol + trend does a very good job of explaining the observations, so there is no evidence that supports the deduction of some greater cycle. If you think there is, then the onus is on you to demonstrate that this is the case, rather than just making unsupported assertions. -
Breaking News…The Earth Is Warming…Still!
Ken Lambert - I would agree with you that ice melt is only a few percent of climate energy changes. Which is why I found your invocation of it here, in an apparent claim (as I interpreted it) that "warming in the pipeline" won't happen due to ice melt energy absorption (contrary to the OP, an this post in particular), to be, well, quite puzzling. -
Ken Lambert at 01:45 AM on 24 February 2012The Year After McLean - A Review of 2011 Global Temperatures
DM "If you cannot do this, they you have no good reason to invent some mysterious ocean circulation. The ball is in your court." An unsymmetrical ENSO over 10 years implies a larger cycle of ENSO. You say 30 years is not exactly neutral either. That implies a longer ENSO cycle (return to neutral) than 30 years. It is not mysterious just deductive. William of Ockham would no doubt agree. -
CBDunkerson at 01:41 AM on 24 February 2012DenialGate - Infographic Illustrating the Heartland Denial Funding Machine
CraigR wrote: "The amounts of funding are simply disproportionate to those that support the AGW theory and those that do not" What reference set are you using here? All forms of funding to everyone who supports/opposes AGW theory? Including the paychecks your employer gives you? If so then the money received by people who accept AGW is likely somewhat larger... because there are more of them. Making the difference very much 'proportionate'. All funding to climate scientists? Again, I'd argue that funding here is proportionate... because there are vastly more climate scientists who support the AGW theory (i.e. virtually all of them) than do not. All funding to anyone to promote a specific pre-determined viewpoint on global warming? Here I'd agree that there is a clear case of "disproportionate" funding, to the 'skeptics'. Also keep in mind, scientists are constantly trying to prove and DISprove countless aspects of climate science. Indeed, every significant scientific talking point the 'skeptics' have comes originally from research done by actual climate scientists (which 'skeptics' then distort or continue to reference decades after it has been corrected). Thus, treating all the money going into climate science as 'pro AGW' is simply false. That money is 'pro science', it is just that over a century of scientific efforts to contradict AGW have failed to do so. -
Ken Lambert at 01:32 AM on 24 February 2012Breaking News…The Earth Is Warming…Still!
KR & CBD All sea ice decline is small in absorbed energy terms. From memory, sea ice melt is 1-2E20 Joules/year in a Trenberth imbalance of 145E20 Joules/year (0.9W/sq.m). scaddenp #79 "Do we expect rapid decline in sea ice are in winter with rising GHG gases? No. Do we expect summer ice decline? yes." If sea ice largely recovers in winter - then the energy absorbed in a bigger summer ice melt is largely being lost to space. This indicates that more energy is being pumped through the Arctic in a larger amplitude summer/winter cycle. It is still small in energy terms - 2 or 3% of the claimed warming imbalance. -
DSL at 01:16 AM on 24 February 2012DenialGate - Infographic Illustrating the Heartland Denial Funding Machine
CraigR, the ultimate point is that worthwhile initiatives get funded. You could make the same argument about science in general: "Geez, these new theories about chemistry, physics, biology, and agriculture sure do have a lot of supporters. But there are alternative theories (God, FSM, Gaia). I'll bet the alternative theorists get funded much less than the scientists! Conspiracy! Waste! Fraud!" Heartland funding leads to a less informed public. Funding to climate science leads to a more informed public. The former profits the few; the latter profits the many. -
Matthew L at 01:05 AM on 24 February 2012Uncertainty Is Not the Basis for Investment
I have a question on this point about coming out of the ice ages: "If a long slow wobble (precession) was sufficient for Earth's feedbacks to raise the global temperature 8-12 degrees, we should be cautious, wary, risk-adverse of a global disturbance of 1 degree C, as this one degree disturbance occurs on top of an interglacial." Surely a disturbance of 1 degree C on top of an interglacial is a lot less dangerous than a disturbance of 1 degree C on top of an ice age? It seems to me that the conditions that prevailed on the Earth as it started to come out of the ice age were very different to those now (during an interglacial). The primary positive feedback driving the 8-12C of temperature rise was the melting of the summer ice and snow at low latitudes and consequent dramatic fall in albedo. The sunlight reflected from snow at 40-59N is much greater than that reflected from snow at the 60-90N. Hence melting at low latitudes causes a bigger reduction in the amount of light energy reflected back to space than the same area of melting at high latitudes. Once all but the polar ice caps remained the albedo stabilised, there was dramatically less summer ice and snow to melt and the positive feedbacks reduced - hence the warming came to an end. We cannot assume that the dramatic positive feedback affects that brought us out of an ice age still apply when there is no low latitude summer ice and snow to melt.
Prev 1288 1289 1290 1291 1292 1293 1294 1295 1296 1297 1298 1299 1300 1301 1302 1303 Next


