


 Arguments


Recent Comments
Prev 1335 1336 1337 1338 1339 1340 1341 1342 1343 1344 1345 1346 1347 1348 1349 1350 Next
Comments 67101 to 67150:
-
actually thoughtful at 14:48 PM on 23 January 2012A Comprehensive Review of the Causes of Global Warming
patonomics - it is notable that you have no 20th century examples of Galileo, nor can you produce any counters to the overwhelming evidence in support of AGW. I hope you will take the time to think about the implications of those two items. It appears your validation is already at hand. Your task is simply to understand what the evidence tells us - that world is warming, and man is to blame. -
patonomics at 14:46 PM on 23 January 2012A Comprehensive Review of the Causes of Global Warming
KR#60: What I tried to communicate is science needs validation and not assumption. I do NOT and can NOT equate myself with "Galileo". "mass of evidence supports anthropogenic global warming" - I am just asking if it is 1) validated or 2) derived from assumption, or from 3) theory (based on assumption)? If AGW is validated truth, why not its quantitative (I expect the relationship must be deterministic in quantitative level) form is presented in a equation of temp as dependent variable of human created co2. Once I get validation document it will SILENCE my Q. Is not that easy to and many other who claim "The mass of evidence supports anthropogenic global warming" ? -
Tom Curtis at 14:37 PM on 23 January 20122012 SkS Weekly Digest #1
actually thoughtful @63, you must remember that SkS started simply as a personal resource of a science (student? graduate?) involved in the AGW debate. John Cook, when he started SkS, was not the media savvy communication savy person he is today, but only wanted a resource for himself, which he decided to post publicly as an after thought. Consequently, in the early days he made some mistakes (such as that involving the quote on the Antarctic Ice thread). Another mistake has been not logging the dates of updates, which led accidentally to an even more embarrassing mistake in which an article was updated, and then later a moderator made an inline comment on a post made before the update, that assumed the article at the time of posting was the current article. We have certainly learnt from those mistakes. We have no intent to deceive in any way, so the mistakes are genuine; and we genuinely wish to not repeat them. Consequently, you will now note an indication of the last update time on each article where relevant. There has been ongoing discussion of other reforms, including a permanent publicly accessible change log, and a borehole. There are, however, technical issues that need resolving. Do, for example prior comments get moved with the old article to the change log? Further, these changes require rewriting code (apparently), and above all time. SkS is run by a very small group of volunteers working part time. Most of the volunteers have very time consuming day jobs, and family (and other commitments). Further, their available time is divided between administrative duties on SkS, producing new articles, researching to keep up with the science (where that is not part of their day job), and answering questions, and rebutting denier comments in the comments section. Given the available time, the output of some of the volunteers is extraordinary. Here I have particularly in mind Dan Nuccitelli whose production rate of new articles is phenomenal, Daniel Bailey whose work as a moderator is very time consuming, and of a very high standard, and John Hartz, who is phenomenal as a news hound for new research, or AGW related articles in the mass media or blogosphere (in addition to producing these excellent weekly digests). I know others do great work behind the scenes on technical aspects, but as I know nothing about the technicalities I cannot give them proper credit. So, while some of your suggestions re transparency are very good, and have been suggested in internal discussion, they have not been implemented, or have not been implemented yet due to a lack of resources. However, until George Soros decides to open up his purse strings, or we get more volunteers, we will do the best we can; and certainly appreciate your continued suggestions. (I should not, I also am a volunteer in a small way. Consequently my responses to you on this issue have not been officially endorsed, and reflect my own view of the situation. I believe, however, that my view fairly represents the situation.) -
A Comprehensive Review of the Causes of Global Warming
patonomics - My apologies, this may be a language issue, but I cannot parse your last post. The "Galileo Gambit only suffices if you are correct. The mass of evidence supports anthropogenic global warming - if you disagree, you need to provide a better answer, which you have (so far) notably failed to do. Global warming via human generated greenhouse gases fits the last 150 years of spectroscopy, all the observations, multiple fingerprints, etc. What alternative do you point to? If any? Or are you simply presenting the argument from incredulity, which is a logical fallacy? -
patonomics at 14:14 PM on 23 January 2012A Comprehensive Review of the Causes of Global Warming
actually thoughtful#57: You are entitled to hold your own thoughts, but that does NOT change my question about validation! -
patonomics at 14:11 PM on 23 January 2012A Comprehensive Review of the Causes of Global Warming
muoncounter#55: about your claim "The only thing circular here is your persistent conviction that you and you alone are correct." - is not true. I am looking for validation from AGW claiming community, when someone claims to AGW be deterministic. If you think I am talking about myself, "and not about validation of science of AGW", then we are not in same frequency. And there is no point to discuss further. I am only looking for validation, and validation alone, if there are any. Else I do not need anything from anyone! -
actually thoughtful at 14:07 PM on 23 January 2012A Comprehensive Review of the Causes of Global Warming
Patonomics - I have read your comments so far on this thread - your philosophy seems rooted in the Sophists of the ancient Greeks (although I mean the modern definition of sophistry). Also - if you are now invoking the (false) equivalence of climate "Skeptics" with Galileo (being a skeptic of an earth-centric universe) - there are two problems - 1) the entire body of science has had over 500 years to mature and expand - so basic misunderstandings, like the role of CO2 in the climate are very, very rare. Indeed, can you point to 3 cases of a basic misunderstanding about science that happened in the entire 20th century? and 2) Galileo himself built his theories upon two pillars - the body of science and his own observations. Both the body of science and observations now support the AGW theory (indeed even those vaunted 3% disagree dramatically on questions of where the warming is coming from (very few actual scientists claim no warming), where it is going, how fast, etc. ) So there isn't really an opportunity for a credible skeptic to invoke Galileo as a counter to the widespread (overwhelming) body of scientific evidence that the world is warming and man is to blame. -
The National Center for Science Education defends climate science in high schools
Eugene Scott is already aware of SkS (NPR link), and the NCSE is currently looking at climate change as an ideological issue in the classroom. I'm quite astounded that the "no government regulation" folks are more than willing to legislate facts in the same way that intelligent design/creationism activists are. And quite disappointed. Apparently well loved talking points triumph over ideology for some... -
patonomics at 14:02 PM on 23 January 2012A Comprehensive Review of the Causes of Global Warming
John Hartz#53: I strongly expect it ("Climate models are mathematical representations of the climate system") should be like that, so I could not comprehend why none could produce cause and effect relationship equation as yet in this forum (contrary I am getting everything other than that equation). In establishing science, scientist first publish a research article clearly depicting their formula, their all assumptions and then validate to claim why their equation is deterministic. But what I get so far is not that clarity but pointer towards some models, which when it old is not good enough, but new models are better. You may agree mostly people get Nobel Prize after scientific community can validate their science over decades, can anyone explain why in AGW of CS (Climate Science), old models need not to be validated, telling its outdated, but all people are expected to BELIEVE in current models (that's not validated conclusively and only evolving, and still expected to think science of AGW is deterministic)?Moderator Response:[DB] Models are not the topic of this thread, For a further discussion of those, see either the How do Climate Models Work? thread or the Models are unreliable thread. Please continue any discussion of models there, not here.
Furthermore, this thread is A Comprehensive Review of the Causes of Global Warming. Discussion of the philosophy of science on this thread have now run their course. As no meaningful fruit has arisen, it is now off-topic on this thread and subsequent pursuit of this topic will receive further, more severe moderation.
-
scaddenp at 14:02 PM on 23 January 2012Daily Climate Links: receive the latest climate blog posts, news and peer-reviewed science by email
B Ray, it might add water but it doesnt stay in atmosphere. The water-holding capacity of the atmosphere is ultimately determined by temperature. -
John Hartz at 13:57 PM on 23 January 2012How do Climate Models Work?
There is considerable confidence that climate models provide credible quantitative estimates of future climate change, particularly at continental scales and above. This confidence comes from the foundation of the models in accepted physical principles and from their ability to reproduce observed features of current climate and past climate changes. Confidence in model estimates is higher for some climate variables (e.g., temperature) than for others (e.g., precipitation). Over several decades of development, models have consistently provided a robust and unambiguous picture of significant climate warming in response to increasing greenhouse gases. Source: “Frequently Asked Question 8.1: How Reliable Are the Models Used to Make Projections of Future Climate Change?”, Working Group 1: The Physical Science Basis, UN IPPC Click here to access this document. -
muoncounter at 13:55 PM on 23 January 2012A Comprehensive Review of the Causes of Global Warming
patonomics#52: Concepts of radiative forcing pre-date the IPCC report of 2001. Keep in mind that IPCC documents are merely reviews of the state of the science at the time of issue - the basic research was done by others. See for example Hansen et al 1997. The only thing circular here is your persistent conviction that you and you alone are correct. You've been referred to numerous reference documents; the evidence for the theory that you're trying to dispute is readily available. -
patonomics at 13:46 PM on 23 January 2012A Comprehensive Review of the Causes of Global Warming
DSL#50: I do not claim to be Climate Scientist or Climate Professional and neither likely to be one in near future. I am looking for support if someone already validate in a form "any science validate itself non-confusingly (with out circular logic to depend)". I have my own profession to look after. My present interest is to check only if there are substantial Deterministic validation or not. I am not going to read and read in litterateurs and compete with those who are into full time Climate Scientist as their job. After reading your comments I recall about, Italian physicist Galileo Galilei, when he questioned traditional wisdom of majority, it infuriated the majority who are connected by consensus with "strong theoretical evidence" based on assumptions! I hope I have not infuriate you. That is not my intention or remotely target and I positively hope you do not have similar target either. I like your philosophical response for a needed scientific Validity on curiosity. I am not sure if someone might have better understanding about science with your philosophical response! -
John Hartz at 13:39 PM on 23 January 2012A Comprehensive Review of the Causes of Global Warming
Patonomics: “Climate models are mathematical representations of the climate system, expressed as computer codes and run on powerful computers. One source of confidence in models comes from the fact that model fundamentals are based on established physical laws, such as conservation of mass, energy and momentum, along with a wealth of observations.” Source: “Frequently Asked Question 8.1: How Reliable Are the Models Used to Make Projections of Future Climate Change?”, Working Group 1: The Physical Science Basis, UN IPPC Click here to access this document, -
Tom Dayton at 13:31 PM on 23 January 2012The National Center for Science Education defends climate science in high schools
I emailed to Dr. Johnson a heads-up about Skeptical Science's Arguments pages. Not going to tweet or Facebook to the radio program, so it would be nice if somebody else did. -
patonomics at 13:22 PM on 23 January 2012A Comprehensive Review of the Causes of Global Warming
muoncounter#49: I have checked 2 links you had mentioned, and all records point ultimately lead to [Ramaswamy et al., 2001 - you claimed as "Chapter 6 of the 2001 TAR, which is somewhat out of date" - http://www.ipcc.ch/ipccreports/tar/wg1/pdf/TAR-06.PDF] only, which starts with the assumption. . I think starting with assumption, no one, yes no one need to prove the assumption, but safely can use the "circularity" logic as mentioned in #38 -
Wcalvin@uw.edu at 13:18 PM on 23 January 2012It's a 1500 year cycle
1500-year cycles... It is the iceberg armadas (Heinrich events) that show the 1470-year cycle. The Dangaard-Oschger events are the fast (10yr) cooling and even faster (2-4yr) rewarmings of 10C, several dozen in the last ice age. As Stefan Rahmstorf noted, some coincide with the iceberg armadas, some don't. It is not correct to speak of a D-O Cycle. The rapidity of the warming is thought to be due to the albedo positive feedback, same thing as is getting started in the Arctic Ocean today but involving the entire North Atlantic Ocean. -
B Ray at 13:16 PM on 23 January 2012Daily Climate Links: receive the latest climate blog posts, news and peer-reviewed science by email
Two questions please (i)On the accepted efficacy of natural gas (compared with coal)in lowering emission of CO2 per unit of energy production - does this allow for the effect of "new" water emitted as vapour (a ghg)in the combustion of natural gas. Perhaps the new water is quickly precipitated from the atmosphere? (ii)In transitting to a lower carbon economy could you provide a pithy reference on the benefits of the conversion from coal to gas in electrical power generation? -
skywatcher at 13:12 PM on 23 January 2012A Comprehensive Review of the Causes of Global Warming
patonomics #49, I wonder if you can expand on any disagreements you might have with what I wrote? Or by having "no questions", do you agree with the two statements I made that you quoted? I have spent a great deal of time in cold places with inclement weather doing fieldwork aimed at understanding some aspect of Earth surface processes, and a great deal of that time I was not deriving an equation(!). I was increasing the level of understanding of some processes or of the past climate of the area, yet you seem to suggest that is not valid science? Or have you followed the links I provided (Richard Alley, Spencer Weart, 10 human fingerprints) and found specifically where there are fundamental problems with the theory of climate as it is understood today? I would be particularly interested, in the light of your quote in #44, whether you have watched the Richard Alley presentation, where quite a lot of the evidence of Earth's climate sensitivity under different past conditions was discussed (see also Knutti and Hegerl 2008). General unfounded claims of fundamental failings within the field of climate science ought to be supported with evidence if they are not going to be dismissed as spurious. -
DSL at 13:00 PM on 23 January 2012A Comprehensive Review of the Causes of Global Warming
Patonomics, every so often someone shows up on SkS asking for 100% certainty that the theory is true. It sounds like you're willing to spend a lot of time telling people here things that they already know. If you want absolute proof that atmospheric CO2 provides additional warming to the troposphere, surface, and ocean, too bad. You're not going to get it. You're going to get theory. And you're going to get observations. The alternative to the theory of AGW is . . . what? Or perhaps there is no way to theorize the climate, because there are simply too many variables. In that case, there is no way to theorize anything, because all "things" exist within the same universal context. Words, words, words. If you're philosophically incapable of accepting an answer, why ask the question of those who are capable of accepting the answer? If you are capable, you should realize that no climate scientist would take the "assumption" you point to as a simple assumption. There is strong theoretical evidence that the relationship exists. If you're truly concerned and not simply trolling like an overexcited philosophy major, read Spencer Weart's The Discovery of Global Warming. -
muoncounter at 12:40 PM on 23 January 2012A Comprehensive Review of the Causes of Global Warming
patonomics#44 Your friend has chosen a single sentence out of the 'Executive Summary' of Chapter 6 of the 2001 TAR, which is somewhat out of date. This hardly constitutes thorough scientific research. I suggest you review the following pages of Chapter 6 on Radiative Forcing, where the research is thoroughly discussed. Or consider Chapter 2 section 2.2 of the AR4 report of 2007: The concept [of radiative forcing] arose from early studies of the climate response to changes in solar insolation and CO2, using simple radiative-convective models. However, it has proven to be particularly applicable for the assessment of the climate impact of LLGHGs. -- emphasis added These foundational questions should make it clear to you that you should do a significant amount of reading before summarily deciding that climate science is circular, non-falsifiable or similarly flawed. -
patonomics at 12:38 PM on 23 January 2012A Comprehensive Review of the Causes of Global Warming
What are laws of nature? What does it mean to say that one thing caused another? It is natural to suppose: that these observations provide a neutral testing-ground for competing theories; that they can reveal how theories should be modified, and that they could tell us which theory is true. . . . .that the situation is not as clear-cut as it might appear. http://www.ice.cam.ac.uk/component/courses/?view=course&cid=4133 -
patonomics at 12:27 PM on 23 January 2012A Comprehensive Review of the Causes of Global Warming
Philippe Chantreau#45: Respected moderator deleted the part I put for you in #36, so I put a brief fraction in #38 May I personally recommend you to read the following 2 books when you get time, it might surprise you (it does to me at least in 2011) 1. What Is This Thing Called Science? - by Alan F. Chalmers 2. Science, Common Sense and Scepticism - by Alan Musgrave -
Bernard J. at 12:23 PM on 23 January 2012The National Center for Science Education defends climate science in high schools
Tom Dayton at #1. That is indeed a worrying recount. What that radio exercise shows is how a pseudoscientifically-influenced teen resists understanding proper science when it is explained to her, rather than how the science is, in and of itself, unconvincing. Sadly, many in the audience would not understand the very significant difference between the two situations. Of course, knowing that youth conditioned to denialism are not receptive to rational explanation is a useful thing, so it's not a completely wasted exercise. However, what it tells us is that a better forum than a radio stunt is required for delivery of real science to ideologically-indoctrinated denialist kids. It doesn't tell us that there is any problem with the science itself, no matter how much that will be the impression left in the minds of many who listened. I hope that the efforts of the National Center for Science Education go a long way to reversing this fundamentalist conservative resistance to rationalism. -
patonomics at 12:18 PM on 23 January 2012A Comprehensive Review of the Causes of Global Warming
Philippe Chantreau#45: I respect your communication. I completely understand your statement - "And I will not agree to disagree with you in the sense implying that we hold different, equally valid opinions. There is a right answer." . . . . . We just could not agree together. - but I respect you. Thank you very much for your clear communication so far. -
Philippe Chantreau at 11:59 AM on 23 January 2012A Comprehensive Review of the Causes of Global Warming
Patonomics I read your link from the University of Cambrige and I do not see at all how it supports the idea of a hierarchy between hypothesis, law and theory. I also read your link to the Guardian article and I see nothing showing that U. of Cambridge claims to be number one. The Guardian article ranks it as number one. I did not spend enough time on it to see what were their criteria. I'm sure if the N.Y. Times was doing a ranking of best Physics Universities in the World, they would come up with something different. It seems you are now trying to go to a hierarchy of universities so as to establish that what comes out of one is "better" than what comes out of another. I'll add that one of my links about the vanity of a hierarchy of concepts came from Berkeley, ranking #5 in the Guardian list. And I will not agree to disagree with you in the sense implying that we hold different, equally valid opinions. There is a right answer. A hierarchy of certainty for vastly different concepts has no merit. This is drifting far off the topic of this thread, however, and I will not pursue it any longer. -
Bert from Eltham at 11:56 AM on 23 January 2012Patrick Michaels: Serial Deleter of Inconvenient Data
I am so dismayed at this duplicity that I deleted some dollars from my vast wealth and made a donation to SkS. I urge anyone who thinks that the great unpaid work they are doing is worthwhile to do the same. Remember it may not be much individually but together it becomes a torrent. However pointless it is for the occupants to bicker over the direction of a crashing vehicle I like many have nowhere else to go when it is our planet Earth. Bert -
patonomics at 11:52 AM on 23 January 2012A Comprehensive Review of the Causes of Global Warming
muoncounter#42: My close friend shared with me the following reference, please guide me shall we understand Physics/Physical Science (yes NOT engineering) with assumption alone? "The practical appeal of the radiative forcing concept is due, in the main, to the assumption that there exists a general relationship between the global mean forcing and the global mean equilibrium surface temperature response (i.e., the global mean climate sensitivity parameter, λ) which is similar for all the different types of forcings." Source - http://www.ipcc.ch/ipccreports/tar/wg1/pdf/TAR-06.PDF -
John Hartz at 11:49 AM on 23 January 2012A Comprehensive Review of the Causes of Global Warming
patonomics: The twelve part series, “Atmospheric Radiation and the ‘Greenhouse’ Effect” posted on The Science of Doom website, would be a good place for you to start in your quest for the penultimate general equation of climate change. -
muoncounter at 11:36 AM on 23 January 2012A Comprehensive Review of the Causes of Global Warming
patonomics#41: There is nothing circular about calculating a temperature anomaly from changes in forcing. Perhaps you need to look into these concepts and the relevant evidence. Your volcano/earthquake question is irrelevant. We understand the atmospheric effects and account for them. Are you now claiming that earth science is invalid because it is not described by an equation? This is physics, not engineering. -
patonomics at 11:30 AM on 23 January 2012A Comprehensive Review of the Causes of Global Warming
muoncounter#39: about "quantitatively deterministic" support by your source is using "circularity" logic of theory as mentioned in #38, and not cause effect or "clear quantification equation" that other can verify of cause and effect, as you might like to claim Please refer #37 and here I like to ask - do you agree with the following statement? "You cannot write an equation for the totality of a volcanic eruption, with magma, tephra fall, gas released, pyroclastic flows, landslides, lahars, earthquakes and the rest" -
patonomics at 11:14 AM on 23 January 2012A Comprehensive Review of the Causes of Global Warming
To respond to #37 @skywatcher . . . . . "Not all science works by deriving individual equations or laws." . . . . . & . . . . ."The challenge for those doubting the validity of climate science is to find a way that the overarching (how) physics works, yet somehow does not apply to our atmosphere, where it has been observed to work" . . . Both claims above is a real eye opener for me. I have NO questions to you anymore! -
muoncounter at 11:13 AM on 23 January 2012A Comprehensive Review of the Causes of Global Warming
patonomics#36: "claims human generated CO2 as deterministic reason ... for surface temperature rise of earth, it should be quantitatively deterministic." It largely is. We can see what the forcing factors are and calculate temperature changes that result. There are many posts here explaining all the intricate details behind these calculations.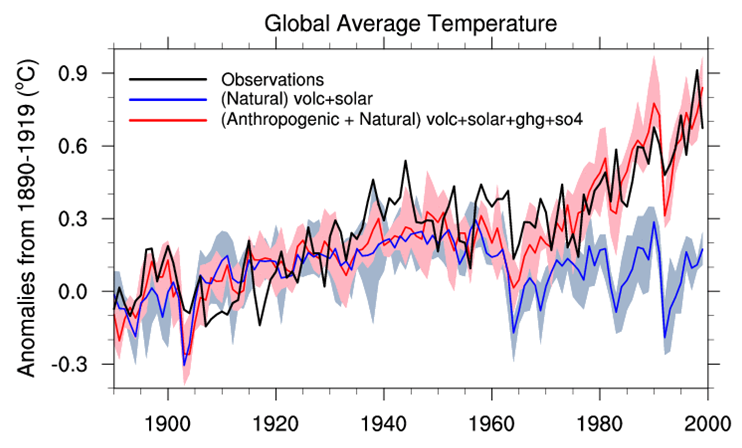 -- source
The figure shows clearly that we cannot account for current warming without anthropogenic factors (GHGs).
Climate scientists are not unaware of the requirements of science in general and physics in particular. One should be very careful not to assume that everyone working in the field is wrong. That happens rarely - once every few generations at most.
There is much to learn about climate science theory and observations available here at SkS, if you care to invest the necessary time - and if you have an open mind.
-- source
The figure shows clearly that we cannot account for current warming without anthropogenic factors (GHGs).
Climate scientists are not unaware of the requirements of science in general and physics in particular. One should be very careful not to assume that everyone working in the field is wrong. That happens rarely - once every few generations at most.
There is much to learn about climate science theory and observations available here at SkS, if you care to invest the necessary time - and if you have an open mind.
-
tmac57 at 10:55 AM on 23 January 2012The National Center for Science Education defends climate science in high schools
Eugenie Scott was recently featured on 4 of the podcasts that I regularly listen to, discussing the NCSE's new project.These podcasts are all done by real Skeptic organizations,not the fake ones: The Skeptics Guide to the Universe episode #340 http://www.theskepticsguide.org/ Rationally Speaking RS49 http://www.rationallyspeakingpodcast.org/show/rs49-eugenie-c-scott-on-denialism-of-climate-change-and-evol.html Skeptically Speaking #147 http://skepticallyspeaking.ca/episodes/147-science-and-politics Point of Inquiry http://www.pointofinquiry.org/eugenie_scott_defending_climate_education/ -
patonomics at 10:48 AM on 23 January 2012A Comprehensive Review of the Causes of Global Warming
To Respond #34 @Philippe Chantreau: The (-snip-) part by moderators at #36 , I am linking only a part of Philosophy of Science What Is Science? & . . . . . . Karl Popper rejected empirical proof as the ideal of scientific knowledge, arguing that a genuine attempt to falsify one's own theories was the hallmark of the critical attitude essential to science. . . . Theory and Evidence . . . . . The theory-ladenness of observation creates a threat of circularity in the confirmation relation. The presence of auxiliary assumptions blunt the force of any confirmation or refutation that an observation may have on a theory. . . . . . -
actually thoughtful at 10:36 AM on 23 January 20122012 SkS Weekly Digest #3
From your perspective, how well does SkS communicate what peer reviewed science has to say about global warming? /Does one have to be a climate science wonk in order to comprehend the majority of articles posted on SkS? Very well/No Does the three-tiered rebuttal system serve a useful purpose? Hmm. I like it in that usually all I need is the basic and the intermediate usually meets my wonkish needs. I have occasionally used the advanced when someone pulls the science card on me. But at that moment I am probably in trouble when they respond "yeah, but". This is probably my limitation, and not the format. How could SkS better communicate information to the average person who has only a rudimentary understanding of climate science? I think the recent focus on the multiple lines of evidence is very helpful. A few more powerful analogies between things we don't know everything about and climate change (which we also don't know everything about) - ie against the myth that we don't know everything so we can't do anything. It seems the basis for much of the resistance amongst skeptics is the idea that we will "trash the economy over poorly understood, convenient lies from the left". So an expansion of the "It is (much) cheaper to avoid this problem than to somehow solve it after the fact" line of articles is probably a very useful avenue to pursue. I look forward to the results from BC and California, but surely there are things to say before we get all the data from that. Also, the term mitigation is always one that I think could be used before or AFTER an event, so not using that term might make the material more approachable (and it might be my mental block on the word mitigation). -
Tom Dayton at 10:20 AM on 23 January 2012The National Center for Science Education defends climate science in high schools
Another organization that tries to educate about climate change is the U.S 's National Earth Sciences Teachers Association. Their executive director Dr. Roberta Johnson yesterday was on NPR radio's This American Life in episode 424, Kid Politics, Act Two. Host Ira Glass had her in one studio and a young teenager in another studio. He had the Dr. give her best arguments and the teenager respond with how convincing it was. The teen was thoroughly unconvinced. The teen's bottom line was that she might be convinced if she saw both sides of the argument laid out side by side. Hey! That's what Skeptical Science does! Will somebody please tweet or comment on Facebook to that radio program? I don't tweet and I rarely Facebook. Also it would be good for somebody to ensure the Dr. knows that SkS provides what the teen was asking for. -
skywatcher at 10:18 AM on 23 January 2012A Comprehensive Review of the Causes of Global Warming
patonomics, it seems you asked something quite unreasonable in reality. Reality is a lot more complex than a physical model of reality (google "spherical chicken" or "spherical cow"), yet some consequences of complex interactions are adequately modelled by simplifications, and other consequences are not dependant on the details of the complexity. You cannot write an equation for the totality of a volcanic eruption, with magma, tephra fall, gas released, pyroclastic flows, landslides, lahars, earthquakes and the rest. But you would not expect a single equation for such a complex process, yet it would be utterly naive to suggest we have no idea of how volcanoes work, or their environmental and even climatic impacts. Not all science works by deriving individual equations or laws. Why not look at the following thread: Ten indicators of a human fingerprint on climate and see if you can find a reason why these indicators are not valid. See if you can find fundamental reasons why Richard Alley's AGU presentation on CO2 as the key 'control knob' on climate is fundamentally flawed. The physics of human-caused global warming and more broadly of the greenhouse effect is not a theory on its own, but a consequence of the theories governing atmospheric physics, and absorption/emission of radiation by materials at specific wavelengths See Spencer Weart's excellent history of the CO2 greenhouse effect. Without these theories, most of astronomy and astrophysics, dependant on understanding stellar chemistry based on the absorption and emission of radiation by gases at specific wavelengths would not work. Heat-seeking missiles would miss - their development is inextricably tied to our understanding of the greenhouse effect). A myriad of other modern technologies do not work if you disregard the principles behind the greenhouse effect. But not everything that "works" has a single meaningful equation that describes its operation. The challenge for those doubting the validity of climate science is to find a way that the overarching physics works, yet somehow does not apply to our atmosphere, where it has been observed to work. -
patonomics at 09:40 AM on 23 January 2012A Comprehensive Review of the Causes of Global Warming
I must humbly acknowledge all responses and offer personal respect to each individual (in favor and against my views as critics) individually for your kindness so far. I think I am blessed. Here I will record some of clarification which will give clarity about my views further. To respond respected Moderator’s Response at #29 : I 100% agree with you “Grain silos are not good models of the Earth's climate system.” And I never claimed that, if you read between the lines in #29. The central point to mention there was “Grain silos are simplistic and manageable and completely observable and verifiable case if one compare with climate science. And even with today’s critical skills in modeling and with super computers, still it create lots of error. Climate science is with multitude of variables and much more complex. So when simple case (Grail silos) is NOT accurate what to expect predictions accuracies in complicated science of Climate”. To respond #30 @Tom Curtis: The case I have referred is part of scientific analysis with temperature in Centigrade, and I have NOT discussed this as Scientific Jugglery, so please please give attention about what they (researchers) said and done and measured temperature in Centigrade only NOT in Kelvin, also “in that particular case” science of seed/grain has no need to be referred with base of Temperature Kelvin 0, so please stop distorting the facts. I know most of the participants in this forum are serious and they do understand you are trying to distort the facts. To respond #31 @muoncounter: I definitely agree with you is lot of laws to explain something in physics. My submission is: if someone in this earth, claims human generated CO2 as deterministic reason (or most likely, and cannot be unlikely) for surface temperature rise of earth, it should be quantitatively deterministic. “So the claim such claim” temperature can be expected (if it’s NOT too much expectation form a lifelong student of science) to ask for deterministically defined in an equation along with many other variables which have positive and/or negative impact on surface temperature variations in this earth. To respond #32 @Glenn Tambly: in the following general equation f (X1, X2, X3, . . . . . Xn) is neither simplistic nor complicated, its general equation, and capable to be actually derived as simple or as complicated once wants to make it. So the general equation is left to one who wants to make it deterministic with respect to all integrated knowledge of co2 generation from all known sources, from land, sea, other water bodies, all animals (including amebas to humans), and all plants, and ALL other variables in climate that one claims to vary the temperature T(temp at time t) = f (X1, X2, X3, . . . . . Xn)* + c, * Where X1, X2, . . . . , Xn are variables, and they may very well be multidimensional To Respond #34 @Philippe Chantreau: I respect you as a person that you are doing your best to respond. I need to clarify I have no connection with “University of Waikato” what so ever, I just googled for and I get references and just refer it to make my point. Here I have again googled for World’s top university in Physics and now will be using some reference from University of Cambridge (that claims to be number 1 University in Physics)” which may not be offensive to you (I can just hope with a positive mind). I respect your views and you any way, and still we both can agree to disagree with our own individual perceptions. I hereby submit to you, please see the following, if you will like to agree or disagree with information, I agree with. (-snip-) To respond #35 @ Rob Painting: refer my response to #34 that I have no relation or connection to “University of Waikato”, I have just googled to find references from a University, to make my point. And I do respect you and your views, even when I have possess an individual mind, to agree or disagree with some science. I claim that I do not have “A sheep's herd mentality” – I own a mind of my own, and can validate facts when logically presented and stand alone with my own judgments or change my judgment, even when whole world is against me. So please keep your personal attack mentality for responding to someone. You can neither heart me nor make me happy.Response:[DB] Long off-topic segments snipped.
-
skywatcher at 09:24 AM on 23 January 2012Climate Change Denial and the Media - Banishment of Science Reality
skeptikal #25, you'll find people here are entirely welcoming to enquiring minds, but tend to react sensitiviely to those parroting tired old myths such as the claim that we only think it's happening because of models. In reality our understanding is based on a wealth of direct empirical evidence of a human fingerprint on the global warming signal - note particularly the reduction in heat escaping to space and more heat returning to Earth at GHG-specific wavelengths. This evidence is right in line with over a century of predictions based on the physical properties of CO2, and right in line with a wealth of palaeoclimatic evidence demonstrating that CO2 is the biggest control knob on climate (I'd hugely recommend watching this Richard Alley presentation - the speaker is perhaps the Republican most worth listening to in the world!). As others have said, data adjustment, which you put such a negative spin on, happens necessarily all the time. It is not done arbitrarily, and is always documented and justified. It is crucial to extract meaningful information from indirect sources, be they thermometers, sea floor sediments, or electromagnetic radiation; it is also crucial if you want to bring together multiple data sources, say thermometers at different elevations and so on, if you want a meaningful combined record. Genuine scepticism is a valued trait (every good scientist is fiercely sceptical of both their own work and others, however good the work is), but please provide evidence for your sceptical views on climate. Be sceptical not only of information that is in conflict with your worldview, but also be sceptical of information that agrees with your worldview. -
EliRabett at 08:04 AM on 23 January 2012The role of stratospheric water vapor in global warming
The oxidation of methane occurs mostly in the troposphere with a lifetime of ~ 5 years. However, this is not complete, and some leaks into the stratosphere. Methane in the stratosphere is the source of much of the water vapor there, since little can get through the cold trap at the tropopause. It is correct to say that methane oxidation in the stratosphere is the source of the additional water vapor there. It is not correct to say that methane oxidation occurs mostly in the stratosphere -
JMurphy at 07:12 AM on 23 January 2012How do Climate Models Work?
Very good, informative and easy-to-understand article. Thanks. -
Rob Painting at 06:47 AM on 23 January 2012A Comprehensive Review of the Causes of Global Warming
Earth sciences taught at the University of Waikato is appalling. My youngest son just finished at Waikato (not studying Earth sciences though) and was flabbergasted at the fake-skeptic nonsense Earth sciences students were mouthing. So if Patonomics is going there I fully understand his confusion on climate science. Earth sciences at Otago or Victoria University are of a far higher standard. -
John Hartz at 06:43 AM on 23 January 2012Climate Change Denial and the Media - Banishment of Science Reality
The Op-Ed that pbjamm referred to is: “The verdict is in on climate change” by Naomi Oreskes published by the LA Time on January 22, 2012. The sub-title of Oreskes throught provoking article is: “When it comes to climate change, open-mindedness is the wrong approach.” -
actually thoughtful at 06:26 AM on 23 January 20122012 SkS Weekly Digest #1
KR - on the issue of whether sites will hold themselves to the standards they "set" for SkS - I can answer that the site called Wattsupwiththat (WUWT) will - Here is what WUWT says about SkS (the only site WUWT holds out for special treatment): "(unreliable) due to (1) deletion, extension and amending of user comments, and (2) undated post-publication revisions of article contents after significant user commenting." Other than my post at 58 I know nothing about (2). But I can tell you that yesterday, on WUWT moderator amending my comments (by deleting harmless links to SkS) - I say harmless because it didn't involve any controversy, just answering another posters claims with an appeal to the facts (handily categorized here at SkS). I then responded by asking the moderator to allow a debate on the science to occur. Deleting request to allow science on WUWT I don't know what "extension" means -but the moderators did comment (inside my post) - which might be what extension means. So yes, a double standard is now documented. I doubt there is much surprise. I implore SkS to give us a site that is above this type of tit-for-tat - transparency, transparency, transparency! Beyond the borehole type concept KR mentions, I think serious consideration needs to be given to an archive for update/erroneous articles - this could have all kind of labeling that marks it as old/out of circulation/errant/wrong etc. - but transparency means you can see how things looked. And yes - our mistakes will be there for the world to see - even after we fix them. And any serious, credible person will put SkS up another 2 or 3 notches in respect for having the balls to do it. I note that *doing it right* always takes more effort than doing the minimum acceptable. I hereby offer some of my time to help in the *do it right* effort. As always, I sincerely appreciate all the behind the scenes work, and benefit from the end results. -
John Mason at 05:56 AM on 23 January 2012Arctic methane outgassing on the E Siberian Shelf part 2 - an interview with Dr Natalia Shakhova
Wili, The goose has been in the oven for sometime already! Hence my parting statement, which I think you will tend to find in most articles on this subject. WRT your question: lots of possibilities to read into this statement still. 50 Gt over what time period? A year? Ten years? Ten hours? Is there enough methane present for it all to come out in one place or, as I suspect, and alluded to in the article, is not a more likely scenario one in which an increase in outgassing via multiple pathways occurs over an extensive area? We don't know. Detection would depend on synoptic patterns at the time, which would control boundary-layer windfields in terms of direction, fetch and speed. An alternative might occur if a 5-15% methane-air mix was generated: enough of that and any ignition-source would provide something more likely to be picked-up on seismographs.... However, one could speculate until the cows come home and such topics are likely better for discussion over a pint or two of beer! Other questions likewise abound: thus I'm looking forward to examining the next data-release and in due course the results from further fieldwork. I am sure we will be returning to this topic again and again in the coming years. But for now, I would caution that is very tempting to jump to conclusions WRT Arctic methane, but in doing so without strong evidence, one is diverging from science, which is something I'd prefer to leave to politicians! -
funglestrumpet at 05:43 AM on 23 January 2012How do Climate Models Work?
barry @ 13:08pm (comment numbers all at '1' at time of writing) I would support your point if the articles showed any sign whatsoever of becoming typical of GreenPeace output. However, I see no harm in tub thumping in the comments section, if only because it is likely to be read by persons such as myself, who come here for accurate information on the topic and quite possibly feel as I do that there are overwhelming forces with a vested interest in keeping b.a.u. At least it sure feels that way. I for one will feel it all worthwhile if, say, my suggestion that the opening ceremony of the Olympics by subject to protest by the younger generation who are going to be subject to major effects of climate change, gets taken up by some activist group or other. Heaven knows, can it really be argued that simply proving people like Monckton wrong is a success? Lets face it, he doesn't seem to have changed his script, does he? He even gets introduced to Congress as one of the world's leading climate science experts! Perhaps SKS needs a 'paramilitary' wing! (I joke - with Shakespeare's 'many a true word ...' in mind.)Moderator Response: [muoncounter] Further comments on 'tub thumping' are off topic for this thread. Use 'The Big Picture' thread for general comments about advocacy. If you have more specific advocacy issues, find the appropriate thread. -
wili at 05:27 AM on 23 January 2012Arctic methane outgassing on the E Siberian Shelf part 2 - an interview with Dr Natalia Shakhova
Thanks for the clarification, John. I get the sense that by the time we have a really good idea of what is going on, our goose will already be pretty well cooked. I wonder if you could clarify something else. If there was a major one-time eruption of methane, of the sort Shakhova discussed (~50 Gt iirc), how long would it take a land-based monitoring station a thousand or so miles away to detect it? -
Chris G at 05:15 AM on 23 January 20122011 Hottest La Niña Year on Record, 11th-Hottest Overall
Re: John (#11) If the ocean retains relatively more energy (heat) during a La Nina relative to an El Nino, I suppose this means we can expect more verbiage about "missing heat" in 2012. It'll be an easy cherry pick to show a lack of temperature increase in the atmosphere while ignoring the temperature increase of the oceans, in the totality that we can measure, rather than just whatever layer happens to fit the preconceptions. Re: Tom (#21) Thanks for that reference. I have had heard, in the past, and had trouble accepting, that the human signal (GHG) only started about 1950. I always figured it was there, just hard to detect. And then there is the bit of, feedbacks aside, a constant increase of GHGs would produce a logarithmic (decreasing slope) curve, but an increasing rate of growth of GHGs should produce an increasing slope curve. If you add them together, does the result have a positive or negative second derivative? Anyway, that reference clears a few things for me. -
Tom Curtis at 04:47 AM on 23 January 2012Monckton Myth #11: Carbon Pricing Costs vs. Benefits
Waldo @46, Monckton made a similar effort against Australia's Carbon Tax which was demolished in analysis, but unfortunately I cannot lay my hands on the analysis at present. Looking briefly over his Canadian effort I have already detected one error in which he under estimates the temperature effect by a factor of 14, even granting his numbers for change in CO2 concentration (which I have not checked). If you want good information on the Canadian Scheme, probably this is your best bet. It claims a 1.5 billion dollar net current benefit assuming a 3% discount rate; which compares to Monckton's claim of a net 6.4 Billion dollar cost. Given that the gross cost is estimated at $8.2 Billion, with a benefit of $6.7 Billion dollar Gross benefit excluding the benefits from reduced greenhouse emissions, Monckton's claim is unlikely to stand up to analysis.
Prev 1335 1336 1337 1338 1339 1340 1341 1342 1343 1344 1345 1346 1347 1348 1349 1350 Next


