


 Arguments


Recent Comments
Prev 1370 1371 1372 1373 1374 1375 1376 1377 1378 1379 1380 1381 1382 1383 1384 1385 Next
Comments 68851 to 68900:
-
Daniel Bailey at 12:43 PM on 23 December 2011Updating the Climate Big Picture
GrahamC, the term 'conclusively prove' appears nowhere in the above article. -
Eric (skeptic) at 12:37 PM on 23 December 2011Roy Spencer on Climate Sensitivity - Again
A simple estimate of the corrections is to use current UAH data with up-to-date corrections and compare the trend for an early part of the data to the trend calculated in an old paper with uncorrected or less corrected data. The corrected trend for Jan1979 to Apr2002 is 0.26C or 0.11C per decade, see http://woodfortrees.org/plot/uah/from:1979.0/to:2002.33/plot/uah/from:1979.0/to:2002.33/trend The corresponding trend from the paper in Tom's post 51 above is 0.06C per decade. So about one half of the corrected trend for that period is from corrections and the other half is from warming over that interval. Looking back a little farther, there is 0.23 trend from 1979 through 1998 or 0.115 per decade in current corrected data. The corresponding paper http://journals.ametsoc.org/doi/pdf/10.1175/1520-0426(2000)017%3C1153%3AMTTDCA%3E2.0.CO%3B2 indicates a 0.03 per decade trend corrected to a 0.06 per decade trend (+/- 0.06). Although the "peak" in their underestimate of TLT trend may have occurred earlier than 1998, the correction made at that point seems to be the most significant in magnitude (comparing the error in the trend to the trend itself). Also the comparison above does not mean that the current corrections are complete. -
GrahamC at 12:10 PM on 23 December 2011Updating the Climate Big Picture
This is a great article. Just one niggle. Would you consider replacing the term 'conclusively prove' (in the Humans are Increasing Atmospheric Greenhouse Gases section) with something else? Lots of the non-scientists who resd this will interpret that as implying 100% certainty, and seeing the term used here makes them susceptible to the skeptics demand that they shouldn't believe anything unless it's 'proven'. -
muoncounter at 11:33 AM on 23 December 2011Updating the Climate Big Picture
mace, The geocraft CO2 history has been debunked many times. See this CO2 was higher in the past thread. Once again, the best advice is to read and learn, rather than make decisions from unsubstantiated claims. -
Bert from Eltham at 10:46 AM on 23 December 2011Foster and Rahmstorf Measure the Global Warming Signal
Yes Tom Curtis I am sorry if I went off half cocked. I fully realize it is not helpful. I am just an older retired Physicist and we are used to being correct! skept.fr is at least logical and his analysis is sound if his assumptions are real. The real problem I have is that full picture is difficult to comprehend. Flying a light aircraft solely on instruments is something you all should try. If you do not cross correlate all the information or rely on one instrument indication you will crash. We are all biased by our life histories. None of us is immune. Again I will think more carefully before posting next time. Bert -
scaddenp at 10:02 AM on 23 December 2011Updating the Climate Big Picture
"I think what's clear is that mother earth's been around billions of years, and we need at least 50,000 years to see the signal emerge from the climate noise." Nope. The temperature signal shows two things: 1/ internal variability (eg ENSO) which is unforced variation due to distributing heat around a water-covered planet. 30 years appears to more than enough time to account for this. 2/ forced variability from natural forcings (eg sun (milankovitch and solar output variation), volcanic aerosols; and longer time scales - variation from continent arrangement and GHG variation due to biochemical factors. To claim that you need a longer time to sort natural from anthropogenic would require some evidence that there is natural variation that is not yet linked to a natural forcing. As it stands - no evidence that I am aware of. We can account for past variation from past forcings and we know the strength of current forcings. Natural forcing alone do not account for current climate (eg Meehl 2005 or the summary in the IPCC report). Furthermore, there needs to some magic that counteract the effect of the known physics of GHGs. So far the modelled effect of increased GHG is being reflected the observations. Ignoring that and praying for some natural variation fairy to let us off the hook is imprudent to me. -
Bob Lacatena at 09:08 AM on 23 December 2011Updating the Climate Big Picture
4, mace, That's a wonderful find!!!! You should now look and see how the site you posted absolutely, undeniably and maliciously tricked you and anyone else who visits it. Concerning the "modern temperature record" they used, the recent temps (1979-2001) are supposedly from "Satellite stratospheric data," but since stratospheric temperatures (a) are not in any way indicative of surface temperatures and (b) have been cooling for the last 30 years (in accordance with GHG theory expectations), I think they really meant "tropospheric temperatures." Beyond this, however, if you compare the different measures, you'll find that comparing ground temperatures to tropospheric temperatures is apples and oranges. Concerning the temperature data from 1871 to 1979, why in the world did they use Southern Hemisphere data, of all possible global data sources? One has to scratch one's head at that choice. They may argue that it is similar to the Vostok ice core data (by at least being in the same hemisphere), but that sort of points out how wrong it is to compare any of that to the global mean satellite data. Concerning the temperature data from 1871 back... the temperatures at the poles change substantially more than the global mean temperature. This was true then and it's true now. It's called polar amplification. But the temperature swing in the Vostok data before 1871 is less than 2 degrees from the mean. The temperature swing today at the South Pole is more than 3. At the North Pole it's more than 4.5. So... they used three wildly disparate sources that show entirely different things that can't be compared, in particular a comparison of temperatures at one specific, extreme location in the past (one everyone knows will show more variation) as compared to the global mean temperature in the present (using a metric that everyone knows will show less variation in comparison, and yet it is by far the more important and more sensitive number). Quite a wonderful load of denial misrepresentation you've found! And let it be a lesson to you. Look into the data, and understand what you are looking at, before you accept what they are trying to sell you. -
Brian Purdue at 07:48 AM on 23 December 2011The Media & Global Climate Science Communication
Shoe – may I add to John Hartz’s directions Under each chart in article you will see reference to the figure numbers of charts in the study from which they were directly copied. They combine information from two separate charts in study to make them more comprehensive in detail. If you are now confident about the data collection methodology feel free to share. -
Rob Painting at 07:22 AM on 23 December 2011Ocean Acidification Is Fatal To Fish
Mace @ 19 - we don't know enough about the Cambrian (some half a billion years ago) to be absolutely sure about the ocean pH back then, and it can't be calculated from atmospheric CO2 alone. There is huge uncertainty about atmospheric CO2 concentrations that far back, and the estimates come from models, with few actual proxies. An additional consideration is that slow changes would allow the ocean to mix CO2 (and the resulting chemical changes) down to the deep ocean, diluting and therefore minimizing the drop in pH at the ocean surface. All-in-all it's a big question mark. The fact that life was actually blossoming at this time (the Cambrian Explosion) suggests the oceans can't have been inhospitable to life. In relation to the fake-skeptic canard of higher levels of CO2 in the past, I'm writing up the basic/intermediate/advanced versions of that rebuttal. Simple version = rapid rises in atmospheric CO2 lead to ocean acidificaton, whereas slow changes do not. Of course none of this has any bearing on species living today, especially the two fish species investigated here. They die when pH drops significantly, that's an observation - no modelling or interpretation of fossils required. This is a concern given the current rate of change in atmospheric CO2 is 5-27 times greater than the Paleocene-Eocene Thermal Maximum (as pointed out by the moderator above) and around 18-30 times faster than the Permian extinction (around 250 million years ago) also known as the Great Dying because over 90% of life on Earth went extinct. None of this means we are going to see a repeat extinction event, but at the very least it does suggest a monumental struggle for species to survive. Many will simply not make the grade. I suggest you avail yourself of the OA is not OK series to gain a better understanding of this rather ominous threat. -
mace at 07:04 AM on 23 December 2011Updating the Climate Big Picture
I think what's clear is that mother earth's been around billions of years, and we need at least 50,000 years to see the signal emerge from the climate noise. I think those ice core charts are a brilliant attack against deniers when they claim a few not so hot years are the sign of a cooling trend.Response:[DB] "we need at least 50,000 years to see the signal emerge from the climate noise"
Um, no. That is the entire point of the Foster and Rahmstorf Measure the Global Warming Signal thread. A thread which you have already commented upon..
-
mace at 07:00 AM on 23 December 2011Updating the Climate Big Picture
Sorry guys, I think this one's the one I meant to post:- CO2 v Temperature over last 50K years *Blush*Response:[DB] Rather than promulgating fake-skeptic graphs from dubious blogs, use rather the scientific sites, like this one from NASA:
-
TheTracker at 07:00 AM on 23 December 2011Updating the Climate Big Picture
I think the scientific understanding of carbon-cycle feedbacks has reached a point where it warrants a line or two in "the big picture." Significant, ongoing releases of CO2 and methane from melting permafrost imply that, at best, emissions must be cut more aggressively than previously estimated to stop the rise in atmospheric CO2. At worst, it could mean that we initiate a process in which even a completely carbon-neutral society sees CO2 levels continue to rise for centuries. Without wishing to distract attention from the central problem of human emissions, I think carbon cycle feedbacks are important enough to be included in a review like this one. -
Albatross at 06:45 AM on 23 December 2011Roy Spencer on Climate Sensitivity - Again
Chris @59, Thanks for the citations. Here is another important one by Prabhakara and Iacovazzi (1999), their abstract is worth a read. At the end of the day Spencer and Christy were wrong and Wentz and Schabel (1998), Hurrell and Trenberth (1997, 1998) and Prabhakara et al. (1998) were correct. But when first notified of the errors in their data by Hurrell and Trenberth in 1997, Spencer and Christy were quick to dismiss them and did not take the critique at all seriously, this from March 1997: "There isn't a problem with the measurements that we can find," Spencer explained. "In fact, balloon measurements of the temperature in the same regions of the atmosphere we measure from space are in excellent agreement with the satellite results." And in February of 1997 they said this: "Spencer and co-author Dr. William Braswell of Nichols Research Corporation have great confidence in the quality of their satellite data. "We've concluded there isn't a problem with the measurements," Spencer explained. "In fact, balloon measurements of the temperature in the same regions of the atmosphere we measure from space are in excellent agreement with the satellite results." "Instead, we believe the problem resides in the computer models and in our past assumptions that the atmosphere is so well behaved. " Note how quick they are to blame the models. more noteworthy though is their reliance on the balloon data is intriguing and convenient, because even back then it is well established in the literature that there were also serious issues/biases with the balloon data (see Luers (1997), Parker and Cox (1995), and Gaffen (1994) et cetera.) A summary paper by Randel and Wu (2005) can be found here. So when Christy claims that "When problems with various instruments or processes are discovered, we characterize, fix and publish the information", that is not entirely true and not what the literature and history show and does not credit or acknowledge the errors pointed out to them by other researchers. Additionally, when Christy claims that "Indeed, there have been a number of corrections that adjusted for spurious warming, leading to a reduction in the warming trend" that is not entirely true either as shown by Tom's research shown above. In the same blog post Christy says, "The notion in the blog post that surface temperature datasets are somehow robust and pristine is remarkable." Interestingly back in March 1997 Christy said: "Over Northern Hemisphere land areas, where the best surface thermometer data exist, the satellites and thermometers agree almost perfectly", said Dr. Christy of UAH." So in March 1997 he agreed that there was good agreement between the satellite and surface (land) thermometer data. Ironically, it is now in 2011 that the evidence that the surface temperature record is robust is strongest, but Spencer and Christy are still choosing to questioning that and casting doubt on the land temperature record. I strongly suspect that they in their heart or hearts know that the surface record is robust, but prefer to be merchants of doubt. Someone should write a book on this sad saga, maybe titled "Satellite temperature illusion". -
Rob Painting at 06:32 AM on 23 December 2011Updating the Climate Big Picture
Mace - your confusion will not be alleviated by reading fake-skeptic blogs, like the one you just linked to. Peer-reviewed scientific literature is what you should be reading. -
scaddenp at 06:22 AM on 23 December 2011Climate's changed before
I would say the modern agriculture would have a very hard time coping with climate change that happened as fast as the YD. However, no agriculture existed. Human's even as hunter-gatherers apparently did indeed struggle Pleistocene changes, with populations surviving in enclaves, driving migration. Fortunately, rapid climate change events are associated with the ending of ice-ages not interglacials. As to deeper time, time resolution becomes a problem unless the event can be interpreted from a single sequence. Rates of change far less than present are associated with the great extinctions in the paleo record. -
Chris G at 06:19 AM on 23 December 2011The Debunking Handbook: now freely available for download
Thoughts: I happen to have degrees in cognitive psychology and computer science; I'm familiar with a common misconception that human memory works like computer memory. It is not, at all. When you write to computer memory, it is like flipping a switch; whatever information was there before is erased and the new information is put in its place. There is no "memory" of what was there before. However, brains are organic by nature; memory works as associations between neurons and these have to be "grown". I've been out of the field for some time, but, to my knowledge, there is no mechanism to erase prior associations. Whatever the strongest association is becomes "the memory", and whatever weak ones may be present become some barely conscious addenda. It takes some repetition and active processing to develop a new connection to the point where it is stronger than the old one. I think that using this as a working model of brain behavior might help with understanding and predicting how it can be difficult to change someone's mind about an issue. For instance, with the one-myth, many-facts scenario, you have one strong pattern of association, and the multitude of weak associations never receive enough processing resources individually to overcome the strong one. The loudest demon metaphor comes to mind. I suspect that it applies to more that just our perception neurons. Changing a set of firmly entrenched, interwoven beliefs, can be like trying to create a paradigm shift. Sometimes it takes a traumatic event to cause such a shift. For example, young people often have the sense that nothing bad will happen to them because nothing really bad has ever happened to them before. Often, nothing short of something like getting in a car wreck, breaking a leg, or getting arrested and thrown in jail will convince them otherwise. I have some curiosity to look up other works by Professor Lewandowsky. The term "belief perseverance" comes to mind. (references available through Google). One of the more effective ways to overcome this is to get the other person to try to imagine as if some bit of information were true, and then build an logical argument from there. I think it is important to remember that the other person is likely to honestly believe the incorrect information, and refrain from accusations otherwise. -
mace at 06:17 AM on 23 December 2011Updating the Climate Big Picture
Thanks both. Sorry, I get confused with the baselines for these anomalies from time to time. I've come across this which plots CO2 against temperature for the last 50 years which I think is pretty conclusive. http://www.geocraft.com/WVFossils/last_500_yrs.htmlResponse:[DB] As Rob says below, it is better to relay on actual source material rather than just some blog. Data from the primary sources, placed in context, shows clear relationships between CO2 & temps difffering from the portrayals of your source:


-
John Hartz at 05:59 AM on 23 December 2011The Media & Global Climate Science Communication
Shoe: According to the study that Brian Purdue's article is based upon: "positive" means that an article was positive towards the proposed carbon policy; and, "negative" means that an article was negative towards the proposed carbon policy. The methodology employed by the study is set forth on pages 21 thru 23 of the report, "A Sceptical Climate: Media coverage of climate change in Australia 2011: Part 1- Climate Change Policy." To access a PDF of this report, click here. -
muoncounter at 05:56 AM on 23 December 2011Climate's changed before
mace, This is always a sobering graphic to ponder. Two degrees C on a global average is a lot - especially if it occurs quickly. Just be sure to note the non-linear time scale.
-
dana1981 at 05:27 AM on 23 December 2011Updating the Climate Big Picture
mace @1 - see has Earth warmed as much as expected? (short answer - yes it has). -
Stephen Baines at 05:18 AM on 23 December 2011Ocean Acidification Is Fatal To Fish
skept.fr I'd be surprised if people are not trying something like that, but such selection experiments are extremely challenging logistically. I know people involved in running them. It will take some several years - maybe a decade - before we see them show up in the literature. -
Stephen Baines at 05:11 AM on 23 December 2011Roy Spencer on Climate Sensitivity - Again
Tom, all I can say is "Wow." That is a pretty darn amazing record. It seems like like everyone else is doing Spencer and Christy's work. How have these guys escaped being pilloried for this record? Given the amount of frothing over the CRU emails, imagine the hubaloo that would be created by an equal but opposite set of corrections in one of the main temperature records that have supported increasing temperatures. It gives you a sense of how unbalanced the debate is, IMO.Moderator Response: [DB] Fixed text per request. -
chris at 05:03 AM on 23 December 2011Roy Spencer on Climate Sensitivity - Again
re Tom @55. Yes that's correct. The major scientific publications in which errors in the MSU analyses were highlighted are probably these: [1] B.L. Gary and S. J. Keihm (1991) Microwave Sounding Units and Global Warming Science 251, 316 (1991) [2] J. W. Hurrell & .K E. Trenberth (1997) Spurious trends in satellite MSU temperatures from merging different satellite record. Nature 386, 164 – 167. [3] F. J. Wentz and M. Schabel (1998) Effects of orbital decay on satellite-derived lower-tropospheric temperature trends. Nature 394, 661-664 [4] Q. Fu et al. (2004) Contribution of stratospheric cooling to satellite-inferred tropospheric temperature trends Nature 429, 55-58. [5] C. A. Mears and F. J. Wentz (2005) The Effect of Diurnal Correction on Satellite-Derived Lower Tropospheric Temperature, Science 309, 1548-1551. Wentz's response [see Science 310, 972-3 (2005)] to Spencer/Christy's comment on the latter paper on the list above is about as close as one gets in the rather rarifed language of scientific publications to insinuation of incompetence: "Once we realized that the diurnal correction being used by Christy and Spencer for the lower troposphere had the opposite sign from their correction for the middle troposphere sign, we knew that something was amiss. Clearly, the lower troposphere does not warm at night and cool in the middle of the day. We question why Christy and Spencer adopted an obviously wrong diurnal correction in the first place. They first implemented it in 1998 in response to Wentz and Schabel (1), which found a previous error in their methodology, neglecting the effects of orbit decay." -
skept.fr at 04:55 AM on 23 December 2011Ocean Acidification Is Fatal To Fish
We can suppose the adaptative capacity of a species has some relations with its fertility rate (time of generation and offsprings number by generation) in a context of environmental stress. Are there long-term experiments where the pH has been gradually rather that abruptly increased ? For example, each generation undergoes the equivalent effect on pH of +50 ppm, and so forth until a doubling or quadrupling. This would permit to observe more precisely the fertility rate of surviving individuals at each generation, and eventually to search some genetic / phenotypic specificities explaining the adaptation for those who survive and reproduce after the pH stress. -
dana1981 at 04:54 AM on 23 December 2011Roy Spencer on Climate Sensitivity - Again
Right you are, Tom. 0.135 out of 0.14°C/decade due to corrections by other groups. Yikes. -
Albatross at 04:45 AM on 23 December 2011Roy Spencer on Climate Sensitivity - Again
Tom @51, Many thanks. This exercise reflects very poorly on Spencer and Christy. -
chris at 04:43 AM on 23 December 2011Updating the Climate Big Picture
mace, we do already have the warming expected from the lower end of the range of climate sensitivities. Your link indicates that the surface temperature anomaly in the 1880s was -0.25 - -0.3 oC when [CO2] was ~293 ppm. The anomaly in your record is now 0.55 oC. So the warming is 0.8 - 0.85 oC over that period from your data. A 2 oC climate sensitivity should give an equilibrium warming of ~0.85 oC on raising [CO2] from 293 ppm then to 394 ppm now. So we've had pretty much all the warming already that is expected from the lower end climate sensitivity of 2 oC. Since the bulk of that warming has come from hugely enhanced increase in rate of [CO2] since the 1970's (i.e. relatively recently) we've got quite a bit of warming still to come as the Earth surface tends towards equilbration with the enhanced forcing. And that amount of warming has accrued despite the rather significant cooling contribution from greatly enhanced release of manmade atmospheric aerosols. Since the evidence indicates that natural warming contributions over this period (largely solar) have been small, this rather large temperature rise is in itself indicative that climate sensitivity is more likely nearer the middle of the range (i.e. near 3oC for a forcing equivalent to 2 x [CO2]) than the lower end. (one should also factor in the contribution to warming from other greenhouse gaes including methane, nitrous oxide, tropospheric ozone and CFC's....) -
Albatross at 04:42 AM on 23 December 2011Roy Spencer on Climate Sensitivity - Again
CBDunkerson @44, You noted about Eric's comments here that, "you seem very concerned that the Washington Post article and/or graph could be misinterpreted to mean something other than intended but still true... but not particularly put out that what Spencer and Christy are saying is blatantly false." That is the exact same impression that I have. We can debate the semantics of how the graph might have been better, but the message of that graphic is very (inconveniently) clear-- the UHI data were biased on the low side, and when Spencer and Christy eventually did start implementing the corrections, some from the RSS team, some of their own, in the majority of cases the corrections increased the temperature estimates. There are a number of problems here: 1) Spencer and Christy, to this day, remain way too confident in the veracity of their product and repeatedly overstate the robustness and accuracy of the satellite inferred temperatures, while greatly exaggerating uncertainties in the surface temperature record. 2) When told back in 1997 by Hurrell and Trenberth that their product likely had a significant cool bias, they dismissed it and made excuses (more on that later). Yet to this day they claim that they are interested in producing a robust product. 3) They are using their data to play politics and mislead politicians, the public and policy makers. 4) Even now Spencer and Christy are bending over backwards and cherry picking to lower the warming trend in their own data. For example, Christy cherry-picking 1998 is beyond belief. That issues has been dealt with so many times I have lost count (most recently here), but that does not stop Spencer and Christy peddling his nonsense in late 2011. 5) Spencer and Christy still have not released their code used to calculate the temperatures from the satellite data. That did not stop Christy from testifying before congress that their code was freely available. There are probably more disturbing issues with this saga, so feel free to add them. I'm writing something up on how badly Spencer and Christy have behaved on this file and will post it soon. I'm amazed that Spencer and Christy have not been investigated by UAH for scientific misconduct. Their repeated misrepresentations, cherry-picking, distortions, exaggerations, and their politicization of science are reprehensible and the very antithesis of good science. Unbelievably, Spencer has the gaul to accuse other scientists studying attribution of "pseudo-scientific fraud". -
Tom Curtis at 04:22 AM on 23 December 2011Roy Spencer on Climate Sensitivity - Again
Dana @54, Christy, Spencer and Braswell, 2000 attribute the discovery of the orbital decay adjustment they make to Wentz and Schabel (Wentz, F. J., and M. Schabel, 1998: Effects of satellite orbital decay on MSU lower tropospheric temperature trends. Nature, 394, 361–364.) The diurnal correction in 2005 is attributed to Carl Mears and Frank Wentz of RSS in Christy's readme file. Sorry, 3:22 am here so this is definitely my last post of the night. -
dana1981 at 04:13 AM on 23 December 2011Roy Spencer on Climate Sensitivity - Again
Tom, thanks for the analysis. Didn't UAH come up with the +0.1°C/decade orbital decay correction though? I thought I remembered Spencer taking credit for that, or maybe it was the diurnal drift (I know RSS identified at least one of those two). -
Shoe at 04:11 AM on 23 December 2011The Media & Global Climate Science Communication
First, I just want to thank you for all the work you do to keep this website going. It is a terrific resource. That said, take no offense at my questions below. I am easily confused by lack of definition, and am frustrated, but not with you, with my confusion. Please note the first post question for this column (not from me), in these comments. I hope you will respond to that poster's question. It would be very helpful for me, if you could actually define "negative" and "positive" for these charts. Does negative mean the article or headline says there isn't GCC, or that there might be, but humans are not to blame/can't fix it/it is "normal" cycles, or they were against policy changes or money budgetted toward the problem? And must "positive" articles/headlines be 100% in agreement with science and policy? Where do articles with mixed results land? I would very much love to share these charts, but first, I need to know something of the parameters that put an article or headline into one category or the other. Again, thank you, thank you, for your website. Best, Shoe -
Tom Curtis at 04:01 AM on 23 December 2011Roy Spencer on Climate Sensitivity - Again
CBDunkerson @52, I suspect that you are mostly right, but I cannot know that without somebody sufficiently expert getting their code and going through it with a fine tooth comb. However, I am sure the adjustments are legitimate. The problem is that the method of correcting a known warming influence (ie of making a cooling adjustment) is not always implicit in the data. Different teams might use different methods without it being possible to demonstrate which method is better from the satellite data alone. So while the reasons for the adjustments are probably legitimate, the method of adjustment may well have seen a consistent bias towards methods that show lower trends. -
mace at 03:59 AM on 23 December 2011Updating the Climate Big Picture
An excellent article that sums up the main points of the science. As the article says we need to concentrate on determining the feedback mechanisms so that we can provide a better understanding to the general public of what the future temperature increase will be. We know that a doubling of CO2 from 280ppm to 560ppm should produce a temperature increase of 2-4.5C. However, it's also clear that we don't currently have the 0.78C anomaly that the lower end of this range would predict for the 39% increase from 280ppm to 390ppm. The expected 5 year mean anomaly for 2011 is about 0.55 based on the annual figures and projected monthly figures from GISS http://data.giss.nasa.gov/gistemp/_graphs3/Fig.A2.txt I feel we need a more convincing strategy than to label our opponents as skeptics or denialists who don't understand the science. We should concentrate on the science rather than getting in to arguments which could be construed as overly defensive. -
CBDunkerson at 03:52 AM on 23 December 2011Roy Spencer on Climate Sensitivity - Again
DB wrote: "I demur. Stating something that is "Completely false" is misleading." Well, fine... if you're going to get all 'technical' about it. :] Thanks for the detailed analysis Tom. On your point about the existence of 'cooling' adjustments... I think it is still valid to say that errors in Spencer & Christy's work have consistently been biased towards cooling. Indeed, some of their cooling adjustments are likely examples of this problem, and even if there are correct cooling adjustments they are clearly very minor compared to the cooling errors. -
Tom Curtis at 03:31 AM on 23 December 2011Roy Spencer on Climate Sensitivity - Again
Update to my 39 and 40: Going exhaustively through the readme file for the UAH TLT dataset, I found listed the following significant adjustments: Version D: 4 Feb 2000 +0.013 C/ Decade 6 Oct 2000 +0.002 C/Decade 2 Nov 2001 +0.002 C/Decade 8 Apr 2002 +0.012 C/decade Version 5.0: 7 Mar 2003 +0.02 C/decade 5 Feb 2004 +0.002 C/decade 20 Aug 2004 +0.02 C/decade 7 Aug 2005 +0.035 C/decade 5 Dec 2006 +0.01 C/decade Together with prior adjustments, these amount to a cumulative adjustment of 0.146 C/decade. However, I note that the switch between version D and version 5 is quoted as generating an adjustment of +0.008 C/decade in the table above, and in the peer reviewed literature whereas it shows a cumulative adjustment of +0.029 C/decade in the readme file. Any such discrepancy must be resolved in favour of the peer reviewed literature, and therefore I propose to treat the readme file adjustments as ad hoc, and likely to be superceded without notice. Therefore I will ignore them. That being the case, the cumulative adjustments to the UAH TLT record add a trend of 0.069 degrees C per decade to that which would be shown by the original method. That represents 49.3% of the current 0.14 C/decade trend. To place that into context I calculated how much the 97/98 El Nino added to the trend by the simple expedient of calculating the base trend, and then recalculating the trend with all values during the El Nino period adjusted to parity with those of the immediately adjacent months (0.02 C). The adjusted trend was 0.008 C/decade less than the true data, showing that the 97/98 El Nino added 0.008 C/decade to the overall trend. That represents just 5.7% of the total trend, and just 11.6% of the effect on the trend of the various adjustments. Returning to Christy, we recall that he said:"The major result of this diagram is simply how the trend of the data, which started in 1979, changed as time progressed (with minor satellite adjustments included.) The largest effect one sees here is due to the spike in warming from the super El Nino of 1998 that tilted the trend to be much more positive after that date."
Describing adjustments that account for nearly 50% of the entire trend as "minor satellite adjustments" is misleading at the minimum. This is especially so as the single largest contribution to the trend (comparing adjustments and individual years) was the 0.035 adjustment found by Mears and Wentz, which represents 25% of the final trend. The largest single change in trend from year to year is the change of 0.1 C/decade between 1998 and 2000 (publication dates). In that change, the components where: Orbital Decay Adjustment +0.1 C/decade Hot Target Adjustment -0.07 C/decade 97/98 El Nino +0.07 C/decade It is true that the El Nino represents 70% of the net change in trend. However it is also true that the Orbital Decay Adjustment amounts to 100% of the net change in the trend. Picking the El Nino as being the most important part of that change is dubious at best. Saying that the largest effect is the spike due to the El Nino without mentioning that 30% of that spike in trends was due to the net adjustment is also misleading (at best). Finally, it is sometimes incorrectly stated by "warmists" that Spencer and Christy never find adjustments themselves, or that all the adjustments have been in one direction. In the chart @39, the two adjustments in red where found by other teams, whereas all other adjustments where found by Spencer and Christy. Further, there are clearly both positive and negative adjustments. Therefore both of these "warmist" beliefs are myths and should not be repeated. However, it is possible to note that the cumulative adjustments found by Spencer and Christy sum to a -0.066 trend. In contrast, those found by other teams sum to +1.35 C/decade. Interestingly, that means that left to their own devices, Spencer and Christy would still be reporting a trend of 0.05 C/decade. Given that their product has been an outlier sitting well below other temperature products from the beginning, the trend of their adjustments (excluding those found by other teams) is troubling to say the least. This is not a record you can look at and say with confidence that the scientists involved have not let biases guide their work. Characteristically, Spencer hints that they have another negative adjustment in the pipeline already. -
dana1981 at 03:07 AM on 23 December 2011Roy Spencer on Climate Sensitivity - Again
Tom @40 - I'd be interested in seeing a more accurate record. It would be useful for the response post. -
Bob Loblaw at 03:04 AM on 23 December 2011Foster and Rahmstorf Measure the Global Warming Signal
Re: skept.fr @ 57, and others Aerosol Optical Depth is usually measured using sun photometers, which have a series of narrow-band filters (a few nm wide) to take direct sun measurements at selected wavelengths. Yes, such methods are biased towards clear skies. The largest network with international coverage is NASA's AERONET. Look there for data, methods, etc. Another international network is the Global Atmosphere Watch PFR network, run out of Switzerland. There's is probably the best instrument, but there are far fewer of them that in AERONET. Measurements can also be made using "Rotating Shadow Band" instruments (also filtered), such as those by the USDA UVB Monitoring Network. -
Paul D at 02:58 AM on 23 December 2011Ocean Acidification Is Fatal To Fish
The results of the cod project that Arkadiusz refers to can be found here: http://www.codyssey.co.uk/ I think it should be pointed out that the research wasn't designed to investigate whether overall increases in temperature would be acceptable (eg increases across the board). In fact the site gives the impression that cod rested in the warmer temperatures, eg didn't feed. -
muoncounter at 02:57 AM on 23 December 2011Foster and Rahmstorf Measure the Global Warming Signal
mace#69: "if the oceans are getting warmer than why is the La Nina in 2010/11 cooler than that in 2000?" Let's not turn this into an el Nino/la Nina-centric discussion; there are several existing threads for that. The point here - really the core of Foster and Rahmstorf - is that these short term oscillations are noise written on the underlying signal. The amplitude of these oscillations is still large enough to make it look like 'it's cooling' when in fact that is just noise. FR removes the noise; without taking that step, we will still see occasional years that look cooler than they 'should' be. In fact, that's one way to show they have done an excellent job of separating the trend from the noise. But you seem to be confusing 'index' with 'cooler'. Look here for a description of how MEI is calculated. -
mace at 02:02 AM on 23 December 2011Foster and Rahmstorf Measure the Global Warming Signal
So, what I'm essentially saying is that given that the La Nina in 2010/11 had a greater cooling effect than that in 2000, yet 2011's global mean temperature is higher, then this means that another forcing agent must be responsible for raising the temperature and most likely that's manmade pollution. However, given that the oceans are getting warmer due to global warming, you would expect the La Nina in 2010/11 to have a reduced cooling effect as well, so 2011 should be warmer than what it is. Do you see my point? Our sea level predictions are dependent on the oceans getting warmer as well as the ice melting, but if the oceans are getting warmer than why is the La Nina in 2010/11 cooler than that in 2000? -
mace at 01:50 AM on 23 December 2011Foster and Rahmstorf Measure the Global Warming Signal
@Tom Curtis. Sorry, you misunderstood what I was asking. If you take a look at the Multivariate ENSO Index (MEI) figures in the chart in the article, the La Nina from autumn-2010 to summer-2011 had a cooling effect that was more pronounced than the one in 2000. I agree that 2010 as a whole had the highest global mean temperature and 2011 will be the hightest global mean temperature of a year where part of it had a La Nina. -
Arkadiusz Semczyszak at 01:26 AM on 23 December 2011Ocean Acidification Is Fatal To Fish
The results of both the cited works are very precise and should be simply to accept. The facts are not discussed, but ... ... but in no case, however, they authorize author's post above - R.P. - the title of post: “Ocean Acidification Is Fatal To Fish“ I propose this presentation . And are there any conclusions, eg: “How can acidification affect fish/fisheries? • Through growth – Ecological effects • Change in food quality, quantity, timing • Reduced growth may affect the fertility • Reduced growth may reduce survival – Direct physiological effects? • Through mortality • Physiological effects? How can acidification affect fisheries? • Through recruitment – Early life stages of fish (eggs, larvae) are likely to be vulnerable to change in pH – Changes in the plankton community may reduce survival in the early life stages due to: • Food quality • Food quantity • Timing – match/mismatch • Predation We are now facing a future with lower pH and higher CO2 that in combination with a rising temperature most likely will be unfavourable - at least for some species in some ecosystems.” ... but even these conclusions are there too, and such general - very important - the main comments: „Acidification – Effects on fish stocks and fisheries: • Nature and degree of effects are largely unknown • Both direct and indirect effects are anticipated • Effects likely to be highly diverse, depending on, i.a., ecosystem, fish species, state of exploitation • Effects may be confounded by effects of climate change and overfishing” To this I add Hoffmann & Sgrò (2011): “Evolutionary adaptation can be rapid and potentially help species counter stressful conditions or realize ecological opportunities arising from climate change.” Staying near the Baltic coast I very much like cod fishing - with the cutter. About the Baltic cod is here. Cod has 9 subspecies. Cod is the "old" species of fish - has a great adaptive capacity. According to some evolutionists - gene mutations provide adaptation - almost immediately - to the very rapid climate change, there is always a population of significant size This rapid change in the environment gives them mutations - "asleep" mutations accumulated in the population - “the chances”. It was found that species such as plants that bloom in the wild in only one color genes are virtually all colors. This is called "black & white cow effect" - which never occurred in nature. Moreover, it is worth noting that the maps - the location of many economically important species of marine organisms in this presentation (for example, slide 9 - No 13 Atlantic Cod) - waters are often the lowest pH . Perhaps it is coincidence - areas of low pH is usually also fertile areas for reasons other than pH: estuaries, shallow shelf, upwelling zones, etc. . However, it is known that eg the availability of many microelements (eg iron, manganese) strongly increases at a pH below 7.5. Lowering the pH can - in many areas of large surface - to increase NPP. Powerful ocean areas (up to 75% of the area) with a higher pH are “biological deserts” (as compared to those with a lower pH). In addition, remember that laboratory testing are not always confirmed by experiments in the environment. This was the case with cod and temperature. “ScienceDaily (Apr. 29, 2006) — Scientists at CEFAS (UK) have found that the migration pattern of wild cod is much less restricted by environmental temperature than laboratory studies suggest.” “... scientists following movements of wild cod equipped with electronic tags that record depth and temperature have found that whilst some fish prefer deeper cooler waters, others tagged at the same time prefer to swim in shallower habitats in the Southern North Sea where summer temperatures are consistently above 17ºC. [in the experiments it was: 11-15 ºC]”Moderator Response: Please try be brief and on topic. Your theories of everything are, shall we say, difficult to follow.[Doug] -
Tom Curtis at 00:43 AM on 23 December 2011Foster and Rahmstorf Measure the Global Warming Signal
mace @66, who says La Nina's are not becoming less pronounced? The graph below shows the various La Nina years in blue. If you look closely you will see a pattern. They are getting warmer. Indeed, the last two La Nina's have been warmer than every recorded El Nino year prior to 1998. If that is not becoming less pronounced, I don't know what is.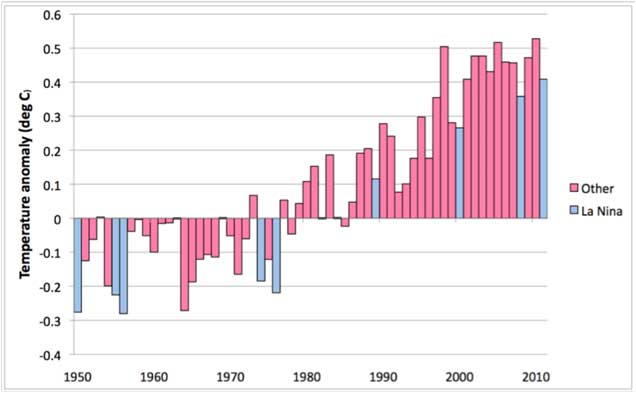 What has not happened, is that La Nina's have not become less pronounced relative to years within the same decade. But there is no reason why they should. Just as La Nina's are getting hotter for La Nina's, normal years are getting hotter for normal years, and El Nino's are getting hotter for El Nino's. So the short term contrast between El Nino's and La Nina's remains the same, and is expected to. Meanwhile, in the long term La Nina's are hotter than the El Nino's my father used to enjoy (and that I enjoyed as a child).
-
Tom Curtis at 00:34 AM on 23 December 2011Climate's changed before
mace @303, humans emerged in the Pleistocene as hunter gatherers in small groups of from 50 to 200 individuals. There is nothing in the consequences currently predicted from global warming that would make the life of small groups of hunter gatherers particularly difficult. In contrast, humans did not invent agriculture, cities, or civilization until the Holocene. There is a reason for that based in climate. During the Pleistocene climate was very variable over short time spans, with variations in temperature of up to half a degree C occurring in the space of a few hundred years, a condition likely to be inimical to agriculture. And certainly there is much in the potential consequences that will make agriculture much more difficult. So the question for your denier friend is, does he want all 7 billion of us to go back to being hunter gatherers? And how many of us does he think would survive if we did? Because todate, only Holocene conditions have proved capable of supporting agriculture, and we are rapidly leaving those conditions. -
Bernard J. at 00:20 AM on 23 December 2011Ocean Acidification Is Fatal To Fish
The cause of this slow growth, deformation and decline in survival rates in the experiments is not known, but given that inland silverside can grow and thrive in more acidified freshwater, this suggests something other than pH. Baumann (2011) suggest this may be related to high CO2 levels, or even the carbonate chemistry of the water.
I'm not sure that I'd completely dismiss pH itself as a contributor to altered growth and/or development in all marine fish. It has been known for many decades that the eggs/zygotes/larvae of many freshwater fish are exquisitely sensitive to hydronium ion concentration. Ask any serious breeder of some of the finnicky South American characins for a start - although the phenomenon is recognised in many taxa. Ironically, in fresh water it is often acid-loving species that are sensitive to changes in pH. Certainly carbonates and other salt species are enormously conspicuous components of the saltwater chemical milieu, and quite possibly dominate most piscine physiological responses to varying concentrations of dissolved ions, but hydronium itself is physiologically important. Changing its concentration in an environment that it extremely consistent by ecophysiological standards is quite possibly going to affect sensitive growth stages of at least some marine fish species, either by itself or in concert with coincident chemical changes arising from increase in ocean carbonic acid concentration. Whatever the mechanism, it should come as no surprise to most fish physiologists that pH will tend to target the early life-stages of fish. I've been speaking of such vulnerability for years, and I suspect that in a few more decades, should carbon emission control remain as limp as it has been to date, there will be a recognised crash in recruitment to quite a few important (and many not-so-important) marine fish stocks, arising directly from physiologial mal-adaptation to altered hydronium ion concentration. -
mace at 00:04 AM on 23 December 2011Ocean Acidification Is Fatal To Fish
I see your point DB. Sorry, I just want to arm myself as much as possible to combat some denialist rubbish coming my way at the moment. Please don't put me in the same bucket as those nutcases.Response:[DB] "Please don't put me in the same bucket as those nutcases."
I do not. However, repeating a meme gives it undeserved life. Perhaps a slight rephrasing of your statements would be more effective:
"One thing that I've heard repeated in some circles is that the temperature and CO2 spikes that occurred during the Pleistocene period were greater than what is happening today. Can someone help me understand why this statement isn't true or relevant to today?"
-
mace at 00:02 AM on 23 December 2011Climate's changed before
Hi all, I've been directed to this great post by DB. Unfortunately, it doesn't quite counteract the argument that has been presented to me by a denialist. In the Pleistocene period, human beings first emerged http://en.wikipedia.org/wiki/Pleistocene yet the climate history is telling us that there were some severe spikes and troughs during that period. http://en.wikipedia.org/wiki/Paleoclimatology Is the current increase in global warming greater than those experienced during Pleistocene periods? Can you provide me with a peer-reviewed paper that would help me to combat this denialist rubbish. -
Daniel Bailey at 23:57 PM on 22 December 2011Roy Spencer on Climate Sensitivity - Again
I demur. Stating something that is "Completely false" is misleading. -
mace at 23:57 PM on 22 December 2011Foster and Rahmstorf Measure the Global Warming Signal
@DB. The peer-reviewed paper in the article is saying that if you remove the effects of solar irradiance, aerosols and ENSO, then the warming trend continues. The article says "Foster and Rahmstorf find that ENSO has the largest impact on short-term temperature variations", as indeed is shown in their graphs. The graph is showing a cooling effect caused by La Ninas in 2008 and 2010, which accounts for what skeptic-deniers perceive to be the flattening in the warming trend. La Ninas are caused by upwelling of cold water, so my question is that given that the oceans are absorbing a lot of heat, why aren't the La Ninas getting less pronounced?Response:[DB] "why aren't the La Ninas getting less pronounced?"
Who said the La Ninas would get less pronounced? The La Ninas themselves are warming up. The most recent La Nina was the warmest on record, warmer indeed than many El Ninos. What you are missing is the incomplete temperature monitoring of the ocean deeps. Thus, what may seem like a "cooling effect" in the surface temperature record (which statistically is still warming during the La Nina) misses the injection of heat into the deep. Essentially, ENSO causes a redistribution of heat (thus the use of the word "variations"), but overall does not warm nor cool the Earth.
In the face of said posited "cooling", ask yourself how it is then that the most recent decade is the warmest in the surface temperature record?
-
CBDunkerson at 23:51 PM on 22 December 2011Roy Spencer on Climate Sensitivity - Again
Eric wrote: "That is not particularly clear but not misleading." Misleading, no. Completely false, yes. The El Nino was NOT the largest effect. See Tom's analysis above and his subsequent note about additional adjustments which weren't included in the chart.
Prev 1370 1371 1372 1373 1374 1375 1376 1377 1378 1379 1380 1381 1382 1383 1384 1385 Next


