


 Arguments


Recent Comments
Prev 1573 1574 1575 1576 1577 1578 1579 1580 1581 1582 1583 1584 1585 1586 1587 1588 Next
Comments 79001 to 79050:
-
Camburn at 11:01 AM on 18 July 2011Sea level rise is exaggerated
Steve: The transition from XBT data to ARGO data showed a huge step rise in OHC. We know because of instrument splicing, changes in models etc that XBT data had huge error bars. The results to date of ARGO data would indicate that the XBT data had a strong negative bias in measurement. With that in mind, and the fact that co2, because of its emissions spectra does not penetrate beyond the skin of the ocean. the idea of a 6.8 mm/yr thermosteric rise in sea level to 2100 is virtually impossible. -
Tom Curtis at 10:21 AM on 18 July 20112010 - 2011: Earth's most extreme weather since 1816?
Norman @341: 1) If a spinning body extends its radius, it will slow down the spinning body. Consequently, the raising of the tropopause does indeed slow down the Earth by some imperceptibly small amount. (Or perhaps no imperceptible, they measure the length of the day very accurately these days.) But in extending the radius, the angular velocity of the outermost portion of the rotating body becomes greater. 2) You repeatedly assert that the models do not allow for a changing environmental lapse rate. That is false. Rather, they do not program the change in lapse rate in to the model, but allow the physics to sort it out. 3) (And this relates primarily to your 337) you assume that the environmental lapse rate for a body of dry air from the arctic will be close to that for 100% humidity (6.5). In fact it would be much closer to the dry adiabatic lapse rate of 9.8. This relates to one of your most bizzare assumptions, ie, that the environmental lapse rate is almost identical everywhere. The environmental lapse rate depends on a large number of local features of the atmosphere, but most importantly on the relative humidity. If a body of saturated air moves south from the Arctic and warms from 0 degrees to 10 degrees C, it will no longer be saturated, and hence its lapse rate (all else being equal) will increase substantially. The same thing will happen if it moves south and goes from 5 degrees to 15 degrees C. Now look at the holding capacity of water vapour in air at different temperatures: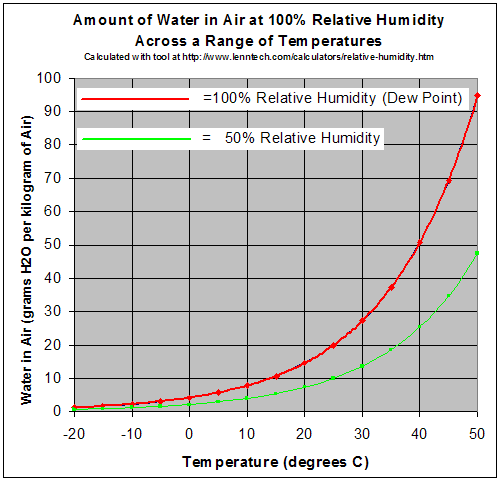 As you can see, an increase in temperature from 0 to 10 degrees C increases the holding capacity by about 5 grams per Kg of air. An increase from 30 to 35 degrees increases the holding capacity by nearly 10 grams. Half the temperature increase and nearly double the holding capacity increase.
There seems to be absolutely no understanding of this difference in your models. In contrast the meteorological models that tell us CAPE will increase have this built in to their physics.
3) Which brings us back to models, and you complete misunderstanding of what it means for a climate model to be accurate.
Consider a double pendulum. It's state at any moment can be completely described by seven, numbers three of which are invariant. The three invariant numbers are the length of the two pendulums, and the distance from the axis at with the second pendulum is attached to the first. The variable numbers are the angle of the main pendulum arm from the vertical, the angle of the second pendulum arm to the main pendulum arm, and the angular momentum of each bob.
Given the exact specification of each of these numbers, an ideal pendulum's behavior is deterministic but chaotic. Consequently a model of a double pendulum cannot predict the four variable values with any degree of accuracy more than a short time in the future. But what it can predict is the frequency of occurrence of particular values for the four variables, either individually or jointly.
In view of the fact that you clearly have no idea as to what are the strengths and limitations of climate modelling, can I recommend that you start by getting an appreciation of what can, and can't be modeled in chaotic systems. You just need a PC, a double pendulum, a stroboscope, and a video camera. Run a model of the pendulum on the PC, and collect as data the frequency of particular angles of the pendulums (the first two variables). Using the strobe and camera, set the double pendulum in motion and check the frequency of the various angles. If the model is any good, and if the pendulum is any good (stable base and low friction) the frequencies should match very closely. Having done this, and having gained a true appreciation of the power and limitations of the modelling of chaotic systems, then we can discuss models.
In the meantime you are obviously all at sea if you don't even know the meaning of "good approximation" in scientific use. FYI, Newton's laws of motion and gravity are a "good approximation" of the behavior of the solar system, yet using them the Voyager 2 space craft was launched on a fly by of four outer planets with an accuracy something like splitting a hair at 2 miles distance.
As you can see, an increase in temperature from 0 to 10 degrees C increases the holding capacity by about 5 grams per Kg of air. An increase from 30 to 35 degrees increases the holding capacity by nearly 10 grams. Half the temperature increase and nearly double the holding capacity increase.
There seems to be absolutely no understanding of this difference in your models. In contrast the meteorological models that tell us CAPE will increase have this built in to their physics.
3) Which brings us back to models, and you complete misunderstanding of what it means for a climate model to be accurate.
Consider a double pendulum. It's state at any moment can be completely described by seven, numbers three of which are invariant. The three invariant numbers are the length of the two pendulums, and the distance from the axis at with the second pendulum is attached to the first. The variable numbers are the angle of the main pendulum arm from the vertical, the angle of the second pendulum arm to the main pendulum arm, and the angular momentum of each bob.
Given the exact specification of each of these numbers, an ideal pendulum's behavior is deterministic but chaotic. Consequently a model of a double pendulum cannot predict the four variable values with any degree of accuracy more than a short time in the future. But what it can predict is the frequency of occurrence of particular values for the four variables, either individually or jointly.
In view of the fact that you clearly have no idea as to what are the strengths and limitations of climate modelling, can I recommend that you start by getting an appreciation of what can, and can't be modeled in chaotic systems. You just need a PC, a double pendulum, a stroboscope, and a video camera. Run a model of the pendulum on the PC, and collect as data the frequency of particular angles of the pendulums (the first two variables). Using the strobe and camera, set the double pendulum in motion and check the frequency of the various angles. If the model is any good, and if the pendulum is any good (stable base and low friction) the frequencies should match very closely. Having done this, and having gained a true appreciation of the power and limitations of the modelling of chaotic systems, then we can discuss models.
In the meantime you are obviously all at sea if you don't even know the meaning of "good approximation" in scientific use. FYI, Newton's laws of motion and gravity are a "good approximation" of the behavior of the solar system, yet using them the Voyager 2 space craft was launched on a fly by of four outer planets with an accuracy something like splitting a hair at 2 miles distance.
-
Steve Case at 09:54 AM on 18 July 2011Sea level rise is exaggerated
- Camburn ... I think you are overestimating sea level rise. Envisat data, which at this time is the most advanced, iindicates a sea level rise of approx 1.78mm/yr if memory serves me
The IPCC tells us that Over the period 1961 to 2003, global ocean temperature has risen by 0.1°C from the surface to a depth of 700 m. The IPCC also tells us, in table 10.7, that by 2100 we can expect thermal expansion to account for as much as 6.8 mm/yr. I'm questioning if those two facts are compatible. The graph that Albatross put up is nearly a straight line. In order to achieve the 6.8 mm/yr it's going have to change. So, how likely is it that it will begin a sharp upward trend resulting in that 6.8 mm/yr contribution from thermal expansion the IPCC tells us could happen by 2100? As I pointed out earlier, 6.8 mm/yr is worst case, but that's what the popular press will report, so it ought to be reasonable. Is it?
-
Albatross at 09:27 AM on 18 July 2011Sea level rise is exaggerated
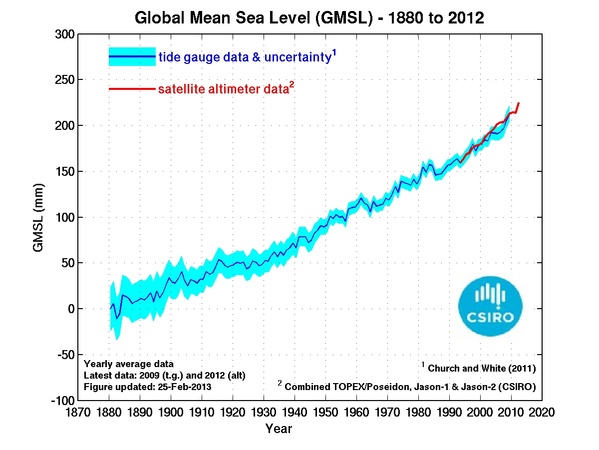
Re #129, You memory fails you. GSL is increasing at about 3.22 mm/yr, almost double what your memory thinks: Source]
-
Tom Smerling at 09:19 AM on 18 July 2011Does more extreme rainfall mean more flooding? Answer: Not always
Excellent. I appreciate the precision of this post, which takes care not to over- or understate the case. But it would be helpful to know more about the background and qualifications of the authors, so readers can judge for themselves the credibility. (A bit of bio info would also e useful when citing this rebuttal in a debate or interview.) Ideally, the brief bio (could be one line) would appear right with the post, or perhaps in a link within the post. -
Camburn at 09:18 AM on 18 July 2011Sea level rise is exaggerated
Steve: I think you are overestimating sea level rise. Envisat data, which at this time is the most advanced, iindicates a sea level rise of approx 1.78mm/yr if memory serves me. -
hfranzen at 08:53 AM on 18 July 2011OA not OK part 2: Thermodynamic duo
Please understand that I am not claiming to provide anything more than a correct analysis of a model system. The actual behavior of the real seawater system I gladly leave to others such as yourself and greatly appreciate your efforts. On the other hand, the point under discussion is the use of thermodyanmics and eq, 1 of the post. In that area I am an expert I assert that it is necessary when considering the thermodynamics of a complex system to consider the independent net reactions (any set will do - all yield the same result - but the set must be complete!) From this set of net reactions one finds the indepndent equilibrium constants and then combines these with other constraints to obtain as many equations as unknowns. It is not only incorrect but extremely misleading to select one equation (eq, 1) and then assert spontaneity of that reaction without specifying the source of the spontaneity. I have thought a great deal about this subject in general, published several times on it in J. Chem Ed. and have had some impact on the way the subject is taught. But my contribution here is simply to ask that the thermodyanmaics of ideal systems be correctly considered - not that I can proovide the final (or even a partial) answer to the description of sea water chemistry. Believe me I feel better knowing that folks such as yourself are considering the details of seawater chemistry and you will feel much more secure in your considerstion if your treatment of the basic P. Chem. of model systems is done correctly. And this is more than a pedantic point. To choose a single independent net reaction (eq.1) and assert that the precipitaion of carbonate is accompnaied by the liberation of CO2 as was done in the post is just not correct. -
Steve Case at 08:48 AM on 18 July 2011Sea level rise is exaggerated
- Well, observations show the thermal (steric) component of sea level is rising at 0.69mm per year over the last 6 years,
Is rising 0.69 mm/yr or is 0.69 mm/yr? It does make a difference. In any case, do you have a link for that observation? Even at 0.69 mm/yr is it reasonable to expect a possible 6.8 mm/yr due to thermal expansion by 2100?
- so your calculations appear to be missing important details - I see a glaringly obvious one in your calculations.
And that glaringly obvious one is?
-
Norman at 08:27 AM on 18 July 20112010 - 2011: Earth's most extreme weather since 1816?
Tom Curtis @ 336 Tom, I thought angular momentum would cause a slowdown of velocity when the system expands. (like the ice skater on ice analogy. She has a certain spin speed with her arms outstreched, when she pulls her arms in her spin velocity increases to conserve angular momentum). If the Hadley cells expand then the velocity of the air would slow down to conserve angular momentum. This would also be the case with an expanding troposphere. The winds in the rotating thermals would move slower as it covers more distance. Your point 3) That is the basics of my line of questions. An increase in moiture of an air parcek would increase the thermal velocity of an updraft if the environmental lapse rate was unchanged, I still do not understand why the lapse rate won't change. Your point 4) Would this temperature gradient between sea and land be sufficient to cause wind effects that were destructive? I think there is a calculation for it. Your point 6) This is the big one. The climate models. They put in many mathematical formulas to arrive at their results. I still wonder why the environmental lapse rate is not shown to change in the models. This all goes back to the post Dikran Marsupial had about the double pendulum model. Equations for double pendulum. These equations will generate a model double pendulum. Will it mimic a real world pendulum? In the real world many more varialbes would effect the actual motion of the pendulum. The model can only give a general description of a "real" world double pendulum. It may match one closely or deviate at some point because of some assumptions. In the models of severe weather they have many equations and must make some assumptions. Here is a link: Climate model equation. Quote from article: "In Meteorology, the primitive equations are a version of the Navier-Stokes equations that describe hydrodynamical flow on the sphere . . . Thus, they are a good approximation of global atmospheric flow and are used in most atmospheric models" Note "good approximation" Also a model has to make some assumptions. Why do they assume no longterm trend in the temperature lapse rates? Makes a huge difference in what the model will come up with. IPCC use of models for small scale events. Since climate models are based upon the laws of physics they are good guides for seeing patterns but all these laws working together makes a system to complex to model completely. The question still is why did Trapp et al (2009) find no longterm change in lapse rate temperature? One scientist's view: "Global Warming One: possibility for further research is whether or not a significant change in normal lapse rates is an indicator of climate change. My hypothesis is tha twith an overall warmer climate, there will be a slower lapse rate." Article for above quote. If the environmental lapse rate slows enough (less temperature difference with height) it will counter any effect that can come from higher latent heat in warmer moister air. It seems is if there is not enough agreement on what happens to the environmental lapse rate to make the Trapp et al. (2009) study conclusive about the future of severe weather events. -
From Peru at 08:06 AM on 18 July 2011Carter Confusion #3: Surface Temperature Record Cherries
As a student and future geologist, I feel ashamed from those geologists , like Bob Carter, that deny climate science. What should be evident tob any with a minimum knowledge of Geology, in particular Historic Geology (that includes paloclimatology as a branch) is that we are doing in a few decades what nature did in hundred thousands or millions years in the past. This wil cause necessarily a disruption, because life on Earth cannot tollerate such radical changes in so little time. One of the graphs he presented was this: With greenhouse gases at levels not seen in 15 million years, he should be very concerned about abrupt athropogenic climate change, because the glacial-interglacial oscillations evident in the graph above will be gone so we we are on track to an ice-free Greenland and a small ice sheet in Antartica, like in the Miocene 15 million years ago.
But he isn't, and the places where he gives his conferences, associated with free market capitalism such as the Heartland Institute suggest that his thoughts are strongly influenced by political/economical ideology.
He also make a conference at Sydney Mining Club, suggesting a link with coal industry.
So it seems that Bob Carter was either blinded by ideology or by economic convenience. What a shame for the geoological community!
Nota Bene:
If one thinks about it, the mining industry should be very concerned about climate change and peak oil, because them could make the costs of extraction skyrocket resulting in heavy economic losses. So them should be sustaining climate regulations, not opposing them....
...unless you extract coal, of course !
The mining professionals in extracting metals (copper, iron, lead, zinc, silver, gold, platinum, etc) and gemstones (diamonds, smeralds, zaffires, rubys, etc) should break away from the fossil fuel industrial monster, so that the mining industry as a whole would not be morally stained for the wrongs of one of his branches (the fossil fuel extraction branch).
With greenhouse gases at levels not seen in 15 million years, he should be very concerned about abrupt athropogenic climate change, because the glacial-interglacial oscillations evident in the graph above will be gone so we we are on track to an ice-free Greenland and a small ice sheet in Antartica, like in the Miocene 15 million years ago.
But he isn't, and the places where he gives his conferences, associated with free market capitalism such as the Heartland Institute suggest that his thoughts are strongly influenced by political/economical ideology.
He also make a conference at Sydney Mining Club, suggesting a link with coal industry.
So it seems that Bob Carter was either blinded by ideology or by economic convenience. What a shame for the geoological community!
Nota Bene:
If one thinks about it, the mining industry should be very concerned about climate change and peak oil, because them could make the costs of extraction skyrocket resulting in heavy economic losses. So them should be sustaining climate regulations, not opposing them....
...unless you extract coal, of course !
The mining professionals in extracting metals (copper, iron, lead, zinc, silver, gold, platinum, etc) and gemstones (diamonds, smeralds, zaffires, rubys, etc) should break away from the fossil fuel industrial monster, so that the mining industry as a whole would not be morally stained for the wrongs of one of his branches (the fossil fuel extraction branch).
-
Norman at 07:22 AM on 18 July 20112010 - 2011: Earth's most extreme weather since 1816?
Rob Honeycutt @ 339 It is not a lack of my understanding of "how it works" for Global warming to result in more extreme weather. I have read the peer-reviewed articles on the subject as well as other material. So far it is the same general concept. Increase in available moisture will produce air with much more latent heat. That latent heat will warm a parcel of air as it rises generating more buoyancy, faster updrafts and more moist air being drawn up in the updraft to perpetuate the cycle. I do understand this concept and I could agree with the conclusions if the environmental lapse rate did not change. Other material is suggesting the environmental lapse rate will be more negative with global warming (one reason is all the released latent heat from condensation will warm the mid=troposphere layers reducing the lapse rate and decreasing the buoyancy of future moist air parceles that enter this air. The steep lapse rates of the United States plains are caused by the cold northern air. This air will not be nearly as cold under global warming. That is what I attempted to demonstrate with my hypothetical H-Bomb in Arctic ocean calculations above. What I do not understand is why the researchers are assuming that the evironmental lapse rate will stay the same under global warming conditions. They do not explain it in the papers. Again from post 224 "From Trapp et al. (2009) "[18] The severe-thunderstorm forcing increases in time in spite of the decreases in vertical wind shear (Figure 1d), and because of compensating increases in CAPE (Figure 1e). Potential contributors to CAPE include the temperature lapse rate in the middle troposphere, the boundary-layer temperature, and the boundary-layer water vapor [e.g., Brooks et al., 2003]. For the current experiments, these are listed in increasing order of importance, with essentially no longterm trend indicated in the temperature lapse rates over a 3–5 km AGL layer (not shown), and a statistically significant positive trend in specific humidity q (Figure 1f). Considerable linear correlation between changes in CAPE and changes in q (Table 1) reinforces this attribution." This is the point I do not understand and would like some more clarification: " with essentially no longterm trend indicated in the temperature lapse rates over a 3–5 km AGL layer" Why woudln't the long term lapse rates change? Less cold air to move into air aloft, more heat in the air because of latent heat condensation release. With both these events taking place why do they not find a strong negative trend in the environmental lapse rate. Such a trend would suppress the severity potential of a mass of warm moist air. If you know an explanation I would be thankful. -
Rob Painting at 07:04 AM on 18 July 2011Sea level rise is exaggerated
Steve Case - 'So how realistic is it that in the next 89 years that the thermal expansion component of sea level rise will go from 0.36 mm/yr to 6.8 mm/yr?" Well, observations show the thermal (steric) component of sea level is rising at 0.69mm per year over the last 6 years, so your calculations appear to be missing important details- I see a glaringly obvious one in your calculations. Unless you're going to develop back-of-the-napkin climate models, that's going to continue to be the case. -
Albatross at 06:37 AM on 18 July 2011Citizen Science: Climatology for Everyone
I agree that surfacestations.org had the potential to be a good example of citizen science. Sadly it is not science when you set out with an agenda, preconceived ideas and bias as was clearly the case for Watts and his "team". Watch this this and read this, and then compare that with the results from the paper by Fall et al. (2011) that was ultimately published in a peer-reviewed journal and with the results of Menne et al. (2010). Yet to this day, there are people at WUWT and in the blogosphere who question the veracity of the global surface temperature record. Mission accomplished for Mr. Watts. -
zinfan94 at 05:53 AM on 18 July 2011Carter Confusion #3: Surface Temperature Record Cherries
I wonder why we need to keep fighting the same battles over and over... Cambern, the only differences I can see from your graph to Taminos first graph: 1. You used monthly anomaly data instead of annual anomalies. 2. You didn't use all the UAH data (the UAH satellite data begins in 1979), but you started in 1998. This is a cherry-pick. 3. Tamino adjusted the UAH data to compare to GISS, for the different baseline periods. UAH uses the most recent (warmest) 30 years ending in 2010, so reports smaller anomalies in comparison to the warmer baseline period, than GISS and HadCRUT which uses older (cooler) baselines. The baselines don't really matter, except that people MUST adjust for the different baselines when comparing the different anomaly data. Many people have made this mistake over and over again so many times over the years, that knowledgeable people are getting a bit frustrated with newbies (or pretenders) who compare the anomalies without taking into account the adjustments for different baselines. Many skeptics who should know better; and who have been told over and over to adjust for the baselines when comparing anomalies; STILL continue to post misleading posts comparing the anomalies BEFORE adjusting them to get accurate comparable results. Anthony Watts has done this over and over and clearly seems to be unable to learn even the basics of using anomalies for measuring temperature trends (see this idiotic Watts post from July 2009, where he ignores baseline differences.) -
Steve Brown at 03:57 AM on 18 July 2011OA not OK part 6: Always take the weathering
...Sorry, I should have mentioned it's the weathering of the Tibetan Plateau and not just the Himalayas! -
caerbannog at 03:53 AM on 18 July 2011Lessons from Past Climate Predictions: Wallace Broecker
To put some perspective on Broecker's 1975 work, remember that the Cray-1 back then had a maximum sustained performance rating of about 140 MFLOPS. Fast-forward to the present time, and we have the Apple iPad-2 producing LINPACK benchmark results in the neighborhood of 170 MFLOPS. So the best computing facilities available to Broecker when he published his 1975 paper were equivalent to something like a slightly crippled iPad-2. Something else to keep in mind when the "skeptics" start nit-picking Broecker's work. -
Steve Brown at 03:49 AM on 18 July 2011OA not OK part 6: Always take the weathering
The CO2 drawdown from the weathering of the Himalayas is thought to have been the main contributing factor to the cooling trend throughout the Cenozoic and the shift to the Great Ice Age thats been dominating the Earth's climate for the past 2.5 million years. -
dhogaza at 03:42 AM on 18 July 2011Citizen Science: Climatology for Everyone
SteveBrown: Menne et al was published in essence to defend science against the pseudo-scientific attack on the surface station temperature record. People had already sliced and diced the data using a variety of classification criteria and has shown that temperature reconstructions were robust despite acknowledged weaknesses in the dataset. Menne et al simply confirmed what was already known, using photographs to slice and dice the dataset would have no statistically significant effect. Waste of time for scientists who already have plenty of real work to do to move science forward rather than fend off attacks from innumerates like Anthony Watts. For those of us who've been involved in real citizen science efforts, in fields like ornithology and astronomy which have a rich tradition of citizen science contributions, the inclusion of the surface stations project as an example of "citizen science" is insulting. Now, let's flip the coin and ask why the Clear Climate Code project isn't on the list? NASA GISS intends to adopt their rewrite of GISTEMP. Now *that's* a useful contribution. -
actually thoughtful at 03:38 AM on 18 July 2011Carter Confusion #3: Surface Temperature Record Cherries
Tom Curtis - excellent analysis as usual. Thanks for battling the misinformation from the usual suspect. -
dhogaza at 03:35 AM on 18 July 2011Citizen Science: Climatology for Everyone
"To remove from the list what is surely the most popular citizen climate science project in the US" ... You weren't being asked to remove the christmas bird count ... surface stations may be the most publicized among a certain segment of society, but I've never seen it mentioned in, say, mainstream dailies or tv news. The CBC involves tens of thousands of volunteers every year and has been going on for over a century, and has provided invaluable data on changes in bird distribution in north america that's been used by a very large number of scientists in their work. Yes, the NCDC has said that the classification effort was useful, but that doesn't make it science. The usefulness was an unintended consequence of what was, in essence, a pseudo-scientific effort to prove that the surface station instrumental record is fraudulent. -
Steve Brown at 03:29 AM on 18 July 2011Citizen Science: Climatology for Everyone
I think you guys are being a bit hard on the Surface Stations project. The data it has gathered has generated two published peer-reviewed papers (Menne et al & Watts et al) which both confirmed that station siting does not affect the US temperature anomaly record and has resulted in the projects founder convincingly rebutting himself. -
actually thoughtful at 03:23 AM on 18 July 2011Lessons from Past Climate Predictions: Wallace Broecker
Wow - Broecker's 1975, after correcting to actual CO2 looks even more accurate than Hansen 1988. Thank you for the official right to laugh in the face of the next denier who claims "models are inaccurate" - 35 years and counting! (they won't be informed enough to realize it was part luck, part skill) -
John Russell at 02:58 AM on 18 July 2011Thinning on top and bulging at the waist: symptoms of an ailing planet
Apologies if this is a simplistic question, but as melted ice is so fluid, aren't we likely to experience more sea-level rise at the equator than in the higher latitudes as ice melts? If so, by how much? The other thought that occurs is; how do we know that the earth is oblate, when all heights are referenced above sea level and -- by definition -- because of its fluidity, the sea bulges outwards towards the equator on a spinning globe? I suppose the other way of asking this is, if all the water dried up would the oblateness still be as visible? -
Steve Case at 01:57 AM on 18 July 2011Sea level rise is exaggerated
- Do you mean short-term as in the last La Nina?
- Are you sure you're taking everything into account with this back-of-the-napkin calculation?
-
Bob Lacatena at 01:21 AM on 18 July 2011Websites for Watching the Arctic Sea Ice Melt
I've been watching web cam two, in particular that top heavy block of ice in the pond visible towards the horizon. It's obviously been melting from underneath. Between 9:37 and 17:35 on July 15th it finally melted enough to topple over. I find it interesting because it's a clear sign (I think) that more melting is occurring from underneath, due to water temperatures, than due to sunlight or air temperature. Before (click to enlarge): After (click to enlarge):
 Moderator Response: (DB) I can't place the reference offhand (perhaps someone could look it up as an exercise), but I believe bottom melt now accounts for nearly 60% of all sea ice melt.
 -
Rob Painting at 01:21 AM on 18 July 2011Sea level rise is exaggerated
Steve Case -"So, how likely is it that the current decreasing rate in sea level rise will do a turn around resulting in values represented in Table 10.7 from the IPCC's AR4?'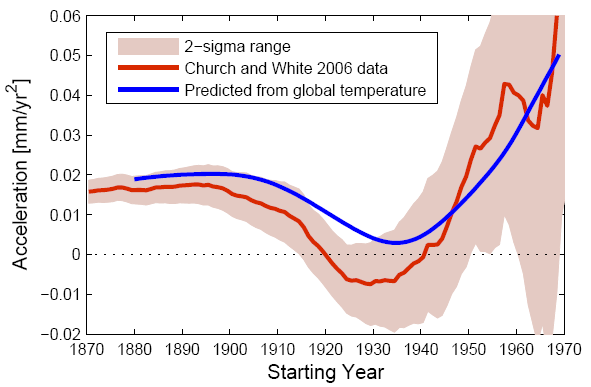
 What decreasing rate?. Do you mean short-term as in the last La Nina?
-
DSL at 00:52 AM on 18 July 2011Sea level rise is exaggerated
Steve, are you sure you're taking everything into account with this back-of-the-napkin calculation? Applying a simple thermal expansion formula to a global average affected by regional ENSO, large-scale circulation, and isostatic rebound issues is a sketchy proposition. Why not take a look at what the professionals are saying. -
Steve Case at 00:34 AM on 18 July 2011Sea level rise is exaggerated
The Chapter 5 Executive summary of the IPCCs AR4 Says: The oceans are warming. Over the period 1961 to 2003, global ocean temperature has risen by 0.1°C from the surface to a depth of 700 m.
globmaritime.com Says: At temperature 15°C, and atmospheric pressure, the coefficient of thermal expansion is... 0.000214 per degree Celsius for average seawater.
The National Climatic Data Center Says: Average annual sea surface temperature is 16.1°C
engineeringtoolbox.com Has a nice Online Thermal Cubic Expansion Calculator: 700 meter column V0 - initial volume (m3, ft3, gallons ..) 0.000214 β - volumetric expansion coefficient (1/oC, 1/oF) 16.0°C t0 - initial temperature (oC, oF) 16.1°C t1 - final temperature (oC, oF) Which yields: Change in Volume - dv = 0.015m (column)
From above 2003 minus 1961 equals 42 years and it follows that 0.015 m divided by 42 years equals 0.36 mm/yr
Table 10.7 from the IPCC's AR4 Says: By 2100 we can expect thermal expansion to account for as much as 6.8 mm/yr.
That is nearly 20 times the rate (calculated above) over the last 40 years or so.
Colorado University Sea Level Research Group Says: The rate of sea level rise over recent years has been less than the long-term average believed to be due to the recent La Nina's.
In other words, the rate of sea level rise has decreased in recent years due to lower temperatures. So, how likely is it that the current decreasing rate in sea level rise will do a turn around resulting in values represented in Table 10.7 from the IPCC's AR4? -
Paul Magnus at 23:44 PM on 17 July 2011Throwing Down The Gauntlet
Good links.... https://www.facebook.com/pages/ClimateFlightAction/165484890164497 Its a moral issue…. >Yes, our lives must be an expression of what we most deeply value. >Yes, we can and must make conscience-driven choices about how we spend our money and time. >Yes, we must provide a safe and thriving future for our children. By signing up to reducing your non-essential flying you make a big impact on emissions reduction in multiple ways. >Your emissions are substantially reduce. >Your resolution highlights and focus the urgency of the issue and the sort of effort that will be required to address the problem with your peers. >You reenforce and provide suport to consolidate action in tackling global warming. -
Paul Magnus at 23:41 PM on 17 July 2011Throwing Down The Gauntlet
I am afraid in my case stress is increased .... Because of the relative paths my partner and I are idown the line in addressing GW. -
kampmannpeine at 22:53 PM on 17 July 2011Monckton at odds with the very scientists he cites
hi, I am happy that Lord Cristopher does not speak German or French or Spanish, otherwise he would tour thru West Europe like he presently is doing to Australia ... Good job doing this debunking work. The problem is we "sceptics" are too weak against industrialized denialism at least my impression. Here in Germany there starts also an institution called EIKE (Europäisches Institut für Klima- und Energie - http://www.eike-klima-energie.eu/) lot of denialists.. -
Dave123 at 21:25 PM on 17 July 2011Carter Confusion #3: Surface Temperature Record Cherries
I wonder if Carter is 'talking the graphs' as looking at the area under the 'curves' above and below the zero line and finding them equal and concluding that it all must be noise....conveniently forgetting that when you convert to deviations from a calculated average for the time period, that's exactly the behavior you expect....that's what averaging and subtracting the average will do....and ignoring the obvious...that the area below the baseline is to the left, and that the area above the baseline is to the right. -
Robert Murphy at 21:16 PM on 17 July 2011Climate's changed before
Skywatcher at #189: "Wow, Doug #184 I would like to see one of your physics classes if that is what you teach!" He doesn't- he claims a 4 year degree in physics, and "Extensive subsequent private research and post-graduate studies in Economics, IT, Accounting, Business Administration, Marketing, Climate Change, Nutrition and Natural Medicine". He started something called the "Natural Medicine Research Centre". That doesn't sound promising. He is not a physics teacher, he's an internet scientist. -
Doug Mackie at 20:48 PM on 17 July 2011OA not OK part 6: Always take the weathering
JosHag @8: Fantastic! Well done. Enrio Fermi was an early pioneer of the spherical cow approach with his famous piano tuners problem. -
JosHagelaars at 19:09 PM on 17 July 2011OA not OK part 6: Always take the weathering
@Doug Mackie 5 I got the message. I just presumed there were dissolution rates involved. Sorry about that, next time I will give it some more thoughts before I pose a quick question. The chemistry is no problem though and I'm very interested in the topic. I had never heard of a spherical cow before, but this cow calculation gave me 4035 years to get rid of 3050 Gt CO2. -
Rob Painting at 19:00 PM on 17 July 2011Why Wasn't The Hottest Decade Hotter?
David Lewis - "If you are discussing short term variability, then make it clear. The deniers aren't discussing that topic." Did you miss this bit from the above post? "Looking at the above graph, it's clear that, despite the long-term warming trend, there are a number of short-term periods where global temperature shows little or no warming. So another slow-down in warming is hardly a novel observation." And is the title not a bit of a gimme? Like I alluded to earlier, 'warmist' comments are disappointing. Break free from your antagonistic tendencies and look at the evidence. For instance in the recent Trenberth thread you referenced James Hansen's lecture. Note what he says at about 44 mins. He says that the planetary energy imbalance flattened out. This is clearly labelled in figure 1 of his recent paper Earth's Energy Imbalance and Implications Hansen seems to largely agree with the findings of Kaufmann (2011) - both suggest that the aerosol forcing increased over the period, allowing natural processes (such as decreased solar activity) to dominate.
Want to see the upper ocean (700mtrs) heat content data?
Hansen seems to largely agree with the findings of Kaufmann (2011) - both suggest that the aerosol forcing increased over the period, allowing natural processes (such as decreased solar activity) to dominate.
Want to see the upper ocean (700mtrs) heat content data?
-
Doug Mackie at 18:30 PM on 17 July 2011Great Barrier Reef Part 3: Acidification, Warming, and Past Coral Survival
DLB@12. So I'll ask again if you have evidence for this in coral?If you can find some research that says the GBR did not exist 6000 years bp when water temps were higher then I may have to reconsider my argument.
That is not required by what Ove and commenters have said. Indeed, and I throw this out as a suggestion, you could read the part of the post titled: "Corals survived in past climates with warmer temps and higher CO2 than now, so shouldn't GBR survive now?" Just a suggestion you understand. -
Keith Hunter at 17:30 PM on 17 July 2011OA not OK part 2: Thermodynamic duo
Fritz: I have to say I agree with Doug. As a fellow author of this series of posts, I've sent him some comments. However, I'll add this: You say that if the local ion product equals or exceeds the solubility product of CaCO3 then solid CaCO3 spontaneously precipitates. Like you, I am a professor of physical chemistry, and both of us know that this statement, while true in a strict sense, does not mean what lay people think it means. What it actually means is that provided there is a facile mechanism for the reaction, there is no thermodynamic reason for the reaction to not proceed spontaneously. In fact, all marine chemists (and I am one) know that CaCO3 almost never spontaneously precipitates in the surface ocean because the mechanism is blocked, for kinetic reasons, by magnesium ions. Thus almost all surface waters in the ocean are supersaturated, i.e. NOT at equilibrium. For this reason, an equilibrium analysis of CaCO3 formation in the ocean is of purely academic interest and bears no relationship with reality. I respectfully suggest you consult any textbook on the thermodynamics of natural waters, of which there are many. I particularly recommen the fine book by Werner Stumm and James Morgan. I am sure you will find it an edifying read. -
Glenn Tamblyn at 17:04 PM on 17 July 2011Why Wasn't The Hottest Decade Hotter?
Just a bit of serendipity, wrt Chinese aerosols, and moving from the scienmce to something more anecdotal. My sunday paper today had an atricle about growing Chinese tourism to Australia, how they aren't all doing the packaged tour group thing. On man, a tour guide called Mr Zeng commented on what most strikes chinese tourists to Oz. 1. The space. That they can go to places where there are no people. That outside peak hour you can actually get a seat on any train or bus 2. How blue the sky is. It amazes them. Many young chinese have never seen a blue sky. For them, the sky is something that is always 'foggy'. I can speak from personal experience, having spent several years travelling in China on business, the air is always hazy or dirty in some way. Everywhere. You can fly from one end of the country to another and you will always see haze. When the Chinese are able to get their act together (and they will - the West underestimates the capacity of the Chinese at their peril) the change in warming could be very interesting. -
Rob Honeycutt at 16:21 PM on 17 July 20112010 - 2011: Earth's most extreme weather since 1816?
Norman... Have you tried reading the research that explains why the current consensus is that a warming planet will see more extreme weather? What I get from your thinking here is that you don't understand how this works. There is certainly a lot of published research out there about why this is believed to be correct, and why it is the generally accepted thinking. Rather than trying to test to see if anyone here can explain it for you why not allow the published literature explain it? I believe that is the accepted procedure if you're going to study a given phenomenon. Get a clear understanding of the state of the research, then ask questions. It strikes me as difficult to form an adequate thought experiment on a complex issue if you don't have a full grasp of the full body of research. I recently had a number of questions about the MWP and started collecting papers and reading them. It didn't take long to realize where the limits of my understanding were and my questions were answers only after reading a few papers. -
David Lewis at 16:13 PM on 17 July 2011Why Wasn't The Hottest Decade Hotter?
The way Kaufmann et.al. express themselves in their first paragraph indicates they are attempting to counter what deniers are saying about the period between 1998 and 2008. Deniers and non specialists taken in by them who are foaming over about that time period aren't debating fine points of how to come up with better and more accurate explanations other than the old standbys of natural variability and/or its something we don't know. The deniers are using this time period to question the entire thing - whether global warming is happening at all. Now if what you wanted to do was to counter ignorant arguments that a certain ten year trend "proves" whatever, you'd start by laying out what scientists are generally agreed upon, which I take it is the IPCC AR4 chart produced by the group led by Trenberth, which is why I posted it in comment #63. I.e. the shortest meaningful time period the global warming "signal" is held to be seen clearly was taken by the IPCC AR4 to be 25 years. Trenberth reaffirms this as of late 2010. Obviously, I, or far less likely, Trenberth, or even the IPCC AR4 which after all had a cutoff date for data many years ago now, might not have a clue. I would defer to Kaufmann et.al. on what a meaningful time period generally accepted by climatologists is. But they don't bring up what the IPCC says, or anyone else, and they do not say what they believe, except they have a theory they suggest throws some light on the period in question which they publish seeking comment and recognition for. Fine, but they aren't restricting themselves to discussion of how to throw some light on what people have had to call natural variability and/or something we don't understand in the past. Their paper was produced to address the deniers and their gibberish, as they explained in their first paragraph. Kaufmann et.al. address alternate explanations, i.e. for instance, they say they don't agree with Solomon et.al., i.e. Solomon's suggestion in Contributions of stratospheric water vapour to decadal changes in the rate of global warming. They are offering their own theory to explain, as you say, "short term variability". But I can't forget their introductory paragraph where they told me they did this research to explain why a period with start and end points chosen by deniers that is far shorter than the minimum the IPCC found was generally agreed to be a meaningful period to look at this signal actually has meaning they can explain. Why play on the denier's playing field according to their rules? Just because deniers are making a big deal out of one ten year period that they say contradicts everything climatologists have ever said or will say, why do Kaufmann et.al. have to try to explain that ten year period without even mentioning that by the way, the IPCC used 25 years as the minimum meaningful period? What Hansen did in Global Surface Temperature Change was bring up and dismiss the deniers. He wrote: "of course it is possible to find almost any trend for a limited period via judicious choice of start and end dates". Then he took on Solomon et.al, which he called a "more moderate assessment" of the period in question by comparison with denier gibberish. He quoted Solomon: "the trend in global surface temperature has been nearly flat since the late 1990s despite continuing increases in the forcing due to the sum of the well-mixed greenhouse gases". Then he immediately and directly contradicted Solomon et.al. with "[this] is not supported by our data." And then he explained his groups latest examination of the long term trend data: "On the contrary, we conclude that there has been no reduction in the global warming trend of 0.15-0.20 degrees C per decade that began in the late 1970s". If you are discussing short term variability, then make it clear. The deniers aren't discussing that topic. -
DLB at 15:46 PM on 17 July 2011Great Barrier Reef Part 3: Acidification, Warming, and Past Coral Survival
Tom C, of course I am aware of the sandy substrate Sth of Gladstone, there won't be much coral development there because of this reason. However 6000 year bp in Moreton Bay there was quite strong development of coral due to warmer temps and a metre higher sea level. Todays Mud Island in Moreton Bay is a former coral reef, it is only muddy because the Brisbane River estuary is now much closer due to lower sea levels and that water temps in the Bay are too cool. Although in some cleaner areas of the Bay like Peel Island, some coral does have a foothold. My point is not that The Reef will continue a march down the coast, but the coral of the Sth Barrier Reef will quickly be replaced by coral types from the Nth adapted to warmer water. If you can find some research that says the GBR did not exist 6000 years bp when water temps were higher then I may have to reconsider my argument. Doug M, I base my hypothesis on what I would consider is a normal curve distribution of a species along an environmental gradient. Could be a possible research project for someone. -
Chris G at 15:32 PM on 17 July 2011Citizen Science: Climatology for Everyone
Tom Curtis #2, A couple of thoughts: I think it might be useful to get some unbiased observers in the mix. Though, how to handle different ratings for the same site might be a good puzzle for Watts et al. IDK, maybe they've figured out a solution for that already. It would be ironic (and somewhat humorous to me) if the bias toward down-grading perfectly good stations (probably encouraged by a desire to find fault with the surface station record) had anything to do with Watts' failure to find a difference between poorly- and well-cited stations. If you throw a number of good stations in with the bad, it waters down whatever signal might be there because of siting quality. Dawei #8, I have to agree with that. -
Norman at 15:02 PM on 17 July 20112010 - 2011: Earth's most extreme weather since 1816?
Rob Honeycutt @ 333 I do use Google searches for information. I try to find high quality material and I adapt my choices based upon feedback to my posts. I try to use good scientific sources for my points. -
Norman at 15:00 PM on 17 July 20112010 - 2011: Earth's most extreme weather since 1816?
This is just a little thought experiment I conjured up to demonstrate the difficulty I have with the idea that reducing the temperature gradient between poles and equator will lead to more severe weather patterns in the future. It may not be a valid understanding of how CAPE works, it is an attempt to demonstrate my position. Note: This is a simplified version of CAPE and does not reflect the complexity of real world CAPE calculations. It is a conceptualization of a point that may or may not be valid. Source I used for simplified CAPE calculation. The thought experiment involves the setting off of a hydrogen bomb in the arctic ocean to generate a large parcel of warm air in a very cold region. Intitial Arctic Air I am using. -10 C at surface. I am using the stantard environmental lapse rate of -7 C/1000 m I am running the thought experiment from the ground up to 8000 meters. The moist air warmed by the hydrogen bomb is 25 C and I am using -6 C/1000 m as the moist adiabatic lapse rate. (not a real world situation and simplified to demonstrate a point). All data in equation: Surface Arctic air: -10 C (263 K) Arctic air at 8000 meters (-7 C/1000 m lapse rate): -66 C (207 K) H-Bomb surface air: 25 C (298 K) H-Bomb air at 8000 meters (-6 C/1000 m lapse rate): -23 C (250 K) [(298-263)/263+(250-207)/207]/2(9.8)(8000)=CAPE 13367.2 In the next calculation I will increase the polar temperature by 2 times the H-bomb temp. In this case I will not change the moist lapse rate but will in the next cycle. Now: Arctic Air: 0 C (10 C warmer) (273 K) Arctic Air at 8000 meters: (same lapse rate) -56 C (217 K) H-bomb air temp: 30 C (303 K) H-bomb air temp 8000 meters: -18 (255 K) [(303-273)/273+(255-217)/217]/2(9.8)(8000)=CAPE 11172.6 A considerable drop from the 13367.2 from above. Even though this is a simplistic calculation. The point I am trying to demonstrate with it is that as frontal systems in the US (low pressure) (which are supposed to get weaker with global warming as the horizontal temperture gradient is reduced...I have a link above on this) pull up warm moist air from the Gulf of Mexico and pull down cold Canadian air from the North, the cold north air will be less cold in the future relative to the warm gulf air. Side Note on what causes instability: "Causes of Instability • Cooling of the air aloft: –Winds bringing in colder air (cold advection) – Clouds (or the air) emitting IR radiation to space (radiational cooling) • Warming of the surface air: – Daytime solar heating of the surface –Winds bringing in warm air (warm advection) – Air moving over a warm surface" Source for above quote. I put in this note because in order for you to have an unstable atmophere you need a source of cold air. In the future that cold air will be relatively less than now when compared to the future warm air. On the next calculation I am going to change the warm air lapse rate since in the Trapp articles the claim is that the change in lapse rate because of the higher moisture content of future air will be enough to overcome the loss of vertical wind shear of future atmospheric conditions. Arctic Air. Still 0 C 8000 meter Arctic Air -56 (217 K) same lapse rate (but all indications suggest that the environmental lapse rate is going to change, become less as the globe warms) H-bomb air still 30 C Changed the lapse rate from -6 C/1000 m to -5 C/1000 m new temp at 8000 feet -10 C (reduced from -18 C above) or 263 K [(303-273)/273+(263-217)/217]/2(9.8)(8000)=CAPE 12617.8 At some point the change in the moist adiabatic rate will overcome the effect of having warmer polar temperatures. If I use -4 C/1000 m the CAPE value in the above equation will exceed the 13367.2. In this situation you get CAPE of 14061. At this time I do not see an obvious pattern that would easily demonstrate that weather will get more severe in the future with ongoing Global Warming. It might happen but it may not. I would think it would more closely mimic the tropical type weather patterns. More rain, less severe weather. Again, my major point is that as the system approaches equilibrium (the gradient between the opposites is reduced, be it gravity, heat, chemicals) the intensity of reactions goes down not up. I may be very wrong in my thinking but it would be nice for someone to point out the flaw. -
Tom Curtis at 14:29 PM on 17 July 20112010 - 2011: Earth's most extreme weather since 1816?
Norman @355: 1) Global warming has increased the level of the tropopause. That means as air rises in thermals, it is given a gains a stronger Easterly (blowing to the west) component due to angular momentum. The air is then carried north or south, and when it returns to Earth gains a stronger Westerly (blowing to the east) component for the same reason. 2) The Hadley cells have expanded with global warming meaning surface winds from air returning towards the Inter Tropical Convergence Zone have a stronger Easterly component due to angular momentum. 3) The atmosphere has a greater moisture content because it is warmer,and hence rises faster in thermals, thus drawing wind in faster at the base, creating stronger local winds. 4) The land is heating faster than the sea, resulting in stronger onshore winds. 5) As has been explained above, the greatest temperature differential between poles and tropics is in the winter, and the least in the summer. Warmer weather can trigger storms earlier in the year when the differential is greater. This may be partly or completely compensated for by differential heating between pole and tropics, but there can be no automatic assumption that it will be. 6) And most importantly, this general reasoning readily provided reasons to expect stronger and/or more frequent storms with global warming. Other considerations give reasons to expect less (perhaps). But general arguments like this and like yours cannot be used to make predictions. They are so vague that they cannot even definitively narrow down the sign of the predicted effect. (Actually, I think they strongly indicate stronger storms, but the reasoning is not conclusive.) To do that you need to do the mathematics, which in climate science means run the models. The models have been run and show consistently that situations favourable to storm formation will be more frequent. -
Doug Mackie at 14:25 PM on 17 July 2011OA not OK part 2: Thermodynamic duo
Fritz, I am sorry to say that you are wrong. We have mostly written a detailed discussion of you 'seawater equilibria' post and the 'cb with buffering' document. I expect to send it to you early in the week. -
Norman at 14:06 PM on 17 July 20112010 - 2011: Earth's most extreme weather since 1816?
Rob Honeycutt @ 333 I still do not believe anyone has actually demonstrated why my reasoning is flawed or incorrect. It may well be as Albatross has pointed out. It is a postition that is based upon physics, however, so I would need a good reasoned response of why my thinking is not correct. Point. Hypothetically if all the Earth was warmed equally then the Earth would be mostly weatherless. It is the temperature gradient (both horizontal and vertical) that creates the pressure differences that drive weather and climate patterns. The AGW theory has the poles warming faster than the poles (in all the graphs it looks to be about twice as much).... Page 15 of this IPCC report shows the projected Global warming of various models. This pattern would lead the world closer to the weatherless system than the oppostite direction. So why would weather patterns intensify? In a two body system, it is not the temperature of a body that determines rate of heat flow, it is the difference between the two bodies. In the atmosphere, it is not the temperature of the tropics that determines wind intensity, it is the difference between tropics and poles. The gradient. How about two mountain river and turbulence? One river goes straight down the mountain with a large gradient difference between points on the vertical. The other winds around the mountain with very shallow gradients. Which of the two rivers will have more turbulence even though the overall graviational energy is the same. With Poles warming twice as fast as the equator it seems the push would be away from severity and turbulence and a push to less extremes. At least that is what my thinking sees it. I might be wrong, that is not the point. At this time I do not understand the flaw of my reasoning and would hope someone would point it out. -
Tom Curtis at 14:06 PM on 17 July 2011Carter Confusion #3: Surface Temperature Record Cherries
Camburn, it is not Tamino's analysis per se. It is Carter who ended his first false "trend line" in with the Dec 1996 datum, and started his second false "trend line" with the January 1999 datum. In order to analyze what Carter had done, Tamino had to do the same thing, only with real trend lines. Consequently your implied suggestion that Tamino was cherry picking is unwarranted. What is more, Tamino has already adressed the issue several times. Most recently he addressed it yesterday in discussing Steve Goddard's cherry pick of almost exactly the graph you cherry picked (he terminated his before the recent rises in global temperature since March). Before that he addressed it in "How fast is the Earth warming". And if you think I have been vitriolic, try posting that Tamino's analysis of Carter is correct, and that Carter is a "" on WUWT. -
Camburn at 13:48 PM on 17 July 2011Carter Confusion #3: Surface Temperature Record Cherries
Tom: I included the forgotten year in Tamino's analysis. As I said, I also did it to present confirmation of the UAH data with a short term graphic. I know you didn't like the results of the graph, so be it. I added one year to tamino's analysis. The main thing is that Tamino's analysis is mostly correct. There are trend change issues which will be addressed in the future. Mr. Carter's analysis is....appropriate word that won't get snipped.......showing a lack of basic knowledge of most everything. So old chap......keep plugging but learn to be a bit less vitriol. It will serve you well in life.Response:[DB] Overlooking the innuendo and lack of patience issues, you display much hubris in thinking to show Tamino "the error of his ways".
Trend changes in climate science do not mirror those in grain futures and commodities where the market can be swayed by human perception and emotion. Climate changes due to changes in forcings. Increased understanding of those forcings and the physical processes underlying those forcings allows climate scientists to better predict future changes. Without a physical process to attribute a change to, speculation on a graph "not looking right" is climastrology.
Tamino has previously studied trend changes here:
http://tamino.wordpress.com/2010/08/13/changes/
If you want to play Grasshopper to Tamino's Master Po, feel free to do it on his blog.
Prev 1573 1574 1575 1576 1577 1578 1579 1580 1581 1582 1583 1584 1585 1586 1587 1588 Next


