


 Arguments


Recent Comments
Prev 1604 1605 1606 1607 1608 1609 1610 1611 1612 1613 1614 1615 1616 1617 1618 1619 Next
Comments 80551 to 80600:
-
dana1981 at 01:49 AM on 19 July 2011Lessons from Past Climate Predictions: Wallace Broecker
Thanks Lou. Agreed, I had no idea Broecker had even made this prediction, let alone its impressive accuracy, until Ari pointed me towards the paper. -
Dikran Marsupial at 01:37 AM on 19 July 2011It's the sun
Eric (skeptic) In comparing the lag of decades for CO2 and months for the 11 year solar cycle you appear to be confusing "equilibrium" and "instantaneous" responses of the climate. Think of the thermal inertia of the oceans as acting like a damper in a car suspension system; if you increase the weight of the car, it will slowly sink on its suspension at a rate depending on the damping. If you put a 100kg weight in the car, it doesn't immediately sink an inch, it takes a fraction of a second. If you fit stiffer dampers, it will take longer. So there is an "equilibrium" response of the suspension that is larger than the "immediate response" (it starts settling immediately, but it takes time to get to its equilibrium position). Now consider what happens if you drive down a cobbled street (i.e. a cyclic forcing), the damper then will attenuate the oscillation in ride height, and you will find there will be lag introduced in the ride height relative to the road surface, but there is no "equilibrium response" as the cobbles don't change the equilibrium ride height. -
Rob Honeycutt at 01:04 AM on 19 July 2011Monckton at odds with the very scientists he cites
Tom... It's actually quite humorous, the whole thing. The House of Lords is essentially saying there is no such thing as a "non-voting member" of the HoL, which is what Monckton claims he is. Basically he just wants to have his cake and eat it too. What's not humorous is the extremist rhetoric he's using in his lectures this time around. He may have been called out on the whole swastika thing but he continues to call for climate scientists to be jailed and saying that the media are fascist. He's an all 'round bad seed. -
Tom Curtis at 00:58 AM on 19 July 2011It's the sun
Eric (skeptic) @875, first, I think there may be a difference in definition. Specifically, when talking about thermal lag for CO2, we are talking about the period of time to reach 60% (or there about) of the equilibrium response. When we talk about thermal lag for seasonal temperature changes, we are talking instead about the time difference between the peak (minimum) insolation and the peak (minimum) temperature response. That is because the oscillating insolation does not leave enough time for 60% of the equilibrium response to be reached. Rather, the insolation falls below the equilibrium level of the current temperature long before it reaches that point. The same is certainly true for the solar cycle, and probably true for changes in TSI over the 20th century in general, which first fell, than rose to about 1950, then fell again, then rose almost as far, and then fell gradually. Consequently thermal lag for insolation probably measures the period to peak measurable response rather than the period to a certain percentage of equilibrium response as with CO2. The difference is not because of the different source of forcing, but because the CO2 forcing is increasing monotonically (note: CO2 forcing, not total or total anthropogenic forcing). Second, the level of the forcing for changes in TSI and especially for the solar cycle are not large, and certainly not nearly the same size as the CO2 forcing. Remember that the greatest change in TSI in the twentieth century (from 1910 to 1950) accounted for approximately a third of a slower warming than that at the end of the twentieth century which can be attributed exclusively to CO2 (but only in that the other factors canceled out). Consequently the peak solar forcing is at most a third of the peak CO2 forcing in the twentieth century, which means the resulting decadal temperature change from solar alone is not greatly different from the annual variation in mean global temperature. If the temperature is rising then falling due to an oscillating forcing, it will approximate to a sine wave. It will first rise slowly, then quite rapidly, and then slow down again. For a weak forcing, it is probable that only the change in temperature during the rapid rise will be statistically detectable, particularly if the forcing is very weak (solar cycle) or there are only one or two examples to test against (major TSI changes). Consequently the end of the peak measurable change of temperature will coincide with the end of that rapid rise rather than the actual peak which will be obscured by year to year temperature variations. Third, and particularly for the the solar cycle, because annual temperature fluctuations are large compared to those induced by the solar cycle, it is probable that after a short period of time a random fluctuation will bring the temperature up to the peak response point. From that point the higher (or lower) insolation will be acting to dampen departures from that temperature rather than lifting (or lowering) the temperature to that point. And as we have established, there is no thermal lag for that. Consequently the two month lag (which I and, more importantly as he has reasonable claim to expertise in this area, Tamino find surprising) may just be the average period until a random fluctuation shifts the temperature towards the effective equilibrium temperature. My point is not that any of these factors is shortening the "thermal lag" period for TSI variations including the solar cycle. It is that there are good reasons to expect weak, and fluctuating forcings to exhibit a reduced lag response both because their full response is never exhibited due to lack of time, and because noise can swamp out the more subtle parts of the signal. I do not suppose these are the only ways that can happen, and nor can I claim to know how much each factor is relevant in particular cases. But I do know that the difference between the thermal lag duration for CO2 and solar forcings is a function of characteristics of those forcings, not special pleading. -
Tom Curtis at 00:21 AM on 19 July 2011Monckton at odds with the very scientists he cites
Bernard J @21, Monckton has already been publicly confronted with that statement. His response is that the Houses of Parliament, even with Royal assent, are not capable of depriving him of his membership in the House of Lords. As the Houses of Parliament, with or without Royal Assent, can depose the sitting Monarch, I don't see what is so special about Viscounts. -
Bernard J. at 23:42 PM on 18 July 2011Monckton at odds with the very scientists he cites
A little aside about Monckton, hot off the press...Climate sceptic Lord Monckton told he's not member of House of Lords Clerk of parliaments publishes letter on Lords' site saying peer is not and has 'never been a member of the House of Lords'
I can't wait to hear of Monckton's response to being firmly told by the Lords to cease and desist. -
Lou Grinzo at 23:40 PM on 18 July 2011Lessons from Past Climate Predictions: Wallace Broecker
Excellent post. I'm glad to see Broecker get a little attention for his outstanding work -- he's been seriously overlooked in discussions, even among the climate geeks, for far too long. -
Rob Painting at 23:32 PM on 18 July 2011Sea level rise is exaggerated
Steve Case - "Your actual observations link was a link to method, not data" Now Steve that's being a little bit silly. Data is useless without analysis. I'm sure you know this. The point was that your simplistic calculations bore no to relationship to reality. "So, is it reasonable or is it an exaggeration to project that the thermal component of sea level rise by 2100 might be over ten to nearly 20 times what it is today?" Well climate modelling sure suggests an increase in the thermal component. It's to do with the greater temperature rise expected this century. Much more than the 20th century. Like this study for instance: Note the inset portion, where the thermal component reaches 6mm per year by 2100.
-
Eric (skeptic) at 23:11 PM on 18 July 2011It's the sun
Tom (874), that is interesting, but seems like an odd dichotomy. Lag of decades for CO2, lag of a decade for a similarly large change in solar output, but only 2 months for the small solar cycle TSI change. I think the answer is in your #3, that there is no lag for solar TSI cooling as you explain, but a lag for every type of warming no matter what the source (essentially the ocean absorbing the extra warmth). That seems consistent with the statement: "we should see a slowing of warming with the solar minimum" although not necessarily cooling. Your logic for why we should see that "slowing of warming" right away seems very sound, so I believe I was wrong about implying a "lag for cooling" up thread. -
Ken Lambert at 23:07 PM on 18 July 2011Trenberth on Tracking Earth’s energy: A key to climate variability and change
"Ken, the (rather obvious) flaw in your 'logic' is that Trenberth, Hansen, and virtually everyone else in the field, are completely agreed on the existence of a growing warming imbalance. If you increase atmospheric CO2 you create a warming imbalance." Where is the evidence that the warming imbalance is 'growing'? Hansen accepts that the warming imbalance has 'reduced' from 0.9W/sq.m to 0.59W/sq.m, and is trying to explain it with extra aerosols and 'delayed Pinitubo rebound effects' etc. Trenberth is not accepting that the warming imbalance has reduced (except for the 11 year solar ripple) and is still looking for the missing heat in the oceans - deep oceans. So your assertion that: "Trenberth, Hansen, and virtually everyone else in the field, are completely agreed on the existence of a growing warming imbalance." is incorrect. -
Dikran Marsupial at 22:59 PM on 18 July 2011Lessons from Past Climate Predictions: Wallace Broecker
Arkadiusz Semczyszak Please can you provide a link to that graphic in its original context, so that we can see that the uncertainties you mention are actually relevant to Broecker's projection. -
michael sweet at 22:19 PM on 18 July 2011Lessons from Past Climate Predictions: Wallace Broecker
Arkadiusz, Thank you for your demonstration of the hypocrisy of "skeptic" arguments. The proper place to put a projection is starting at the time it was made (1975) and going into the future, as the graphs above show clearly. Dr. Broecker's accurate projections of future temperatures demonstrates that his model has skill. If you have a problem with his skill demonstration please provide data that supports your objections. Random criticism of someone who was correct does not add to the conversation. -
Eric the Red at 22:08 PM on 18 July 20112010 - 2011: Earth's most extreme weather since 1816?
Norman and Tom, Much of the argument comes down to the amount of moisture in the air vs. the wind shear as the dominant force in severe storms. There are several other valid poinnts put force regarding Hadley cells and temperature gradients. I have followed the links, and understand (mostly) the conclusions drawn from the various works. From all that I have gathered, this is still an unresolved issue. As stated earlier, I believe that the winds shear will predominant, and will decrease due to the decreasing temperature gradient (among other things). I could be wrong, and either the moisture content in the warmer air, or the changing Hadley cells will result in greater storm formation. Yes Norman, I find this subject quite interesting and would like to continue involvement. Tom, even though we disagree, I find your arguments and resources quite informative, both here and elsewhere. -
Tom Curtis at 21:59 PM on 18 July 20112010 - 2011: Earth's most extreme weather since 1816?
So your "model" is that the Arctic air starts being cold and saturated, and when it moves to the mid west it is still saturated because in the Amercian Spring, it is still at winter Arctic temperatures? Because if it isn't, your defence of your position is not valid. And if it is, your position has refuted itself by absurdity. -
Arkadiusz Semczyszak at 21:52 PM on 18 July 2011Lessons from Past Climate Predictions: Wallace Broecker
... if we go back to “old” papers, you should remember about these uncertainties. They are still current ... -
Tom Curtis at 21:46 PM on 18 July 2011The chief troupier: the follies of Mr Monckton
Sphaerica @27, your sympathy for Jo Nova is entirely misplaced. She is sharing the platform with Monckton on his tour. She cannot be in any doubt as to the nature of the beast she is lying down with now. -
Tom Curtis at 21:41 PM on 18 July 2011The chief troupier: the follies of Mr Monckton
From the ABC's "Background Briefing" we have more of Monckton's enlightening views from a speech in Hyde Park, Sydney last week:"What we have here is naked left-wing political interference in the right of somebody who was invited to your country to speak freely at various venues all round the country. Now when you get that sort of behavior, let us remember where that sort of behavior last happened. It happened in the 1930's in central and western Europe in a country called Germany. That kind of breaking up of meetings, silencing of opponents for prevention of free speech, that is a hallmark of - and I am proud to use the word loud and clear - Fascism! And that is what your ABC now represents!"
Just in case you didn't get that, the ABC now represents Fascism, at least according to Monckton. But the real concern is his dedicated concern for the free speech of scientists, shown when he declares:"So to the bogus scientists who have produced the bogus science that invented this bogus scare I say, we are coming after you, we are going to prosecute you and we are going to lock you up!"
This in a nation in which it is currently in the news that scientists are being subject to death threats. Such death threats are of course, not to be considered as representing a fascist point of view, and certainly threats of a show trial and incarceration for scientists doing their job. Finally, for those who think Lord Monckton is such a sincere person, we have this comment on his apology to Ross Garnaut:"I apologized because even the slightest suggestion that one of his opinions is a Fascist opinion is these days regarded as intolerable in circles other than the particular circle to which I addressed it; and it shouldn't have got out from there, but somehow it did."
So the offensive thing about his remarks, in the opinion of Monckton, was not the content of the remarks, but that they became known outside of the intended target audience. In his twisted mind, apologizing for his slanders becoming know, rather than for the slander itself is "sincere". (H/T to the Skeptical Science facebook page) -
Arkadiusz Semczyszak at 21:38 PM on 18 July 2011OA not OK part 6: Always take the weathering
I hope that in the next post will discuss the formation of ooliths (= ooids) ... -
CBDunkerson at 21:30 PM on 18 July 2011Websites for Watching the Arctic Sea Ice Melt
BTW, the July 'SEARCH' predictions have been released. As you'd expect, they've generally been adjusted downwards from the June predictions. -
Norman at 20:56 PM on 18 July 20112010 - 2011: Earth's most extreme weather since 1816?
Tom Curtis @ 342 3) for the Arctic air lapse rate. I thought it would be the dry adiabatic. But looking around for an actual number I don't think it is. Here is an actual lapse rate from Fairbanks Alaska in December. The explanation in reading is that Polar Arctic air starts as Polar Maratime air which is at the moist adiabatic. The air near the surface cools rapidly but the upper levels retain their original lapse rates and the air is very stable (warmer above colder below). Artic air lapse rate from Fairbanks Alaska. -
CBDunkerson at 20:43 PM on 18 July 2011Trenberth on Tracking Earth’s energy: A key to climate variability and change
Ken, the (rather obvious) flaw in your 'logic' is that Trenberth, Hansen, and virtually everyone else in the field, are completely agreed on the existence of a growing warming imbalance. If you increase atmospheric CO2 you create a warming imbalance. Not exactly a contentious point. Further, you suggest that Hansen's position would lead to a different conclusion on the need for a carbon tax... yet Hansen himself has said otherwise. In short, you are employing tactics which have been documented repeatedly on this site... misrepresenting both the nature and the implications of Hansen's work. Whether Hansen or Trenberth is correct about the role aerosols play in the overall energy budget is completely irrelevant to the role that carbon emissions play... on which they (and virtually everyone else) are agreed. -
Steve Case at 20:26 PM on 18 July 2011Sea level rise is exaggerated
Rob Painting - The Question I have asks if it's reasonable to project a 6.8 mm/yr thermal component to sea level rise by 2100. Adding in that leftover third and something less than a half for the salinity portion of steric rise won't change the overall gap between the current assessment in the Executive summary and the projection in table 10.7 by very much. Your actual observations link was a link to method, not data. So, is it reasonable or is it an exaggeration to project that the thermal component of sea level rise by 2100 might be over ten to nearly 20 times what it is today? -
Keith Hunter at 20:13 PM on 18 July 2011OA not OK part 6: Always take the weathering
Patrick 027 is quite correct to point out the importance of silicate weathering. In this post we were trying to focus on the CaCO3 cycle as a simplification. But Patrick is quite correct in pointing out anomalies in which weathering loss off CO2 is balanced by volcanic emissions. However these do not substantially change the picture we have painted. Also, we will deall with this in a future post. -
Albatross at 14:39 PM on 18 July 2011Citizen Science: Climatology for Everyone
dhogaza @21, "Is this any surprise ??? " Sadly, no it is not. -
Ken Lambert at 14:36 PM on 18 July 2011Trenberth on Tracking Earth’s energy: A key to climate variability and change
David Lewis #53 I am surprised that there was no follow up comments on this quotation: quote "He warns, again, that aerosols are still so poorly understood he’s on as sound ground about their effect in models as any scientist, if he asks his grandchildren what number he should use to represent their overall net effect. He displays a picture of the very knowledgeable grandchildren he claims he consulted as he prepared his input to the IPCC AR4 in the above screenshot. He commented on this grandchildren joke (which he also presented in his Bjerknes lecture at the AGU) at around the 8:20 mark saying: “Now if that doesn’t seem like very good scientific method, you should see what the other guys do”. endquote Making a joke about the putative imbalance (albeit via a very intelligent looking infant) might not be so funny for those grappling with understanding the uncertainties in AGW science. That Drs Trenberth and Hansen - two of the leading scientists in this field have a disagreement about a basic tenet of AGW - a growing warming imbalance - is nothing to laugh about. Vicious political battles are now being fought in Australia over a $23/tonne carbon tax right now. [ snipped ] -
dhogaza at 14:29 PM on 18 July 2011Citizen Science: Climatology for Everyone
" I have been to Oconto, Wisconsin, many times. Let me assure you that there is nothing in the town remotely urban" Where are your photos? That's where science lies, apparently ... "Albatross, according to Fall et al 2011, final decision on classification rested with Anthony Watts and Evan Jones" [ snipped ] Speaking as a very active citizen scientist actually working on *scientific* data gathering for decades (http://birdnotes.net being an extremely *minor* aspect of that(. -
Tom Curtis at 14:27 PM on 18 July 2011Citizen Science: Climatology for Everyone
Thanks for the comment, DB. I just checked my first link, and it takes you to the town rather than the surface station (for which I had searched). To find the surface station, follow route 22 west out of the town. The surface station is at Radio Woco, just south of the road before you come to the cross section with Cream City Road. Betty's Bar and the Oconto Town Office are located at the cross section.Response:[DB] By no means, Tom, was I giving criticism to you on your example, as I share your concerns for the surfacestations project. Since your example was from an area of personal knowledge (I have driven past that station many dozens of times [and past Betty's Bar as well]) I felt compelled to comment.
Here's a map link directly to the station. Very rural, mostly cropland. Primarily corn, beans and wheat. Winds predominantly from the west; if the station is on the west side of the complex, then it is not possible, unless it were within 2 meters of the building (to catch reflected solar radiation coming off the building in the afternoon sun) for their to be any upwards temperature bias due to siting. In this climate, it is the southern exposure that receives the biggest increase from building reflected solar radiation (my flowers on the south side always start coming up weeks before those on the west or east sides), but even then, 3 meters would be sufficient separation.
-
dhogaza at 14:22 PM on 18 July 2011Citizen Science: Climatology for Everyone
"Yet to this day, there are people at WUWT and in the blogosphere who question the veracity of the global surface temperature record. Mission accomplished for Mr. Watts." Given that Watts has insinuated that even in the face of the publication of et al + Watts (not "Watts et al" as previously stated by the defenders of the project) that he believes the data, further analyzed, will still show insurmountable problems with the instrumental records ... Is this any surprise ??? -
Albatross at 13:43 PM on 18 July 2011Sea level rise is exaggerated
KR @137, I concur. DB @135, Thank you. -
KR at 13:04 PM on 18 July 2011Sea level rise is exaggerated
Camburn Your data and examples are so very clearly cherry-picked that I find it increasing difficult to consider this an error. I rather hate to say it, but I've come to the conclusion that you are deliberately distorting the data to make your point - that you are trolling. Unless you significantly improve the quality of your posts, I see no reason to take them seriously. -
Ken Lambert at 12:49 PM on 18 July 2011Trenberth on Tracking Earth’s energy: A key to climate variability and change
guinganbresil #61 "Just because the emission to space at the CO2 band of the spectrum (left hand side of figure below at ~600-700 cm-1) goes down does not mean the the total emission to space goes down." I can't follow what point you are making here. My concern is how the 1.0W/sq.m imbalamce is derived from the absolute values from the satellites. The correction on the CERES in 2009 was from +6.4 down to +0.9W/sq.m I would like to hear from anyone knowledgeable on the topic how the corrections were made for the Fig 3 charts. -
Tom Curtis at 12:38 PM on 18 July 2011Citizen Science: Climatology for Everyone
Albatross, according to Fall et al 2011, final decision on classification rested with Anthony Watts and Evan Jones. Beyond that, ratings where made by teams of two people drawn from an unspecified pool, although presumably closely associated with Watts. -
Rob Painting at 12:34 PM on 18 July 2011Sea level rise is exaggerated
Steve Case- And that glaringly obvious one is? The global ocean is a lot deeper than 700 mtrs. The executive summary in the IPCC document you cited says: "The oceans are warming. Over the period 1961 to 2003, global ocean temperature has risen by 0.10°C from the surface to a depth of 700 m. Consistent with the Third Assessment Report (TAR), global ocean heat content (0–3,000 m) has increased during the same period, equivalent to absorbing energy at a rate of 0.21 ± 0.04 W m–2 globally averaged over the Earth’s surface. Two-thirds of this energy is absorbed between the surface and a depth of 700 m" What do you think happens to that leftover third? And regardless it doesn't explain the discrepancy between your calculations and actual observations. -
Tom Curtis at 12:20 PM on 18 July 2011Citizen Science: Climatology for Everyone
Dawai @8, the NCDC may well have expressed appreciation for the project, but that does not in any way counter its flaws. To give an idea of the futility of the program, consider Oconto Wisconsen, whose surface station receives a rating of 4 by the project. Apparently that rating is based on a single google earth arial photo:As you can see, they have carefully measured the distance from the surface station to the nearest heat source as 7.69 meters, and according to the USHCN, any station within 10 meters of a heat source deserves a rating of 4, so no problems. Right? Except that if you look closely the spot they measure to is just another patch of lawn, and is itself at least one meter from any different surface, and several meters from the nearby building (the local heat source). Looking at the photo, one corner of the building might by withing 10 meters of the surface station, or it might not. It's hard to tell because of the obscuring vegetation. There are two key points here. The information available is simply not adequate to make the determination between rating 4 and rating 3. That they went ahead and classified it as rating 4 indicates bias (as if that was not already well established by the Oodnadatta example). Second, the classification as a rating 4 is a poor predictor of station performance. In order for the surface stations program to be genuinely useful, both of those points would have to be false. In fact, I believe the primary purpose of surfacestations.org is simple salesmanship. They several times indicate that what they are doing as volunteers should have been done by the scientists despite the fact that: a) The scientists had been doing things to correct for station quality for seven years before A Watts got involved; and b) The surfacestations style classification is very time consuming, and scientists are not that numerous nor have that much free time. But in addition to selling false messages about poor temperature records and negligent scientists, surfacestations.org follows the oldest sales technique going - get the product into the customers hands. Once you do you change the psychology from one of do I want to get this thing, to do I want to give it up. In this case, by enlisting volunteers they sell the message that their classification and their conclusions from that classification are actually the product of their army of volunteers. That message is in fact false, but it certainly contributes to their success in PR. So, I wouldn't touch Surfacestations.org with a barge pole. Of course, it is your post and your call as to what you recommend.
Response:[DB] I have been to Oconto, Wisconsin, many times. Let me assure you that there is nothing in the town remotely urban. The open fields surrounding the station will do nothing to keep the winds sweeping down out of Canada from dispersing any heat from the nearby building.
-
Camburn at 12:05 PM on 18 July 2011Sea level rise is exaggerated
Albatross: My memory was wrong in that it is 1.02MM/yr. as DB shows. Take a look at the coverage of Envisat does, verses the other satillites. Envisat is suppose to be the widest coverage. This is all the data from this satillite as this is the age of this satillite. The thing to watch in the long run being it has better coverage of the globe is to see if a divergence develops. I presented what it shows. I wanted to show them all. You will see that early it showed an increased rate of rise, and now it shows more of a decreased rate in rise. Are those slight divergences because of the coverage above 70 degrees? This thread is about sea level rise...right? And one has to look at all the data available....right?Response:[DB] "This thread is about sea level rise...right? And one has to look at all the data available....right?"
Excellent point. One in which the entire thrust of your point is lacking in. So, let's look at ALL of the data, shall we? You mean like this, right?

Or this, right?

Or this, right?

Or this, right?

Multiple sources, using the all of the data available, rightly show the long term trend is far worse than your dissembling, cherry-picked case.
-
Albatross at 11:59 AM on 18 July 2011Citizen Science: Climatology for Everyone
Tom, Fair points. But who was on the "organizing team"? Did it include Watts and/or Pielke? Also, how do we know the photos fairly reflect the station's position/exposure etc? The old adage that photos do not lie no longer applies I'm afraid. I think it would be naive to assume that people participating in the project were wholly unbiased. The entire premise of the project was to try and "destroy" the reputation of the surface temperature record. Again, in principle it was a good idea. In principle. -
Tom Curtis at 11:53 AM on 18 July 2011Citizen Science: Climatology for Everyone
Albatross @14, thanks for the link to the video. The back story on its publication is also interesting. My criticism of the inclusion of SurfaceStations.org has received some criticism, and some support. Some of the criticism is, however, based on a false premise. Specifically it is assumed that the involvement of unbiased reporters will lift the standard of classification in the scheme. That is not so. Volunteers are asked to photograph sites, to take some basic measurements. They are not asked to rate the stations, which is done by the organizing team. Hence participation by non-biased observers is unlikely to improve the results of the project. -
Albatross at 11:34 AM on 18 July 2011Sea level rise is exaggerated
Camburn, I am well aware of what you said. You continue to be incredibly disingenuous. You are cherry picking a satellite dataset that only starts in 2004. There are multiple satellite datasets going back to circa 1993, yet you choose one dataset that presents the answer that you want, and then present a trend that is probably not statistically significant give the limited time window. -
Doug Mackie at 11:32 AM on 18 July 2011OA not OK part 2: Thermodynamic duo
The utility of a model like yours which does not represent reality escapes us. The crux of your argument appears to be that the ocean is permanently in equilibrium with both atmospheric CO2 and oceanic CaCO3. Neither of these is true. This has been very well researched; in a comment to your original 'seawater equilibria' post you mentioned you got some values from one of Frank Millero's papers. I take it that his values differed from the ones you calculated? What do you think accounts for the difference? We strongly suggest you read a few of Millero's books. Also, Chapter 5 of the CDIAC (Carbon Dioxide Information Analysis Centre – a part of the DOE) book The Analysis of Carbon Dioxide Parameters in Seawater provides a comprehensive view. Available here (The book has been updated since 1994, I think the new 2007 version is at the EPOCA site (European Project on OCean Acidification). More recently, the SCOR (International Council for Science: Scientific Committee on Ocean Research) publication 127: Thermodynamics and Equation of Seawater, available here may also be useful. This page in turn links to the home page of the Thermodynamic Equation of Seawater v10 (TEOS) at here. As you can see, the issue has been very well studied for many years by many physical chemists. Their conclusions differ from yours. Here are a few points to consider: 1. You calculate the total molality of CO2 in seawater at pH 8 and at 15oC as 1650 umol/kg. Why not take 5 minutes to google up what the measured values are? (KH's research group has been collecting such data for 15 years). 2. The spontaneity of eq. 1 or its reverse depends on the chemical conditions. To suggest that when eq. 1 is spontaneous it leads to a decrease in atmospheric CO2 is the same as saying that the reverse, when spontaneous, (weathering of limestone by CO2) causes an increase. Both are obviously wrong as either would make these supposed equilibria unstable. Equilibria are not unstable, by definition. 3. CaCO3 is a base. If it precipitates spontaneously from seawater, then the latter must become more acidic, just as it gets more alkaline when a base dissolves. If you make seawater more acidic, bicarbonate converts to carbonic acid, which will increase the CO2 of an atmosphere previously in equilibrium (exactly as eq. 1 describes). 4. It is not possible to write a balanced chemical equation that converts CO2 to CaCO3 that does not generate unreacted H+ or its chemical equivalent on the RHS of the equation. Reason: you have to put the 2+ charge of the Ca2+ ion somewhere to maintain charge balance. 2, 3, and 4 are essentially equivalent arguments. No thermodynamics is needed. It is elementary stoichiometry (Daltons laws) and acid-base chemistry (Lowry-Bronsted & Lewis). 5. In the document CB with buffering you have used a Henry's law constant at 15oC of 22.1. However, this is the value for the transfer of CO2 in air into freshwater. In seawater at 15oC KH = 26.7. (See: Weiss 1974, Carbon dioxide in water and seawater: the solubility of a non-ideal gas. Marine Chemistry 2, 203-215). We suggest that once a simple model like yours diverges from reality by as much as 20% then the utility of the simple model should be questioned. Similarly, some of your other calculated values differ from reality. -
Camburn at 11:18 AM on 18 July 2011Sea level rise is exaggerated
Albatross: Note I said Envisat. Multiple sat observations of sea levelResponse:[DB] You continue to be disingenuous with your graph. Envisat data is actually shown here:

[Source]
-
Camburn at 11:01 AM on 18 July 2011Sea level rise is exaggerated
Steve: The transition from XBT data to ARGO data showed a huge step rise in OHC. We know because of instrument splicing, changes in models etc that XBT data had huge error bars. The results to date of ARGO data would indicate that the XBT data had a strong negative bias in measurement. With that in mind, and the fact that co2, because of its emissions spectra does not penetrate beyond the skin of the ocean. the idea of a 6.8 mm/yr thermosteric rise in sea level to 2100 is virtually impossible. -
Tom Curtis at 10:21 AM on 18 July 20112010 - 2011: Earth's most extreme weather since 1816?
Norman @341: 1) If a spinning body extends its radius, it will slow down the spinning body. Consequently, the raising of the tropopause does indeed slow down the Earth by some imperceptibly small amount. (Or perhaps no imperceptible, they measure the length of the day very accurately these days.) But in extending the radius, the angular velocity of the outermost portion of the rotating body becomes greater. 2) You repeatedly assert that the models do not allow for a changing environmental lapse rate. That is false. Rather, they do not program the change in lapse rate in to the model, but allow the physics to sort it out. 3) (And this relates primarily to your 337) you assume that the environmental lapse rate for a body of dry air from the arctic will be close to that for 100% humidity (6.5). In fact it would be much closer to the dry adiabatic lapse rate of 9.8. This relates to one of your most bizzare assumptions, ie, that the environmental lapse rate is almost identical everywhere. The environmental lapse rate depends on a large number of local features of the atmosphere, but most importantly on the relative humidity. If a body of saturated air moves south from the Arctic and warms from 0 degrees to 10 degrees C, it will no longer be saturated, and hence its lapse rate (all else being equal) will increase substantially. The same thing will happen if it moves south and goes from 5 degrees to 15 degrees C. Now look at the holding capacity of water vapour in air at different temperatures: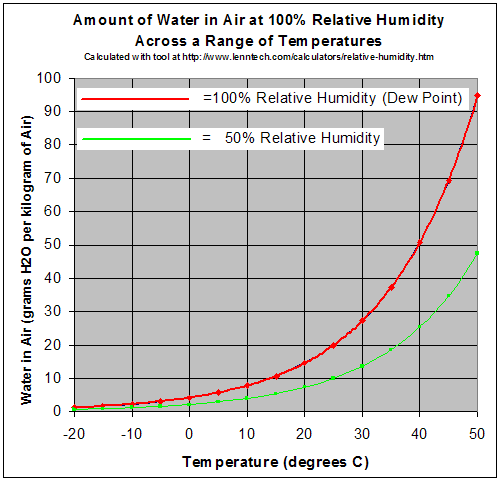 As you can see, an increase in temperature from 0 to 10 degrees C increases the holding capacity by about 5 grams per Kg of air. An increase from 30 to 35 degrees increases the holding capacity by nearly 10 grams. Half the temperature increase and nearly double the holding capacity increase.
There seems to be absolutely no understanding of this difference in your models. In contrast the meteorological models that tell us CAPE will increase have this built in to their physics.
3) Which brings us back to models, and you complete misunderstanding of what it means for a climate model to be accurate.
Consider a double pendulum. It's state at any moment can be completely described by seven, numbers three of which are invariant. The three invariant numbers are the length of the two pendulums, and the distance from the axis at with the second pendulum is attached to the first. The variable numbers are the angle of the main pendulum arm from the vertical, the angle of the second pendulum arm to the main pendulum arm, and the angular momentum of each bob.
Given the exact specification of each of these numbers, an ideal pendulum's behavior is deterministic but chaotic. Consequently a model of a double pendulum cannot predict the four variable values with any degree of accuracy more than a short time in the future. But what it can predict is the frequency of occurrence of particular values for the four variables, either individually or jointly.
In view of the fact that you clearly have no idea as to what are the strengths and limitations of climate modelling, can I recommend that you start by getting an appreciation of what can, and can't be modeled in chaotic systems. You just need a PC, a double pendulum, a stroboscope, and a video camera. Run a model of the pendulum on the PC, and collect as data the frequency of particular angles of the pendulums (the first two variables). Using the strobe and camera, set the double pendulum in motion and check the frequency of the various angles. If the model is any good, and if the pendulum is any good (stable base and low friction) the frequencies should match very closely. Having done this, and having gained a true appreciation of the power and limitations of the modelling of chaotic systems, then we can discuss models.
In the meantime you are obviously all at sea if you don't even know the meaning of "good approximation" in scientific use. FYI, Newton's laws of motion and gravity are a "good approximation" of the behavior of the solar system, yet using them the Voyager 2 space craft was launched on a fly by of four outer planets with an accuracy something like splitting a hair at 2 miles distance.
As you can see, an increase in temperature from 0 to 10 degrees C increases the holding capacity by about 5 grams per Kg of air. An increase from 30 to 35 degrees increases the holding capacity by nearly 10 grams. Half the temperature increase and nearly double the holding capacity increase.
There seems to be absolutely no understanding of this difference in your models. In contrast the meteorological models that tell us CAPE will increase have this built in to their physics.
3) Which brings us back to models, and you complete misunderstanding of what it means for a climate model to be accurate.
Consider a double pendulum. It's state at any moment can be completely described by seven, numbers three of which are invariant. The three invariant numbers are the length of the two pendulums, and the distance from the axis at with the second pendulum is attached to the first. The variable numbers are the angle of the main pendulum arm from the vertical, the angle of the second pendulum arm to the main pendulum arm, and the angular momentum of each bob.
Given the exact specification of each of these numbers, an ideal pendulum's behavior is deterministic but chaotic. Consequently a model of a double pendulum cannot predict the four variable values with any degree of accuracy more than a short time in the future. But what it can predict is the frequency of occurrence of particular values for the four variables, either individually or jointly.
In view of the fact that you clearly have no idea as to what are the strengths and limitations of climate modelling, can I recommend that you start by getting an appreciation of what can, and can't be modeled in chaotic systems. You just need a PC, a double pendulum, a stroboscope, and a video camera. Run a model of the pendulum on the PC, and collect as data the frequency of particular angles of the pendulums (the first two variables). Using the strobe and camera, set the double pendulum in motion and check the frequency of the various angles. If the model is any good, and if the pendulum is any good (stable base and low friction) the frequencies should match very closely. Having done this, and having gained a true appreciation of the power and limitations of the modelling of chaotic systems, then we can discuss models.
In the meantime you are obviously all at sea if you don't even know the meaning of "good approximation" in scientific use. FYI, Newton's laws of motion and gravity are a "good approximation" of the behavior of the solar system, yet using them the Voyager 2 space craft was launched on a fly by of four outer planets with an accuracy something like splitting a hair at 2 miles distance.
-
Steve Case at 09:54 AM on 18 July 2011Sea level rise is exaggerated
- Camburn ... I think you are overestimating sea level rise. Envisat data, which at this time is the most advanced, iindicates a sea level rise of approx 1.78mm/yr if memory serves me
The IPCC tells us that Over the period 1961 to 2003, global ocean temperature has risen by 0.1°C from the surface to a depth of 700 m. The IPCC also tells us, in table 10.7, that by 2100 we can expect thermal expansion to account for as much as 6.8 mm/yr. I'm questioning if those two facts are compatible. The graph that Albatross put up is nearly a straight line. In order to achieve the 6.8 mm/yr it's going have to change. So, how likely is it that it will begin a sharp upward trend resulting in that 6.8 mm/yr contribution from thermal expansion the IPCC tells us could happen by 2100? As I pointed out earlier, 6.8 mm/yr is worst case, but that's what the popular press will report, so it ought to be reasonable. Is it?
-
Albatross at 09:27 AM on 18 July 2011Sea level rise is exaggerated
Re #129, You memory fails you. GSL is increasing at about 3.22 mm/yr, almost double what your memory thinks: Source]
-
Tom Smerling at 09:19 AM on 18 July 2011Does more extreme rainfall mean more flooding? Answer: Not always
Excellent. I appreciate the precision of this post, which takes care not to over- or understate the case. But it would be helpful to know more about the background and qualifications of the authors, so readers can judge for themselves the credibility. (A bit of bio info would also e useful when citing this rebuttal in a debate or interview.) Ideally, the brief bio (could be one line) would appear right with the post, or perhaps in a link within the post. -
Camburn at 09:18 AM on 18 July 2011Sea level rise is exaggerated
Steve: I think you are overestimating sea level rise. Envisat data, which at this time is the most advanced, iindicates a sea level rise of approx 1.78mm/yr if memory serves me. -
hfranzen at 08:53 AM on 18 July 2011OA not OK part 2: Thermodynamic duo
Please understand that I am not claiming to provide anything more than a correct analysis of a model system. The actual behavior of the real seawater system I gladly leave to others such as yourself and greatly appreciate your efforts. On the other hand, the point under discussion is the use of thermodyanmics and eq, 1 of the post. In that area I am an expert I assert that it is necessary when considering the thermodynamics of a complex system to consider the independent net reactions (any set will do - all yield the same result - but the set must be complete!) From this set of net reactions one finds the indepndent equilibrium constants and then combines these with other constraints to obtain as many equations as unknowns. It is not only incorrect but extremely misleading to select one equation (eq, 1) and then assert spontaneity of that reaction without specifying the source of the spontaneity. I have thought a great deal about this subject in general, published several times on it in J. Chem Ed. and have had some impact on the way the subject is taught. But my contribution here is simply to ask that the thermodyanmaics of ideal systems be correctly considered - not that I can proovide the final (or even a partial) answer to the description of sea water chemistry. Believe me I feel better knowing that folks such as yourself are considering the details of seawater chemistry and you will feel much more secure in your considerstion if your treatment of the basic P. Chem. of model systems is done correctly. And this is more than a pedantic point. To choose a single independent net reaction (eq.1) and assert that the precipitaion of carbonate is accompnaied by the liberation of CO2 as was done in the post is just not correct. -
Steve Case at 08:48 AM on 18 July 2011Sea level rise is exaggerated
- Well, observations show the thermal (steric) component of sea level is rising at 0.69mm per year over the last 6 years,
Is rising 0.69 mm/yr or is 0.69 mm/yr? It does make a difference. In any case, do you have a link for that observation? Even at 0.69 mm/yr is it reasonable to expect a possible 6.8 mm/yr due to thermal expansion by 2100?
- so your calculations appear to be missing important details - I see a glaringly obvious one in your calculations.
And that glaringly obvious one is?
-
Norman at 08:27 AM on 18 July 20112010 - 2011: Earth's most extreme weather since 1816?
Tom Curtis @ 336 Tom, I thought angular momentum would cause a slowdown of velocity when the system expands. (like the ice skater on ice analogy. She has a certain spin speed with her arms outstreched, when she pulls her arms in her spin velocity increases to conserve angular momentum). If the Hadley cells expand then the velocity of the air would slow down to conserve angular momentum. This would also be the case with an expanding troposphere. The winds in the rotating thermals would move slower as it covers more distance. Your point 3) That is the basics of my line of questions. An increase in moiture of an air parcek would increase the thermal velocity of an updraft if the environmental lapse rate was unchanged, I still do not understand why the lapse rate won't change. Your point 4) Would this temperature gradient between sea and land be sufficient to cause wind effects that were destructive? I think there is a calculation for it. Your point 6) This is the big one. The climate models. They put in many mathematical formulas to arrive at their results. I still wonder why the environmental lapse rate is not shown to change in the models. This all goes back to the post Dikran Marsupial had about the double pendulum model. Equations for double pendulum. These equations will generate a model double pendulum. Will it mimic a real world pendulum? In the real world many more varialbes would effect the actual motion of the pendulum. The model can only give a general description of a "real" world double pendulum. It may match one closely or deviate at some point because of some assumptions. In the models of severe weather they have many equations and must make some assumptions. Here is a link: Climate model equation. Quote from article: "In Meteorology, the primitive equations are a version of the Navier-Stokes equations that describe hydrodynamical flow on the sphere . . . Thus, they are a good approximation of global atmospheric flow and are used in most atmospheric models" Note "good approximation" Also a model has to make some assumptions. Why do they assume no longterm trend in the temperature lapse rates? Makes a huge difference in what the model will come up with. IPCC use of models for small scale events. Since climate models are based upon the laws of physics they are good guides for seeing patterns but all these laws working together makes a system to complex to model completely. The question still is why did Trapp et al (2009) find no longterm change in lapse rate temperature? One scientist's view: "Global Warming One: possibility for further research is whether or not a significant change in normal lapse rates is an indicator of climate change. My hypothesis is tha twith an overall warmer climate, there will be a slower lapse rate." Article for above quote. If the environmental lapse rate slows enough (less temperature difference with height) it will counter any effect that can come from higher latent heat in warmer moister air. It seems is if there is not enough agreement on what happens to the environmental lapse rate to make the Trapp et al. (2009) study conclusive about the future of severe weather events. -
From Peru at 08:06 AM on 18 July 2011Carter Confusion #3: Surface Temperature Record Cherries
As a student and future geologist, I feel ashamed from those geologists , like Bob Carter, that deny climate science. What should be evident tob any with a minimum knowledge of Geology, in particular Historic Geology (that includes paloclimatology as a branch) is that we are doing in a few decades what nature did in hundred thousands or millions years in the past. This wil cause necessarily a disruption, because life on Earth cannot tollerate such radical changes in so little time. One of the graphs he presented was this: With greenhouse gases at levels not seen in 15 million years, he should be very concerned about abrupt athropogenic climate change, because the glacial-interglacial oscillations evident in the graph above will be gone so we we are on track to an ice-free Greenland and a small ice sheet in Antartica, like in the Miocene 15 million years ago.
But he isn't, and the places where he gives his conferences, associated with free market capitalism such as the Heartland Institute suggest that his thoughts are strongly influenced by political/economical ideology.
He also make a conference at Sydney Mining Club, suggesting a link with coal industry.
So it seems that Bob Carter was either blinded by ideology or by economic convenience. What a shame for the geoological community!
Nota Bene:
If one thinks about it, the mining industry should be very concerned about climate change and peak oil, because them could make the costs of extraction skyrocket resulting in heavy economic losses. So them should be sustaining climate regulations, not opposing them....
...unless you extract coal, of course !
The mining professionals in extracting metals (copper, iron, lead, zinc, silver, gold, platinum, etc) and gemstones (diamonds, smeralds, zaffires, rubys, etc) should break away from the fossil fuel industrial monster, so that the mining industry as a whole would not be morally stained for the wrongs of one of his branches (the fossil fuel extraction branch).
With greenhouse gases at levels not seen in 15 million years, he should be very concerned about abrupt athropogenic climate change, because the glacial-interglacial oscillations evident in the graph above will be gone so we we are on track to an ice-free Greenland and a small ice sheet in Antartica, like in the Miocene 15 million years ago.
But he isn't, and the places where he gives his conferences, associated with free market capitalism such as the Heartland Institute suggest that his thoughts are strongly influenced by political/economical ideology.
He also make a conference at Sydney Mining Club, suggesting a link with coal industry.
So it seems that Bob Carter was either blinded by ideology or by economic convenience. What a shame for the geoological community!
Nota Bene:
If one thinks about it, the mining industry should be very concerned about climate change and peak oil, because them could make the costs of extraction skyrocket resulting in heavy economic losses. So them should be sustaining climate regulations, not opposing them....
...unless you extract coal, of course !
The mining professionals in extracting metals (copper, iron, lead, zinc, silver, gold, platinum, etc) and gemstones (diamonds, smeralds, zaffires, rubys, etc) should break away from the fossil fuel industrial monster, so that the mining industry as a whole would not be morally stained for the wrongs of one of his branches (the fossil fuel extraction branch).
Prev 1604 1605 1606 1607 1608 1609 1610 1611 1612 1613 1614 1615 1616 1617 1618 1619 Next


