


 Arguments


Recent Comments
Prev 1622 1623 1624 1625 1626 1627 1628 1629 1630 1631 1632 1633 1634 1635 1636 1637 Next
Comments 81451 to 81500:
-
Norman at 12:38 PM on 5 July 20112010 - 2011: Earth's most extreme weather since 1816?
scaddenp @ 240 and 241 Not sure I understand your line of reasoning. The definition of science is given above. Gravity has a linking mechanism, all matter attracts and it does so by the working equation F=G(M1*M2)/r^2. Certain systems of gravity cannot be predicted. They are outside the realm of science. Even accumulating more information on the system will not make it more predictable. Example of chaotic gravity. After 10 years with Hyperion you may not be able to build a model to predict its motion but gravity is still scientific. If you have the measurements of its mass, Saturn's mass, its distance from Saturn, you can come up with a precise measure of the gravitational force acting on this moon. If a climate model is to be considered scientific then it must pass the test of predictability. If the model is incapable of making valid tested predictions why would you consider it scientific? -
scaddenp at 12:23 PM on 5 July 2011Google It - Clean Energy is Good for the Economy
The pluses and minuses of high dams here get a lot of debate. Plus - new fisheries (introduced species - salmon), recreational lakes, flood control, MAYBE irrigation potential, and of course power. Minus - earthquake hazard, loss of habitat and/or farming potential, unsolved problem with native fisheries (which is more complex problem than just dams in case of the very valuable whitebait), competition with downstream irrigators for water, loss of whitewater recreation/tourism. In my opinion, you prioritize sites, sacrifice some rivers with a lot of dams, leave others free. An unavoidably complex process of evaluating conflicting values. -
quokka at 12:07 PM on 5 July 2011German Energy Priorities
#18 Agnostic, Do you have any recent data to back that up. According to these 2005 figures, Germany was performing somewhere in the middle of the pack with respect to both Kyoto commitments and in absolute per capita emissions reductions. -
Eric (skeptic) at 11:56 AM on 5 July 2011Google It - Clean Energy is Good for the Economy
The costs depend on the dam. Some dams would create value by steadying the water level and creating a better fishery. Most of the land on the flood plain around me is used for grazing or sometimes pasture or most often it is just mowed for aesthetic or recreational reasons. Some is wooded and that would be lost (harvested). A run-of-the-river hydro in my case would capture a tiny fraction of a dam (perhaps 10X less head and hundreds or thousands of times less flow). Also a run-of-the-river installation below my house would have to be completely submersible to withstand 30 foot floods. Incidentally I can anchor a floating generator with no approval whatsoever since it is "removable". Anything else would be a regulatory nightmare. -
Camburn at 11:43 AM on 5 July 2011Google It - Clean Energy is Good for the Economy
adelady: I was indicating dams on the river. They would serve a two fold purpose. Flood mitigation as well as a source to generate power. The externalized costs of a damn must be balanced against the cost of flooding. In the case of the upper Missouri Basin, we know that we are in a wet cycle and it previous cycles are an indication, flooding will be common for the next 60+ years. An example of the area flooded just this year...you could build a sizeable dam and the flood control provided could allow dam external to be flat for 50 years. There were millions of acres flooded this year alone. In the USA this would be easy to fund. Just take 100Billion out of defense, (which is severaly bloated) use 50 billion to reduce the deficit and use the other 50 billion to build dams. -
Camburn at 11:32 AM on 5 July 2011Trouble Brewing in the North
DB: Can we just start calling you Dr. Who? -
Riduna at 11:29 AM on 5 July 2011German Energy Priorities
Germany is unquestionably the pace setter when it comes to reducing CO2 emissions in terms of what it has already achieved and what it proposes. Its 2020 target can be achieved though probably not without supplementation such as import of electricity from France and Denmark or improvement in the storage and distribution of energy over the present decade. Both are possible. The latter is more important, particularly ability to store electricity and efficiently release it in response to periodic increased demand. -
scaddenp at 11:27 AM on 5 July 2011Google It - Clean Energy is Good for the Economy
Good point adelady. I was not externalising costs and I agree that should be on same basis as carbon. This is a debate that goes on quite a bit here as we look for more hydro power. Except in a maybe 8 more sites, wind and geothermal are cheaper (ignore externalised costs) than hydro and in those 8 sites, there are significant external costs to building a dam. Just remember that not only is run-of-river more expensive per GJ, but there is considerably less total GJ available in practical terms. -
adelady at 11:07 AM on 5 July 2011Google It - Clean Energy is Good for the Economy
"... usually more expensive per GJ than high dam." Externalised costs? If we insist on accounting for externalised costs for carbon, we should do the same for renewables. Surely one of the great advantages of wind and solar (esp PV) is that it allows multiple uses of the power producing area. And dams not only disallow other uses, they destroy other valuable things. Like forests and farmland and communities. Or does the accounting include all of these things - I don't know. -
John Bruno at 11:02 AM on 5 July 2011Great Barrier Reef Part 1: Current Conditions and Human Impacts
Rob thanks for your comments about fisheries in NZ! It is funny, but your point about the crazy definition of "overfished" used by fisheries managers comes up all the time (at least in my world). It is maddening that a population reduced to a third or more of its very recent size will often NOT be considered overfishing by fisheries biologist and managers. We ran a post and a forum about this issue recently on SeaMonster here and honestly, the variety of definitions of what "overfishing" is underlies a lot of the dispute about the state of the world's fisheries, although the topic rarely comes up (in part because when you burrow in, it gets very complex). Yeah, I have a soft spot for plants! It causes be lots of trouble in a field where plants are considered vermin to be exterminated (ie, "slime" in high-priest of marine environmentalism JBC Jackson's vernacular) I feel like a coyote or wolf biologists in the 19th century. I still have hope minds can be changed... -
scaddenp at 10:50 AM on 5 July 20112010 - 2011: Earth's most extreme weather since 1816?
And by same token we can predict earth or mars location and attitude 10 years out to high degree of precision. That make gravity an inconsistent theory? -
John Bruno at 10:48 AM on 5 July 2011Great Barrier Reef Part 1: Current Conditions and Human Impacts
Dear jmsully, The AIMS Osborne paper, although strikingly similar to Sweatman et al in many regards, comes to a different conclusion about the historical state of the GBR. In their abstract, Osborne et al state: "While the limited data for the GBR prior to the 1980’s suggests that coral cover was higher than in our survey, we found no evidence of consistent, system-wide decline in coral cover since 1995" Thus, like many others (eg, Bruno and Selig 2007 PLoS One), they interpreted evidence of no trend during that time period as indicating no trend during that time period. Sweatman et al - along with Andrew Bolt, Bob Carter and others - in contrast used this evidence to support their argument that the GBR is pristine or near pristine, ie, it hasn't change much if at all (i.e. they argued that the state of the reef in 1995 is representative of the system baseline). -
scaddenp at 10:48 AM on 5 July 20112010 - 2011: Earth's most extreme weather since 1816?
Norman, all predictions are couched in terms of their inherent uncertainty. You could predict the location of say Saturn's moon Hyperion in 10 years time but you dont have a chance in hell of predicting it attitude. Does that make gravity unscientific? -
dhogaza at 10:41 AM on 5 July 2011Trouble Brewing in the North
"At the moment, this post says "Posted on 14 July 2011 ..." Ice fortress ... Bastille Day ... it all sorta fits, no?Response:[DB] Fixed pub date (and they said I'd never make it as a Timelord...).
-
scaddenp at 10:37 AM on 5 July 2011It's the sun
Joe, I cant make sense of your sentence. ": while the global dimming the only natural caused temperature is higher than the total (anthro+nat)." Its certainly not obvious to me why you think IPCC misrepresents Stott. What do you mean by "global dimming"? "it is surely not the only parameter that may be of importance" Well when you have some other parameter that makes physical sense, let us know. Meanwhile I will continue to look at the well-established, measurable physics of GHGs. If you ignore them, you cant get planetary temperature right so why do think changing their forcing is so insignificant compared to same change in solar forcing? -
scaddenp at 10:26 AM on 5 July 2011Google It - Clean Energy is Good for the Economy
I am assuming Camburn is proposing a lake in national park. I suspect Camburn thinks all "alarmists" are greenies and so is trying a wind up. I dont know the US at all so happy to take his word for it, though from experience here, run-of-river generates less power and so usually more expensive per GJ than high dam. -
quokka at 09:25 AM on 5 July 2011German Energy Priorities
#13 peter prewett, Oldbury has old Magnox reactors which are known to be difficult and expensive to decommission. They are not representative of decommissioning issues or costs for water moderated, water cooled reactors such as PWRs, BWRs and CANDUs. -
quokka at 09:17 AM on 5 July 2011German Energy Priorities
I did a little back of the envelope calculation to test out the proposition that cost of the Fukushima accident is "proof" that nuclear power is too expensive. This is what I came up with: Over the whole history of nuclear power worldwide, total electricity generated: ~70,000,000 GWh (from eyeballing the chart here: http://www.world-nuclear.org/info/inf01.html ) Assuming that has displaced black coal at ~900 grams/kWh CO2 implies an emissions saving of ~63,000,000,000 tonnes CO2 For an assumed cleanup cost of $100,000,000,000 at Fukishima that is an additional CO2 abatement cost of ~$1.40 per tonne CO2 over the whole history of nuclear power. -
Patrick 027 at 08:22 AM on 5 July 2011The Planetary Greenhouse Engine Revisited
Re Michele - Also remember, in your analogy, liquid water is the enthalpy contained in the non-photons. Thus, the topography you speak of is not a landscape that directs water flow - it is the liquid water itself! And given that (except at sufficiently great heights) there is little conduction and no spontaneous convection in the part of the atmosphere being considered, in a radiative equilibrium the only flow of water from one place to another is by evaporation and condensation. But to get a better understanding, again, please try going right to the physics of radiation; this analogy could lead you astray. -
Rob Painting at 08:15 AM on 5 July 2011Great Barrier Reef Part 1: Current Conditions and Human Impacts
ETR - Bleaching is short-term, it occurs when surface waters rise 1-2°C above the normal summer maximum. See my post Coral: life's a bleach... and then you die In the Caribbean many of the reefs are not recovering, as bleaching and associated disease are killing them. Many areas, that were once coral reefs are now covered in seaweed and slime (macroalgae - John Bruno will tell me off for using the word 'slime'). See 'Doctor Doom" - Jeremy Jackson's talk Look at the state of the Caribbean sea surface temperatures now: If that trend continues through to September/October 2011 we will have another bleaching event in the Caribbean. Not a rosy future for coral sadly.
-
Eric the Red at 08:03 AM on 5 July 2011Monthly Climate Summary: May 2011
Stevo, Much of the pattern is also totally in line with a stron La Nina. Long term trends are much better indicators than short term anomalies. -
BBD at 07:44 AM on 5 July 2011A Detailed Look at Renewable Baseload Energy
Mark Harrigan Many good points at 134, culminating in:Can we advance the debate by seeking solutions to the problems of renewables?
Yes, of course. But this is implicit in all future renewables scenarios, as we see with Diesendorf (2010). People have been thinking about the solutions for a long time. There is real potential here, but the upper bound appears to be ca 30% of the global energy mix by 2050. If not rather less. This is the problem with renewables. The potential is either misrepresented (high renewables scenarios), or optimistic (30%). Even assuming the latter, there is a very large elephant in the room. -
Norman at 07:27 AM on 5 July 20112010 - 2011: Earth's most extreme weather since 1816?
adelady @ 238 You have pointed out one of the needs for a study to considered scientific, predictablitity. They do know some chemicals in cigarette smoke are capable of damaging DNA (which could lead to cancer). So there is a tenuous link even if it can't be specifically detemined. If a climate model would predict events sometimes and not so well at other times then it would fail in the predictablity deparment and I would not consider it science based upon the accepted definition of this concept. -
From Peru at 07:06 AM on 5 July 2011German Energy Priorities
(continuation) But there is the alternative of nuclear fusion. The easiest process is the Deuterium(H-2) + Tritium(H-3) fusion, that produces Helium-3 plus one neutron: H-1 + H-3 → He-3 + n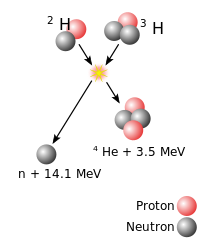 This reaction still requires a relatively rare isotope, Tritium. It can be obtained from litium:
n + Li-6 → H-3 + He-4
n + Li-7 → H-3 + He-4 + n
Litium is still a non-renewable metal that must be mined.
But there is the D-D reaction, that uses just deuterium:
H-1 + H-2 → H-3 + H-1 or He-3 + n
This uses the abundant deuterium, found in the abundant water on Earth.
Water is considered renewable (actually isn’t, but there is so much of it that will behave as if it were a never-ending resource, just like the hydrogen burned to helium in sun in a similar nuclear fusion reaction)
This reaction still requires a relatively rare isotope, Tritium. It can be obtained from litium:
n + Li-6 → H-3 + He-4
n + Li-7 → H-3 + He-4 + n
Litium is still a non-renewable metal that must be mined.
But there is the D-D reaction, that uses just deuterium:
H-1 + H-2 → H-3 + H-1 or He-3 + n
This uses the abundant deuterium, found in the abundant water on Earth.
Water is considered renewable (actually isn’t, but there is so much of it that will behave as if it were a never-ending resource, just like the hydrogen burned to helium in sun in a similar nuclear fusion reaction)
-
adelady at 07:03 AM on 5 July 20112010 - 2011: Earth's most extreme weather since 1816?
Norman "It would be a science if the models have known mechanisms for explaining why the preciptiation will increase ... and then if they had predictability." Come on. This is like saying that you can't rely on health experts telling you that when cigarette consumption increases in an area you can expect to see more cases of lung cancer as well as other cancers - because the mechanism for working out how smoke (of all kinds) initiates cancer is poorly understood. Nor can health experts predict with any confidence which particular smokers will contract cancer as against heart disease or stroke or emphysema. Epidemiologists can tell you the expected rate for these diseases given a certain rate of smoking. Doctors can identify which people have developed these diseases and they can treat them - but they can't tell in advance which person will, or will not, develop any smoking related illness. Does that mean it's not science? -
GFW at 07:02 AM on 5 July 2011Trouble Brewing in the North
At the moment, this post says "Posted on 14 July 2011 by MarkR". Does this mean we have the time machine Tom Toles suggested as the fix for global warming? :-) -
Norman at 06:34 AM on 5 July 20112010 - 2011: Earth's most extreme weather since 1816?
Dikran Marsupial @ 236 I will attempt to answer: "Norman, take a GCM, which embodies our knowledge of climate physics. Apply CO2 radiative forcing, and observe an increase in rainfall frequency and intensity. Does it then become science?" Here is the Wikipedia definition of science which is similar to other definitions. Science Definition. "Science (from Latin: scientia meaning "knowledge") is a systematic enterprise that builds and organizes knowledge in the form of testable explanations and predictions about the world." The testable explanations would be the mechanisms I have been asking for. The mechanisms that drive extreme thunderstorms are well established and predicatable. Meteorologists can look at initial conditions and predict with high degree of confidence the severity of thunderstorms that will develop. Now for your question. It would be a science if the models have known mechanisms for explaining why the preciptiation will increase (such as, increased evaporation caused by a warming earth due to CO2 forcing) and then if they had predictablitly. If the model forcasts a given increase in frequency and intensity of rainfall over an area during a specified period of time, and the actual rainfall in the area comes close to the model's prediction over a given number of areas (one correct prediction would not be enough to qualify the model as science) then I would say the model is now a science. It has achieved the goal of predictability that is necessary for it to be considered a science. In the example you provided it goes back to what one considers extreme. In your example 40 mm a day is considered extreme. "Extreme rainfall is chosen as precipitation greater than 40 mm/day chosen on the basis of prior research indicating that rainfall at this intensity has the potential of causing soil erosion and flooding." I don't think any farmer in my area would consider a 1.57" rainfall in a day an extreme amount. I would doubt such a rain would lead to flooding unless the soil was highly saturated and it all fell in a really short time. -
BBD at 06:09 AM on 5 July 2011German Energy Priorities
peter prewett And the residence time of CO2 in the atmosphere is...? It boils down to the lesser of two evils, every time. -
Patrick 027 at 05:59 AM on 5 July 2011The Planetary Greenhouse Engine Revisited
Re Michele Well then. Where is it the physics inconsistency? Radiation doesn't behave just like water flowing under gravity, but borrowing your analogy anyway, what you've forgotten is that evaporation doesn't only occur in the valley, it occurs on the hill as well. In fact there is more evaporation, per unit area, on the hill than in the valley (the analogy gets tricky here as to why, but we could say it is because the wind is stronger on the hill. Actually it is by said evaporation that the water reaches the valley as well as space, and here the analogy falls apart almost completely. So please consider radiation physics.) -
Dikran Marsupial at 05:41 AM on 5 July 20112010 - 2011: Earth's most extreme weather since 1816?
Norman@235 In post 231, I asked you a specific question, that you ought to be capable of answering directly. Sadly all to often discussions of climate science with skeptics end up with the skeptic unwilling to state his position clearly and unambiguously. I have learned that that is usually the indicator that no further progress will be made and it is a waste of time to continue. That modelling extreme events involves uncertainties does not mean it isn't science. -
BBD at 05:10 AM on 5 July 2011A Detailed Look at Renewable Baseload Energy
Mark Harrigan Thanks for your thoughtful response. First, I obviously agree with you on the (to some) surprisingly 'safe' nature of nuclear (see #101 for another way of looking at this: sum total plant operating history over last 40 years = 11,255 years; 18 INES rated incidents over this period, only Three Mile Island, Chernobyl and Fukushima 1 rated above INES 4). But the risk/hazard question is real, although it pays to remember that Generation III plant is inherently far safer than Generation II. Also, those who fret most about terrorist threats to reactors and waste transport know least about reactor containment vessels and Type B transport package specs. The best way to keep operators on their toes is continuous, unscheduled, independent inspection with absolute power to require access and disclosure. Nothing less will do. And yes, I can see it being a big problem with the Russians and the Chinese and other contrarians, but that's a political fight worth having and frankly I'd be very happy with somewhat ill-tempered Chinese and Russian teams picking over US and EU plant really looking for something wrong. We would of course be doing the same for them. Even so, this is where it gets hard. If you ask around on this site about the risk/hazard analysis of AGW, you will get a variety of answers, mostly high/high or worse. That's the policy bullet to bite. What infuriates me is that only Hansen and Lovelock actually criticise the massed ranks of anti-nuclear activists among the climate concerned for getting in the way of a difficult but necessary decision to expand nuclear. Anti-nuclear sentiment is Janus-faced; its other aspect is ill-founded renewables advocacy. The policy 'missing link' is the frankly naive claim that western democracies will somehow turn to austerity and energy poverty and deindustrialise to make it all work. It's wishful thinking on a par with AGW scepticsim - and similarly dangerous. Mike Hulme was correct to classify AGW as a 'wicked problem'. This sort of thing is exactly what he was talking about. -
Norman at 04:54 AM on 5 July 20112010 - 2011: Earth's most extreme weather since 1816?
Dikran Marsupial @ 231 Here ia quote from a very long report on climate models. The report is very long and detailed so I have not had to time to read through all of it. It seems climate models are fairly good at reproducing some climate effects based upon the actual events and they do continue to improve and evolve as more knowledge is gained and added. "Modeling of extreme events poses special challenges since they are, by definition, rare. Although the intensity and frequency of extreme events are modulated by ocean and land surface state and by trends in the mean climate state, internal atmospheric variability plays a very large role, and the most extreme events arise from chance confluence of unlikely conditions. The very rarity of extreme events makes statistical evaluation of model performance less robust than for mean climate. For example, in evaluating a model’s ability to simulate heat waves as intense as that in 1995, only a few episodes in the entire 20th Century approach or exceed that intensity (Kunkel et al. 1996). For such rare events, estimates of the real risk are highly uncertain, varying from once every 30 years to once every 100 years or more. Thus, a model that simulates these occurrences at a frequency of once every 30 years may be performing adequately, but its performance cannot be distinguished from that of the model that simulates a frequency of once every 100 years." Quote from this report: Climate models report. -
Eric the Red at 04:29 AM on 5 July 2011Great Barrier Reef Part 1: Current Conditions and Human Impacts
jmsully, I was about to link to that article when I read your post. The bleaching appeared to be a short-term occurrance, similar to that observed in the Caribbean and elseware. -
Norman at 03:57 AM on 5 July 20112010 - 2011: Earth's most extreme weather since 1816?
Tom Curtis @ 219 I did as you suggested. I sent a query to Munich Re about what criteria they use to determine a dissater in their charts. I will have to wait and see if they answer it. -
Norman at 03:54 AM on 5 July 20112010 - 2011: Earth's most extreme weather since 1816?
Tom Curtis @ 232 I was reading up on the formation of preciptitaion events and what determines their severity. The thunderstrom you describe is known as an air-mass thunderstorm. Generally they are the least severe and the rain will cool the updraft and destroy the cycle. Even these need the one common factor in thunderstorms. You need a layer of unstable air (one where if you move a parcel of ground air to a higher level it will end up being warmer than the surrounding air and so continue to rise). I looked at some weather links to determine what causes the most severe thunderstorms. Moisture in the air is the definate fuel for storms but there are many factors that go into determining the intensity of a thunderstorm. I do not know if the 4% increase in moisture content of the air will make much difference (will continue to research this). Here are some links. Atmopheric stability and storm formation. Factors that determine the intensity of a thunderstorm. Stability of the atmosphere is one of the major factors in determining the severity of a thunderstorm. The less stable the more likely an intense storm will develop. Also upper wind variation is really important or the storm will choke itself off. The upper wind moves the region of downdraft away from the updraft allowing the storm to continue and intensify. Other factors are how fast the overall storm is moving. A strong strom that moves rapidly will not be a likely to produce flooding as a similar strong storm that moves much slower over an area. Will global warming create more regions of unstable air? Will these regions of unstable air be more unstable because of global warming? Will wind shear become stronger as the earth warms? If these questions can be determined to be a yes then I would agree with the hypothesis that global warming will increase the number of severe storms, more rain, hail, wind and tornadoes all with the potential to increase damage to target areas. In the US the term used is severe weather. An extreme weather event would be one significantly worse than normal severe storm events. -
JoeRG at 02:21 AM on 5 July 2011It's the sun
Well, I didn't understand the figure. Of course, because the IPCC didn't adopt it the right way from the original (Stott et al (2006b)). In the original work it is as I told that it has to be: while the global dimming the only natural caused temperature is higher than the total (anthro+nat). So what did the IPCC do, or at least the authors that wrote the chapter?! (Possibly this may be the reason why the link to the corresponding appendix is now broken in the IPCC documents. Who knows...) Ok, I'm again off topic. Back to it. The first paper you've linked is a good chance to get enhanced knowledge about another part of Sun's influence. But, if you are aware of it, this is in addition to the solar components that were used so far (TSI and SSN) and it is surely not the only parameter that may be of importance. Perhaps it will come up to the IPCC documents in the future (I hope so). As to Hansen, I will have a closer look at it. But obviously he didn't know about the global dimming because in Fig.1 (base of the whole work) the net forcing is steadily rising (except the volcanoes) what definitely would have disabled a cooling that was observed. I'll come back to it (in the right topic, of course). -
Mark Harrigan at 02:05 AM on 5 July 2011A Detailed Look at Renewable Baseload Energy
@BDD on the nuclear issue You say "We need to get past the all-consuming anti-nuclear bias and accept the unpalatable facts as they stand. Then formulate energy policy that makes sense." I agree that too often the nuclear question gets submerged by emotionalism. The question is what unpalatable facts do we need to consider? Despite the problems associated with the issues in Japan the fact is Nuclear has a far better safety record per MWh generated than any fossil fuel by orders of magnitude. The deaths per TWh for various energy sources are here Deaths per TWh Energy Source Death Rate (deaths per TWh) Coal – world average 161 (26% of world energy, 50% of electricity) Coal – China 278 Coal – USA 15 Oil 36 (36% of world energy) Natural Gas 4 (21% of world energy) Biofuel/Biomass 12 Peat 12 Solar (rooftop) 0.44 (less than 0.1% of world energy) Wind 0.15 (less than 1% of world energy) Hydro 0.10 (europe death rate, 2.2% of world energy) Hydro - world including Banqiao) 1.4 (about 2500 TWh/yr and 171,000 Banqiao dead) Nuclear 0.04 (5.9% of world energy) I'm not sure about the veracity of the energy splits but taking this data at face value then Nuclear appears to be very safe. BUT (and it's a big but) I think to consider the nuclear issue we must first examine safety in its two component parts. Risk (chances of something going wrong) and Hazard (impact of something going wrong). With nuclear technology (even older technology such as at Fukushima) the risk is actually vanishingly small - but the hazard is enormous. The question is can we manage the hazard? So far Fukushima suggests this is a major problem. IF something goes catastrophically wrong (which clearly can happen) we simply cannot cope. So the issue of hazard is huge. Perhaps this is acceptable though if the risk is so tiny? After all we accept airline travel as commonplace and it is somewhat analogous (the risk of an accident is about 1/60th of car travel) although it can be argued the hazard is high (plane crash = almost certain death whereas it is not certain with a car accident) Until recently that was my view and I was a passionate advocate for Nuclear as the "obvious" solution to AGW. The technology is CO2 free in operation (yes I've heard the tired arguments about life cycle but they've been comprehensively refuted). It works and is proven as a reliable 24/7 base load/peak demand supply (as opposed to almost all renewable alternatives which - whilst promising are not yet proven). It's relatively cost effective and whilst waste management issues are real they are not beyond solution or management (as existing countries with an extensive nuclear history show). And the risk of something going wrong is tiny - even better if you site it somewhere geologically appropriate. So far so good for the technology - especially when you consider that new designs are way better. But the problem is the risk is not just in the technology. What makes it worse is where the human factor comes in. I think what Fukushima amply demonstrates is not so much that the problem with Nuclear is in the technology but in how it is managed. The management has been exposed to be one of avoidance of responsibility and cover up of what had really happened. This clearly increased the risk (made it more likely for things to go wrong) and has unquestionably exacerbated the hazard. I think most people sense this intuitively and hence that is why the "fear" of nuclear is so high. The hazard is enormous, sometimes unmanageable and there is simply not sufficient trust in fallible human management (which wants to avoid accountability) especially when it is profit motivated. So where do we weigh that up? I don't profess to know the answer I'd still like to think that we shouldn't be taking the nuclear option off the table. If we could improve our human management I think it has a role to play. But I can very much understand and empathise with why people are so distrustful of it as a viable alternative. It's hard to have an honest dispassionate debate about it because of the emotional factor but I hope some of this post helps. BTW in the interests of disclosure I am Atomic Physicist by training (not the same as nuclear but I have some knowledge) -
Mark Harrigan at 01:09 AM on 5 July 2011A Detailed Look at Renewable Baseload Energy
Ouch! Looks like I've stepped into the middle of a nuclear debate! I'll come back to that @BDD #123 & #127 I think Mark D's contribution is a positive one EVEN if he is wrong - because it is focussed on what we need to do. You might want to consider the issue of right and wrong here On Being Wrong watch the video - it's enlightening and humbling Re the issue of gas fired turbines - you make an excellent point about just how fast they can spin up. But this seems to me a problem that some good thinking might overcome rather than a fundamental unsolveable problem We should invite some expert comment on this? My limited understanding is that gas turbines have a longer start-up time than conventional engines but no worse than coal or other existing "base load" technologies - all of which have to be "on" to provide power. I also gather gas generation is relatively slow to respond to changes in power demand - but that is all relative I'm told this is improved somewhat by Simplified Combined Cycle because of the pre-mixing steam and fuel before injection into the combustor. This enables a faster start possible because steam can be injected in the gas turbine as quickly as it is produced, avoiding steam turbine warm-up requirements.. The critical question is - how rapidly can this be done versus what is needed. I really don't know on what time scale this sort of demand management matching is required but I think it sounds like a technical challenge rather than a fundamental one. For example - momentum alone would ensure that the power from a wind turbine wouldn't suddenly drop to zero. What's more (and I don't know if this is done) surely a little bit of intelligently designed anemometry could be used as a short term predictor and signal to the grid that the wind turbine/farm was about to drop the load and spin up a gas turbine ahead of time. Perhaps there is someone who reads this site who could advise on the time scales required? Can we advance the debate by seeking solutions to the problems of renewables? -
Albatross at 00:42 AM on 5 July 2011Monthly Climate Summary: May 2011
Michael, Thanks for this-- well, I think....pretty depressing actually. And "skeptics" actually believe that we "warmists" find cheer in these findings? No. -
mspelto at 00:21 AM on 5 July 2011Trouble Brewing in the North
A wall of ice of that weight would be 300 feet tall and 300 feet wide. This is less than the 1/3 volume of the iceberg that came off of Petermann Glacier last year, they could have just chopped this up. It is one seventh the volume lost from Jakobshavn each year. -
Arkadiusz Semczyszak at 23:53 PM on 4 July 2011Great Barrier Reef Part 1: Current Conditions and Human Impacts
Perhaps[ -snip -]Moderator Response: (Rob P) Re-posting dubious links that have previously been debunked is considered trolling. Please desist. -
warm at 23:03 PM on 4 July 2011Trouble Brewing in the North
New article this week: http://www.sciencedirect.com/science/article/pii/S092181811100097X "There has been a rapid acceleration in ice-cap melt rates over the last few decades across the entire Canadian Arctic. Present melt rates exceed the past rates for many millennia. New shallow cores at old sites bring their melt series up-to-date. The melt-percentage series from the Devon Island and Agassiz (Ellesmere Island) ice caps are well correlated with the Devon net mass balance and show a large increase in melt since the middle 1990s. Arctic ice core melt series (latitude range of 67 to 81 N) show the last quarter century has seen the highest melt in two millennia and The Holocene-long Agassiz melt record shows the last 25 years has the highest melt in 4200 years. The Agassiz melt rates since the middle 1990s resemble those of the early Holocene thermal maximum over 9000 years ago." -
John Brookes at 22:40 PM on 4 July 2011Glickstein and WUWT's Confusion about Reasoned Skepticism
Nice post - thank you. -
mspelto at 21:24 PM on 4 July 2011Trouble Brewing in the North
The Penny Ice Cap is one of the key ice caps on Baffin Island and its outlet glaciers are certainly in retreat in response to the mass loss, which generates thinning. -
peter prewett at 17:23 PM on 4 July 2011German Energy Priorities
There is a posting on the BBC's web site on Nuclear: A tortuous timescale at:- http://www.bbc.co.uk/news/science-environment-13993997. There is a link on that page to the decommissioning of Oldbury Nuclear power station, the timeline is horrifying as the work will not be completed for another 100 years. That is if there is the manpower and oil to drive the equipment needed.Response:[DB] Fixed html in broken link.
-
From Peru at 17:18 PM on 4 July 2011German Energy Priorities
The future of energy is in renewables plus renewable nuclear. The current nuclear power plants use nuclear FISSION of either Uranium (specifically the U-235 isotope) or Thorium (actually Thorium-232 initially reacts with a neutron to form U-233, that unlike Th-232 is fissible): They are obtained as Uraninite-Thorianite ores (ThO2-UO2) or Cerium Monacite ores((Ce,La,Nd,Th)(PO4)) that must be mined and then processed.
This means that there is high use of energy in the process of extraction and processing, and also huge amounts of waste are produced. The process for nuclear fuel is the following:
They are obtained as Uraninite-Thorianite ores (ThO2-UO2) or Cerium Monacite ores((Ce,La,Nd,Th)(PO4)) that must be mined and then processed.
This means that there is high use of energy in the process of extraction and processing, and also huge amounts of waste are produced. The process for nuclear fuel is the following:
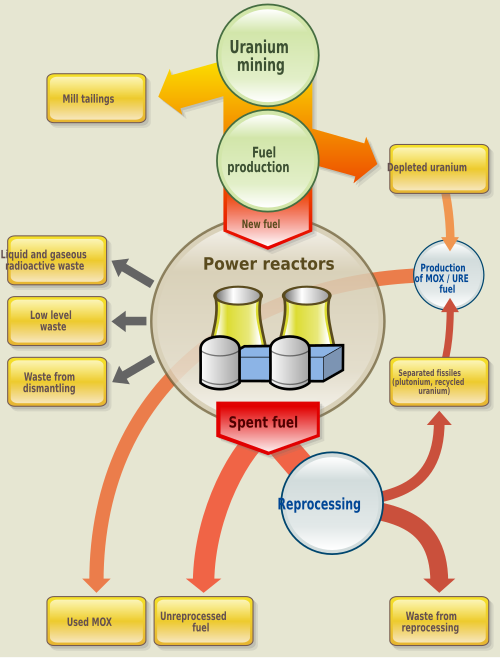 Among the residues are the mill tailings, the depleted uranium (U-238) and most important, the highly radioactive (unlike the original U and Th) spent fuel.
-
Michele at 17:02 PM on 4 July 2011The Planetary Greenhouse Engine Revisited
@ Patrick … (what physics could cause two radiating levels independent of composition and at odds with temperature) … For the radiative sweeping of the wasted energy, we have two spatial locations defined by the thermal orography of the planetary atmosphere. If we analyze the temperature profile we can view very well its likeness with an unique closed drainage basin (Venus) or with two closed basins (Earth), divided between each other by a watershed (stratopause) where the showered water converges to a single/double bottom valley lake which behaves as a sink and disposes of the collected water by evaporation (phase transition) and where the level of the water will be determined by the balance of the incoming/outgoing mass. Well then. Where is it the physics inconsistency? -
adelady at 16:06 PM on 4 July 2011Lindzen Illusion #4: Climate Sensitivity
"... still show climate sensitivity less than 1°C for doubled CO2." How much less, may I enquire? We've already had 0.8C for a 'mere' 40% increase in ppm CO2. By my reckoning, less than 1C must mean 0.97, 0.9, 0.85, 0.88, 0.85. Looks to be coming up pretty soon. Probably before 50% increase in concentration. Has anybody ever asked him directly how he could explain getting past 1C increased temp with 50% or less increase in CO2 concentration? (Even 60 or 70%.)Response:[DB] "Has anybody ever asked him directly how he could explain getting past 1C increased temp with 50% or less increase in CO2 concentration?"
-
adelady at 15:48 PM on 4 July 2011Google It - Clean Energy is Good for the Economy
Camburn "...one area close that has no dams on it right now. Yellowstone River. In my travels, I know the Missouri could have more dams." Why do we need power generation to always trash the environment it's taking total advantage of? Surely run-of-river would be a more sensible, multi-use option than dams sacrificing farmland, forest or wilderness. (Should point out I'm presuming that these rivers actually flow at a reasonable pace rather than wander leisurely across a flat landscape the way our River Murray does.) -
quokka at 12:35 PM on 4 July 2011German Energy Priorities
Err... that should be EROEI not EREOI.
Prev 1622 1623 1624 1625 1626 1627 1628 1629 1630 1631 1632 1633 1634 1635 1636 1637 Next


