


 Arguments


Recent Comments
Prev 1635 1636 1637 1638 1639 1640 1641 1642 1643 1644 1645 1646 1647 1648 1649 1650 Next
Comments 82101 to 82150:
-
Norman at 22:43 PM on 1 July 2011OA not OK part 1
DB @ 13 Will do. -
JMurphy at 22:35 PM on 1 July 2011Arctic icemelt is a natural cycle
This St. Roch nonsense has been done to death many times before, even on SkS. Any way of searching, so that reference can be made to the last thread that went through all this ?Response:[DB] Would you care to write up and contribute a guest post on that topic? :)
-
dawsonjg at 22:28 PM on 1 July 2011Climate half-truths turn out to be whole lies
JC = John Cook’s Age piece JD = my comments. JC Half the truth on emissions John Cook June 28, 2011 Cherry-picking the evidence to suit a pseudo-scientific argument misses the alarming reality. A Yiddish proverb states ''a half truth is a whole lie''. By withholding vital information, it's possible to lead you towards the opposite conclusion to the one you would get from considering the full picture. JD Absolutely right. For example, the 20 years and billions of dollars spent looking for a man made cause of climate change proves nothing until as much effort is exerted looking for alternative explanations. JC In Bob Carter's opinion piece on this page yesterday, this technique of cherry-picking half-truths is on full display, with frequent examples of statements that distort climate science. JD Read: “that contradict our man-made climate change narrative”. ( - Snip - )Response:[DB] Long Gish Gallop snipped. Please see JMurphy's kind and instructive advice to you below.
Please also read and comply with this site's Comment Policy. Comments that do not get moderated.
-
JMurphy at 22:23 PM on 1 July 20112010 - 2011: Earth's most extreme weather since 1816?
The dismissal of evidence and search for other explanations, reminds me of an analogy where acceptance of the facts is also too much to bear : Shortness of breath ? "I've been short of breath in the past. In fact, I've had worse episodes after running." Wheezing ? "Must be related to the shortness of breath, as it has been in the past." Nausea ? "It's nothing. I've had worse nausea in the past, especially after several beers." Vomiting ? "Obviously related to the nausea, which has easily explicable causes." Feeling light headed ? "Means nothing. Had it before. It's nothing." Pain in the left arm ? "I've had worse pain before and in the other arm too. Simple explanation is that it could be anything." Pain in the chest ? "I had worse pain last year and 10 years ago. So what ? Doesn't mean anything." "Hang on, put them all together and it could be a heart attack ! Why did I look at them all in isolation and dismiss the symptoms separately as nothing untoward or more serious than anything else I've experienced previously ? I must do something." Too late... -
alan_marshall at 20:30 PM on 1 July 2011OA not OK part 1
Doug Mackie @9 One of the skeptic arguments Sks seeks to rebut is "Ocean Acidifcation Isn't Serious". On 19 March 2011, Sks posted the intermediate rebuttal under the title "Examining the Impacts of Ocean Acidifcation". This article, which I authored, describes the ocean chemistry in a set of three equations, as well as in additional notes in comment 44. While I appreciate there is more chemistry to come in this series, and different ways to write such equations, I draw your attention to these earlier articles in the interests of overall consistency of presentation of the science on this site. The material from your series will not only form the basis of a booklet, but will also be welcome input to an advanced version of the rebuttal. -
Kevin C at 20:17 PM on 1 July 2011Roy Spencer on Climate Sensitivity - Again
Now that is a very interesting critique, thanks Chris! Let me make a fool of myself, having produced my own very simple model to estimate climate sensitivity, described in this post. In my defence: - Unlike Spencer I make no claim to authority in this field - I think I do a better job of assessing the limitations of my own work than him. - I am also, I hope, willing to learn from others critiques. Test me on this! Rationale: I like to test things for myself. I had already reproduced the ITR from the GHCN data, and the next project seemed to be to try and make my own estimate of climate sensitivity. I realised that I didn't have time to learn enough about the system to use a physics based approach, and so was limited to an empirical approach. Tamino's 'two box model' (also implemented by Lucia and Arthur Smith) has a bare minimum of physics - two heat reservoirs driven by the external forcing. However they had to pick values for the heat capacities. Refining the time constants of the exponentials is tricky and likely to be unstable. (Indeed when I tried it, it was). Arthur Smith also tried simply fitting an empirical response function composed of Gaussian basis functions in this post, which was my primary inspiration. I didn't really like the Gaussians though, because the long tails are not constrained by the short temperature record and yet contribute significantly to the sensitivity estimate. Additionally, Arthur's model is probably overparameterised. So I pared the model down to 5 quadratic B-spline basis functions on a log_{2.5} time axis, plus a constant temperature offset (total 6 params), and the constraint that the B-spline coefficients must be positive. The result is a climate sensitivity over ~60 years of just over 0.6C/(W/m2), or 2.1C/x2CO2. That's a lower bound because of the short period, assuming there isn't some mysterious negative feedback on a century timescale, and so fits in well with the IPCC estimates. That doesn't mean it's right. (To do: A transient sensitivity calculation.) However we know from Roy's previous exploits that 6 parameters is enough to not only fit the elephant but make it wiggle it's trunk. I tried to address this by the cross-validation experiments I showed (fit the model on 62 years, predict 62). I've more recently recognised that I'm also subject to the equilibriation problem, so those results are probably invalid (unless the model is in approximate equilibrium by chance at 1880 and 1942). Stability is another interesting question, which can also give an indication of overfitting. Is the model stable? Sort of. If I remember correctly it gives fairly stable results for teh response function for a start date of 1880 and end dates between 1940 and 1980, but with a lower sensitivity of 0.44 (1.6C/2x) over ~60 years. With a later end date this increases towards the value I quoted earlier. Of course the recent data contains the strongest signal due to the big increase in both CO2 and temperature, and some nice volcanoes. But that doesn't explain the stability of the shorter run values. That's interesting and needs further investigation. But the elephant in the room is the forcings. If the forcings are bigger, the sensitivity to give the same temperature change is smaller, and vice-versa. So I am completely dependent on accepting Hansen's forcing data. If the aerosol forcing were much smaller (less negative), and thus the total forcing more positive, the resulting sensitivity would be lower. Hansen actually suggests that the aerosol forcings should be greater (more negative) than they are, however. So the outstanding problems I can see at the moment with my DIY approach are: 1. I can't prove at the moment that the model is not over-fit. 2. The stable lower sensitivity of shorter runs, with a change in sensitivity when including the recent data, needs explaining. 3. I should probably try varying the aerosol effects and see what happens. So, if nothing else I've confirmed that it is hard. I may have produced a credible sensitivity estimate, but I can't prove it to my own satisfaction. I'll carry on playing with it. But maybe you can spot some more fundamental problems? -
alan_marshall at 19:53 PM on 1 July 2011OA not OK part 1
Doug Mackie @9 I'm with mb in being a bit puzzled about the formation of CaCO3 being described as a source of CO2 rather than a sink. That statement may be true in relation to equation 1 in isolation, but if the precipitation of CaCO3 removes carbon atoms from the water, where did those carbon atoms ultimately come from? Isn't the main source the CO2 absorbed from the atmosphere? I am looking forward to this series so perhaps we will read the answer down the track. -
skywatcher at 19:20 PM on 1 July 20112010 - 2011: Earth's most extreme weather since 1816?
#183 Stevo - very interesting insight into the human psyche there! It it possible to say that more of your audience gave the link between extreme weather and climate some thought because you presented the data before suggesting humans mightbe the cause? I suspect that if you had said something like "this human-caused global warming is driving severe weather, see this graph", more of your audience might have been incluned to avoid the evidence, their minds having shut up and gone home on mention of AGW. But by seeing the evidence first and acknowleding the trend, it might be rather harder for them to back out an pretend nothing is happening. It's a sad state of the politicisation of a scientific issue, but I have hope the people will observe the world changing around them, then wonder why? Harder to avoid the truth, then... -
Dikran Marsupial at 19:17 PM on 1 July 2011Roy Spencer on Climate Sensitivity - Again
Roy Spencers article on whether warming causes carbon dioxide increases clearly demonstrates he is unaware of the limitations of regression analyses. In that case we know 100% of the long term rise in CO2 is anthropogenic as natural emissions are always exceeded by natural uptake, yet Spencer's simple model says that the rise is 20% anthropogenic and 80% natural. It is sad that Spencer seems not to have learned from his previous errors; fitting a model to data does not mean the model is correct. -
Dikran Marsupial at 19:11 PM on 1 July 2011Roy Spencer on Climate Sensitivity - Again
If Spencer's model has some validity, then he will publish it in a reputable journal, if not, it will remain as a blog post and eventually be forgotten by all but the die-hard deniers. Much like his post on the rise in CO2 being due to ocean temperatures (the mathematical error in which was very obvious). In a way it is good that Roy is willing to share his ideas openly; in a less contentious area of science it would be a very good thing. Sadly in climate science it is likely that there are those who will uncritically cling onto the bad ideas as well as the good. -
Dikran Marsupial at 18:19 PM on 1 July 2011Websites for Watching the Arctic Sea Ice Melt
Camburn wrote: "One of the main reasons for this is the sine components within the measured and proxy temp record." Human beings are very good at detecting patterns where no pattern exists. Just because there appears to be a cyclical pattern in the data, doesn't mean that it is indicatve of some underlying physical process. This is especially true where the quantity of interest is affected by a number of different independent processes. In this case, temperature is affected by solar forcing, CO2 radiative forcing, aerosol cooling, ... and on top of that you have the effects of the various feedbacks. So if there is an apparent cycle, how can you tell whether there really is some underlying cyclical physical process. Just looking at the data can't tell you that; statistics can't tell you that (correlation is not causation); what you need is physics. Climatologists call this sort of work an "attribution study", for instance the IPCC attribute the warming of the first half of the 20th century to solar forcing, aerosol cooling cusing a levelling of of temperatures mid-century and CO2 radiative forcing dominant from 1970 or so. These three independent events give the appearance of a centenial scale cycle, but that is entirely spurious. As a statistician, I know that physics trumps stats, so I go with the climatologists who have explanations of why the climate record looks like it does, rather than statisticians/eye-ballers who attribute the climate record to unexplained "climate cycles". -
scaddenp at 17:54 PM on 1 July 2011Oceans are cooling
Hansen is not so coy - the 2011 paper analyses the "flat" OHC. (And 0-2000 is not flat). Within that framework, he also makes prediction for what OHC will imply for global energy balance over the full cycle (a prediction of less than 10 years, and yes, he expects OHC to increase and within given bounds). If Hansen is right (ie the GCMs are right), then we have energy imbalance. You cant blame ocean cycles moving heat around because whole ocean is warming. TSI is flat (do you mean this Svalsgaard paper? Low early 20C solar would imply higher CO2 sensitivity wouldn't it?). Enough to change your position? On the other hand, if OHC decreases over that period, I would say climate theory needs a serious overhaul. -
Norman at 17:25 PM on 1 July 20112010 - 2011: Earth's most extreme weather since 1816?
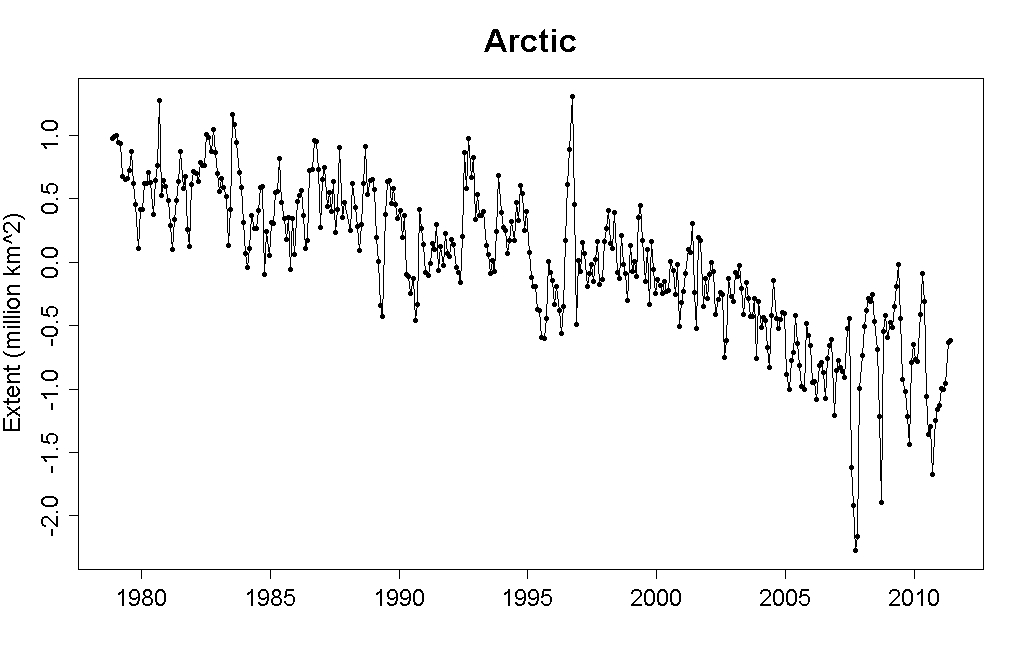
Albatross @ 182 "curious coincidence? Unlikely. And I for one am incredibly tired of people alleging to post here in "good faith" when all they appear to be doing is regurgitating stuff from a highly questionable political document prepared in the guise of science. And that said regurgitations do not even accurately represent the findings of the original paper or are not applied in context." Sorry to disappoint but I have not heard of NIPCC report until I went to your Tamino link. It is not that curious of a conincidence. I go on Google and put in key phrases looking for historical data. I am seeking peer-reviewed publications. It is an easy coincidence. The claim made is that droughts are increasing and intensifying. So I put in the History of droughts and other search titles looking for .pdf material (seems a better chance for peer-review or at least well explained data, usually good graphs and detailed explanations of how data was collected and compiled and maybe good statistical analytical tools). The compilers of NIPCC report would probably be doing the same thing...looking for .pdf files for their material on droughts, flooding, hurricanes, tornadoes, all the typical events counted as weather extremes. They would be able to find the same articles. I do not understand your point ("And that said regurgitations do not even accurately represent the findings of the original paper or are not applied in context") based upon my posts. I post a link to the article, read the material and then look at the graphs. I then ask you to tell me where is an obvious trend that indicates an increase in frequency, intensity or duration of historical droughts in North America. You know Tamino uses his "eyecrometer" with his graphs on arctic ice loss. Here is his posted arctic ice graph Tamino Arctic ice graph. What he says about this graph. "Identifying a change in Arctic sea ice extent that can be attributed to temperature is as easy as looking at this graph:" Note also in this post by Tamino, he goes on to show how statistics and trend lines can easily be distorted to show a false picture of reality. That is why I am seeking very long trends and just posting the graphs. Because of the nature of my posts I still would like to understand "And that got me thinking about the fairly steady stream of papers being posted by "skeptics" (e.g., Norman)on this thread trying to convince people that there is nothing un-towards or unusual going on with the climate system." I am not trying to convince you of this, I am posting the information and asking for you to explain to me an upward trend in the data provided. If it is there, I am fine with it. A simple request I would think. Last one. Can you clarify this statement as I think the last sentence is about my posts.... "I will also note that one of the papers that they (NIPCC; Idso and Singer) cite in reference to drought in N. America is being used for purposes not intended by the authors. I happen to know the authors of the paper in question and I know for a fact that they are not "skeptics" or in denial about AGW. So these it is worrisome to see Idso and Singer to misrepresent the science in papers that actually do not go against the theory of AGW. And worse yet, to see uncritical "skeptics" perpetuate the misinformation and distortion." What misinformation and distortion am I perpetuating? Here is the content of my post @140: "Here is one with droughts across North America. In the text they explain that the causes of drought in North America were also responsible for Global Climate patterns (more rain in some areas droughts in others). From this study it states there were much worse droughts in the past than today. They also have graphs at the end of the article which show 1000 years of droughts. I would challenge you to find an increase in frequency of droughts today as compared to the long 1000 year history." Here is a direct quote from their conclusion (Paper on 1000 year droughts posted @ 140): "Many of these reconstructions cover the last 1000 years, enabling us to examine, in detail, how the famous droughts of modern times compare to their predecessors during a time of quite similar boundary conditions (e.g. orbital configuration). Upon examination, what becomes apparent, is that the famous droughts of the instrumental era are dwarfed by the successive occurrence of multi-decade long ’mega-droughts’ in the period of elevated aridity between the eleventh and fourteenth century A.D. Whilst these mega-droughts stand out in terms of persistence, they share the severity and spatial distribution characteristics of their modern-day counterparts." My question asked for evidence of increased frequency, intensity or duration. The mega-droughts were of the same intensisty but had a much longer duration.Response:[DB] "You know Tamino uses his "eyecrometer" with his graphs on arctic ice loss."
Note also that Tamino always performs background analysis to check for significance, which work, sadly, he does not always show). But he always performs them anyway.
-
adelady at 17:02 PM on 1 July 20112010 - 2011: Earth's most extreme weather since 1816?
Norman "... a list of extreme weather events of 2010 without at least investigating other years and long term climate patterns of given regions?" What you seem to be overlooking is that 'extreme weather events' include 'long term climate patterns' of all the the places mentioned, by definition. Everyone would probably accept that my local, record-breaking 1 in 3000yr heatwave event of a few years ago counts as hot by almost anyone's notion of hot weather. But more recently, Sydney had a record heatwave, temperatures nothing like ours, but devastating nevertheless. (It's probably a fairly subjective judgment whether 40C+ with literally breath-taking <15% humidity feels worse than 32C at >70%. After a week, nobody really cares.) Heatwaves are defined as x degrees above local climate norms for the time of year. Excessive rainfall likewise. After all, monsoons are 'normal' in some places. Here normal monsoon rainfall would be unbelievable. In Adelaide at any time of the year, an overnight minimum of -1C would set a record - Canadians would laugh themselves sick at that idea. Queensland flooded in the Gulf country around the same time as the devastating floods in SE Queensland. Only the SE floods count as extreme. The floods in the north might have been a bit on the high side of normal (I don't even know) - but they don't count as extreme because flooding is normal for that area in that season. Extreme events are anomalous - by definition. If you want to check meteorologists' reports for those areas for 100+ years, you're setting yourself a large, and largely futile, task. -
Tom Curtis at 16:42 PM on 1 July 20112010 - 2011: Earth's most extreme weather since 1816?
Norman @184, the information you are after can be found from Loew and Wirtz, "Structure and needs of global loss databases of natural disasters". Loew and Wirtz describe the classification system used by Munich Re. The categorise by disaster type, by the quality of the source information, with events documented from low quality sources not included in the data base for analysis, but retained in case of confirmation, and by the "disaster category". The disaster category is a scale from 1 to 6, with one being from 1 to 9 deaths, and/or minor damage; 4 being a Major Disaster, more or less as defined by Neumayer and Barthel, but with a stepped scaling for property damage; and 6 being a Great Natural Disaster, ie, a Great Natural Catastrophe as defined by the UN. More information can be found in this Munich Re document, which includes a category 0 for not fatalities/losses, ie, a natural hazard. I presume category 0 events are retained on the record but not included in the data base. -
Bibliovermis at 16:25 PM on 1 July 2011The greenhouse effect is real: here's why
HenryP (#49), From your site: if an increase in green house gases is to blame for the warming, it should be minimum temperatures (that occur during the night) that must show the increase (of modern warming). In that case, the observed trend should be that minimum temperatures should be rising faster than maxima and mean temperatures. That is what would prove a causal link. --- From this site: post-1970 results show monthly-minimum temperatures rising faster than monthly maximum temperatures. These results are entirely consistent with greater CO2 forcing later in the century than earlier. --- A Quick and Dirty Analysis of GHCN Surface Temperature Data (paragraph above Figure 3) -
Norman at 16:20 PM on 1 July 20112010 - 2011: Earth's most extreme weather since 1816?
Stevo @ 183 "Norman @178 The trouble with the eyecrometer is that it is entirely subjective and prone to cherry picking." Is that really the case? Here is a graph of all the major temp records of the globe. Major global temp graphs combined. Would your "eyecrometer", looking at this graph, not conclude the Globe is warming? For large and obvious trends statistical analysis is not necessary, the eyecrometer does fine. How could one subjectively claim that the graph does not indicate global warming? If you look at many of my posts, I am attempting to find peer-reviewed articles or at least ones with indepth explanations of large regions. Sometimes difficult to find. Why would this qualify as cherry=picking? Cherry Picking. “Choosing to make selective choices among competing evidence, so as to emphasize those results that support a given position, while ignoring or dismissing any findings that do not support it, is a practice known as “cherry picking” and is a hallmark of poor science or pseudo-science.” – Richard Somerville, Testimony before the U.S House of Representatives Committee on Energy and Commerce Subcommittee on Energy and Power, March 8, 2011 [1] "Good science looks at all the evidence (rather than cherry picking only favorable evidence), controls for variables so we can identify what is actually working, uses blinded observations so as to minimize the effects of bias, and uses internally consistent logic."" I have stated what my goals are with my many posts. Would it not be cherry-picking to accept a list of extreme weather events of 2010 without at least investigating other years and long term climate patterns of given regions? Jeff Masters did good research work to compile his list of extreme weather events for 2010. Now it is my research work to see if the extreme weather events for 2010 are really so extreme in a historical context. If you agree that you can see global warming from the temp graphs using your eyecrometer, than why is it subjective to look for obvious trends in other data? Lastly, I am still in the process of figuring out the Munich Re disaster list. I am in need of a clear definition of a disaster as used as a number in the graphs. -
Albatross at 16:10 PM on 1 July 2011Climate half-truths turn out to be whole lies
Nicely done John Cook. Carter should be ashamed. -
MoreCarbonOK at 16:04 PM on 1 July 2011The greenhouse effect is real: here's why
Well you clever guys. If I were you I would still have a peek at my new and updated pool tables. http://www.letterdash.com/HenryP/henrys-pool-table-on-global-warming No junk science there. No hypothesis. Actual results from actual measurements> Quite interesting results, too. I have split up the NH and the SH. Any ideas on the differences between NH and SH?Moderator Response: [Dikran Marsupial] IIRC, it has already been pointed out to you that the difference in NH and SH trends is probably due to the unequal distribution of land mass between the two hemispheres. The problems with your pool have also been pointed out to you, repeatedly. Please do not repeat that discussion here, if you want to discuss your pool, please read the excellent series of posts by Glen Tamblyn (starting here), and if you still want to argue that your method is best, then first you need to explain why the methods used by the climatologists, who have looked into the issues in great detail, are defficient. That discussion should be posted on one of the articles in Glen's series, not here. -
Norman at 15:56 PM on 1 July 20112010 - 2011: Earth's most extreme weather since 1816?
Rob Honeycutt @179 I read your train analogy. It is simialar to the one posted by Sphaerica @ 88 about falling out the window of a tall building and assuming everything is alright until you hit the ground. I did post a reponse to Sphaerica @ 96. If you read my post it will demonstrate I am indeed wanting to move away from fossil fuel and find alternate replacements that can not only maintain a high standard of living for industrial nations but for all the people on Earth. Fossil fuels (even without CO2 byproduct) could not meet the need of raising the standard of living for all people. Your quote "Norman @ 178... Your comment here contains a common theme that I see in those who wish to dismiss climate change as man made and a serious issue." I do not believe any of my posts suggested that climate change was not man made or that is a position I advocate. Man is releasing a large amount of CO2 while destroying some carbon sinks, that is factual information. CO2 has been empirically demonstrated to redirect IR in its absorption bands (measures of down-welling longwave radiation and also a lower amount of IR in these bands being emitted to space as measured by orbiting satellites). It could even be a serious issue in the future. My posts are a basic challenge to the linking of extreme weather events to global warming without providing the actual mechanisms that would verify this conclusion. An extraction of Jeff Masters from Tom Curtis post @181 "But the ever-increasing amounts of heat-trapping gases humans are emitting into the air puts tremendous pressure on the climate system to shift to a new, radically different, warmer state, and the extreme weather of 2010 - 2011 suggests that the transition is already well underway." I am questioning if 2010 was really that extreme. The only way to do this is to look at historical weather information, to have something to compare it to. I am questioning if Global warming is causing a noticeable change in climate or weather patterns. Climate defined here. -
owl905 at 15:41 PM on 1 July 2011Roy Spencer on Climate Sensitivity - Again
A few years ago, Spencer forwarded the idea that the increased CO2 was released from the ocean as a natural response to heating. Now he's arguing for low sensitivity because of a missing heat buildup in the upper layers. His supporting 'model' is an icon to his scientific abilities. -
peter7723 at 15:34 PM on 1 July 2011Ocean acidification: Coming soon
I notice the first point is "OA is not OK", which assumes the question "Is OA OK?". That's fine, but answers are only "Yes" or "No". A better question is "What are the consequences of OA?", one impact being on calcium carbonate and the disadvantage this impact has. Are there other impacts to be explored? -
Camburn at 14:56 PM on 1 July 2011Websites for Watching the Arctic Sea Ice Melt
Thank you Tom. I have tried posting pictures, but have not had success at that yet. I do not dispute that there is less ice now than in 1944. What I was trying, and apparantly failing to present, was that in 1944 the ice extent had to be substantially less than say 10 years later. And for the St Roch to make the passage in 1944 was a feat unto itself. I read the link to Tamino's post. I have a couple of problems with how the data for ice conditions in the past was assembled, but nothing that would change the overall trend. Thank you again for posting the above. -
Norman at 14:52 PM on 1 July 2011OA not OK part 1
Heraclitus @12 My post was not a criticsm of a long series of post. Just wanting to make sure they do not leave this out in future discussions.Response:[DB] Your concern is noted, but misplaced and premature. Let us sit back and let the experts first share their knowledge before we students critique it.
That would be the scientific thing to do.
-
Camburn at 14:46 PM on 1 July 2011Oceans are cooling
scaddenp: The ARGO data has essentially been flat for the 0-700 meter area. If the data begins a warming trend I would have to look at the Aqua brightness, the solar winds etc to try and interpret the trend. If the data continues with the flat to cooling trend, then I am going to have to try to understand why. There are so many facets that affect OHC besides co2. Yet, the ocean is the "buffer" per se for our climate. To put it in a nutshell, I really have no position. If the ocean is stable to cooling,surface temps will follow. We are in an unusual situtation right now. Our atmosphere has shrunk by over 150 miles...which is huge. I am at the point where astro physisits have become much more interesting that climate scientists. I have studied climate as much as I can for decades. I had the premiss that the sun did not play a large part in the recent climate. I am not as sure anymore as the findings of even just the past 3 years have thrown a curve ball into what little I thought I knew. I asked Dr. Svalgaard to send me a link to his new paper on TSI, where he shows it has been virtually constant for well over the past century. That threw a curve ball into the early 20th century warming, and if it becomes accepted will throw a curveball into the GCMs. A rather rambling post, it is late here and I am tired. The best we can do is go with what teck shows us. -
Norman at 14:45 PM on 1 July 20112010 - 2011: Earth's most extreme weather since 1816?
Tom Curtis @ 180 I would like to respond to your good post about the earthquake events and I would like to demonstrate intellectual integrity. This line of reasoning is based upon your post of the Munich Re graph demonstrating an increasing number of weather related disasters. I suggested the possibility due more to population increase rather than climate change of more extremes. Before I can comment I need a really good definition of disaster. I looked at your Munich Re report and they did not give a definition of what they were using to build their charts. I looked at this web page... Is this Munich Re standard for Disaster classification used on their graphs you posted?. "International Strategy for Disaster Reduction (ISDR), at least one of the following criteria must be met: • a report of 10 or more people killed • a report of 100 people affected • a declaration of a state of emergency by the relevant government • a request by the national government for international assistance" 3 of these are absolute and easy to quantify. The 2nd one is elusive as it does not further define affected. Is this an injury? How bad of an injury? In my hometown a few years ago we had a strong hail storm that damaged many roofs in our community (including mine). At least 100 people had their roofs repaired so would this be listed as a disaster? Or say 100 cars in a parking lot during a hail storm that triggers insurance claims? Or a snow storm that does not cause any death but leads to 100 hospital visits caused by shoveling snow? Without a strong definition of what is counted as a disaster it becomes difficult to carry on this line of reaoning. If you are able to give a more certain definition of disaster I will be able to more reasonably explain my point on the earthquake vs weather related difference in slope on the Munich Re graphs. Thanks! -
OPatrick at 14:43 PM on 1 July 2011OA not OK part 1
Am I the only one thinking that criticising part 1 out of 18 of a series for being simplistic and missing things out is perhaps a bit pre-emptive? -
Tom Curtis at 14:38 PM on 1 July 2011Websites for Watching the Arctic Sea Ice Melt
Camburn @171, the following map shows the routes took in his two transits of the North West Passage: As you can see, in his east to west passage he took a northerly rout between Victoria Island and Parry Island, before diverting into the strait between Victoria Island and Banks Island.
Below is the September sea ice extent in 2010:
As you can see, in his east to west passage he took a northerly rout between Victoria Island and Parry Island, before diverting into the strait between Victoria Island and Banks Island.
Below is the September sea ice extent in 2010:
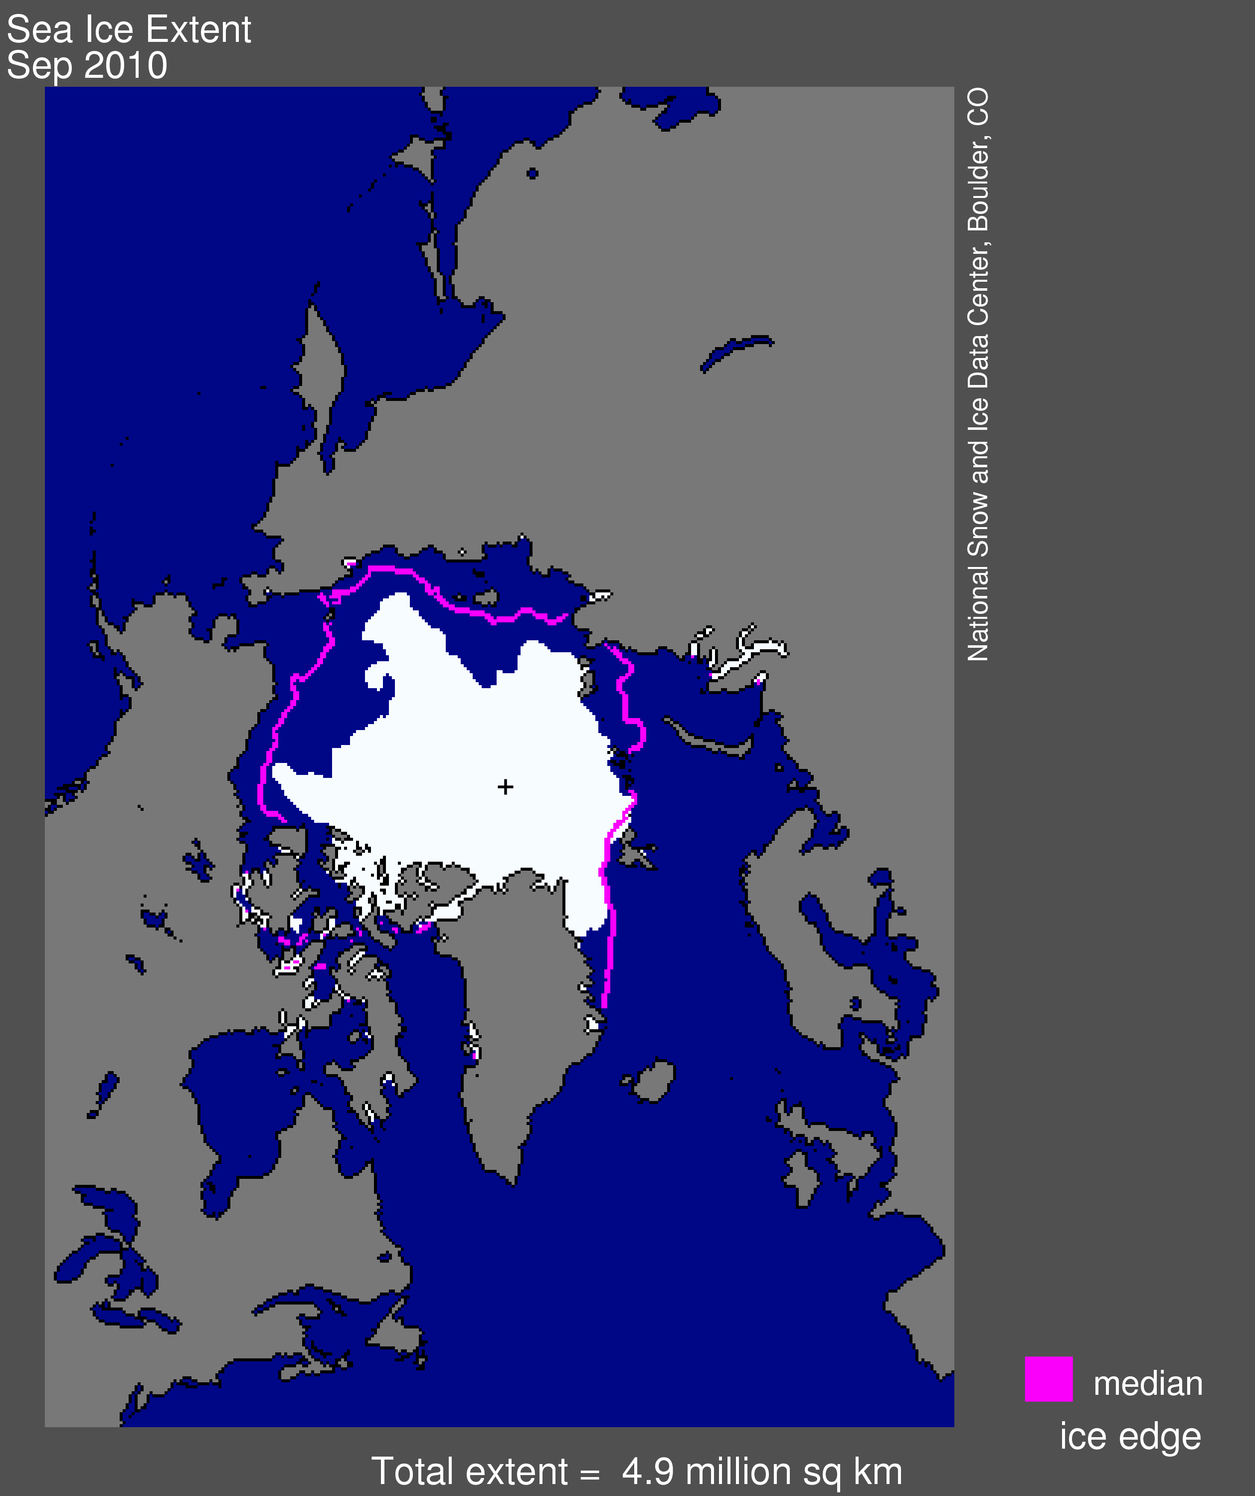 As you can see, the passage between Victoria Island and Melville Island is entirely clear of ice, as are the waters just north of Banks Island. Ironically, a thin hulled boat could not retrace Larson's route precisely because of ice in the strait between Victoria and Banks Island, but could easily traverse the more northerly rout. Larson traversed these waters during September, exiting Bering Strait on September 27th, so the ice record is directly comparable, and clearly there is much less ice than in 1944.
To put that into perspective, the following is the route taken by "Northern Passage" when it circumnavigated the Arctic in a single season in 2010, one of two sail boats to do so:
As you can see, the passage between Victoria Island and Melville Island is entirely clear of ice, as are the waters just north of Banks Island. Ironically, a thin hulled boat could not retrace Larson's route precisely because of ice in the strait between Victoria and Banks Island, but could easily traverse the more northerly rout. Larson traversed these waters during September, exiting Bering Strait on September 27th, so the ice record is directly comparable, and clearly there is much less ice than in 1944.
To put that into perspective, the following is the route taken by "Northern Passage" when it circumnavigated the Arctic in a single season in 2010, one of two sail boats to do so:
 The entire trip took 115 days, and just 26 days to transit the North West Passage. The other boat to complete the trip, the St Peter just beat them for the record of being first to complete the double transit in a single season. (And yes, I did notice that they in fact took the southern rout, I assume out of caution. But the ice would have permitted the northern passage.)
-
OPatrick at 14:15 PM on 1 July 2011Throwing Down The Gauntlet
Ah... I see. Note to self - choose red in future.Response:[DB] Ex-actly.

-
scaddenp at 14:05 PM on 1 July 2011Websites for Watching the Arctic Sea Ice Melt
#172 - Camburn, I have responded here -
scaddenp at 14:03 PM on 1 July 2011Oceans are cooling
Camburn, good to see you agree on value of the Argo instrumentation. Hansen has taken a punt on what he expects OHC to do over next few years. What's your position if he turns out to be correct then? -
Camburn at 14:01 PM on 1 July 2011Arctic icemelt is a natural cycle
DB: Note I said the NE passage when talking the Komet. Sorry, but I don't go to climate 4u. skywatcher: Where have I posted that there is not a sharp decline presently in Arctic Ice? I have posted papers that show the variability in Arctic Ice over a long time period. I will state again, for Capt Larson to have made the voyage in 1944 was a feat and a testament to the conditions that year. This also coincides with the period that Greenland had temperatures just slightly lower than present. Here is the route of the St Roch. Note that it went between Banks Island and Victoria Island. Watch the ice this summer and see if this lane is ever passable. Norther RouteResponse:[DB] I looked up your comment:
"During WW2, the Northest Passage was also sailed by German Warships......remember? If you don't you can look it up. Some simple history items are well known."
Fortuitous typo? A thinly veiled attempt at a snarky witticism? Be it known that your narrative you are pursuing is from the Climate4you/WUWT/CA playbook and that our patience with it...grows thin.
From time to time you show signs of being an actual skeptic and then you return to form. So be it.
Please support assertions with links to peer-reviewed science, construct your comments to comply with the Comments Policy and also ensure that they are on-topic in the future.
-
skywatcher at 13:55 PM on 1 July 2011Websites for Watching the Arctic Sea Ice Melt
#149 Philippe,, #159 Eric - interesting that 2011 does not show the same sharp decline in June, yet at the end of June, 2011 lies below 2007 on the IJIS graph. Whether it remains so will depend on the melt rate and wind patterns in July. The data for ocean temperatures do not look encouraging for ice retention this year, and when put together with this recent article by Peter Sinclair, it's not encouraging news. #166 Camburn, it's helpful if you want to link to something, especially if it's behind a paywall/a book, that you either summarise the source or provide a quote, or else we have no idea why you have linked to a source, or if the source is relevant at all. As you have not even provided a page reference, let alone any material with which we could evaluate the source (despite repeated requests), I am forced to conclude you don't have much evidence to support your point of view. I can assure you you won't taint my understanding by actually providing information that supports your point!Response:[DB] To further your point, comments consisting of links without a demonstration of an understanding of the materiel linked to as well as a sharing of why the information therein is important (GUTFC: give us some context as to why its important) simply beg for deletion.
-
skywatcher at 13:32 PM on 1 July 2011Arctic icemelt is a natural cycle
#35, also worth reading Polyak et al and associated data links within to get a context of Arctic ice variability over the past century and also Holocene. You're embarrassing yourself by suggesting that there has been anything other than a sharp decline in Arctic ice since about the 1970s. The last time extents were as low is reasonably well-constrained by dating of wood on old shorelines and of wood trapped in ice shelves - several thousand years ago. [caused by higher Arctic insolation in the early-mid-Holocene]. As Michael Sweet and Bibliovernis have shown, there is no evidence that ice levels in the 1940s were anywhere near today's levels. Anecdotes of sailors commenting on the lack of ice have to be placed in context - a context of a very large amount of ice up there in the early part of the century. Their 'lack of ice' could easily be a great deal of ice by today's standards. A bit like a Scot thinking a day of 20C is hot, which makes sense if you live in Scottish summers, but would make no sense for somebody from Italy! -
dana1981 at 13:24 PM on 1 July 2011Roy Spencer on Climate Sensitivity - Again
What really irritates me, which Chris touched upon in the article, is that after Spencer comes up with these 'silver bullets' based on oversimplified models and over-tuning of parameters until they're no longer physically realistic, he then claims that he's the only one who "gets it" and other climate scientists are either stupid or ignorant or hiding something. He doesn't consider the possibility (reality) that he hasn't made a valid physical argument. Hence the aggravating quote:"These folks will go through all kinds of contortions to preserve their belief in high climate sensitivity"
Yes, all kinds of contortions like doing real physics with reasonably realistic models. Such contortions! -
Stevo at 13:07 PM on 1 July 20112010 - 2011: Earth's most extreme weather since 1816?
Norman @178 The trouble with the eyecrometer is that it is entirely subjective and prone to cherry picking. My eyecrometer looks at the last year and sees a series of work trips to remote sites cancelled due to floods in Queensland and Western Australia, my home town of Brisbane flooded, and a return trip from a desert site where we had to push vehicles across five kilometre wide puddles while up to our arsecrometers in flood water. When the subject came up recently amongst my colleagues about the frequency of extreme weather events I showed them the graphs presented by Tom Curtis @55 on this thread. Eyebrows were raised and comments were made that there was proof of a trend over time towards more extreme events. The question was asked about what might be causing this. When told the answer was that it was a likely outcome of AGW and was consistant with scientific predictions, half the peopled gathered just walked off in a huff mumbling about lefty conspiracies and the other half stopped and gave the matter some thought. Our groups' observations of local problems due to weather were just cheerypickings until they could be incorporated into a broader picture. When that picture was revealed in the form of a graph, all were initially convinced that there was a pattern developing. Once AGW was identified as the cause the denialists broke away and claimed it must be some kind of political fabrication. Like I said, its all subjective. The eyecrometer is simply not enough to go by. -
Bibliovermis at 13:00 PM on 1 July 2011Arctic icemelt is a natural cycle
The catamaran passage wasn't a freak event either. 30 recreational boats have completed the voyage in the past decade. The ease of passage through the Northwest Passage is a matter of significant political importance for Canada, the US & Russia. Parliament of Canada: The Northwest Passage and Climate Change -
Chris Colose at 12:52 PM on 1 July 2011Roy Spencer on Climate Sensitivity - Again
There's no ocean physics. All he's doing is tuning several parameters in his "model" to match observations or a particular AOGCM. There are models that don't have 3-D ocean physics which have credibility (of course, depending on what you're trying to do with it), but Spencer's work is well below this level and is simply not credible. Some of the models I listed can be played with by anyone on a PC and have more realism, but even something like EdGCM is well below what is in today's models. Spencer has a long history of making sweeping statements about "big issues" (like climate sensitivity) completely independent of whether he has the data to justify those statements, but he hasn't set up any paradigm shift in the community. I don't suspect he will either. -
Norman at 12:51 PM on 1 July 2011OA not OK part 1
This one is old 1972, but if the experimental method described is sound the science is still good regardless of the date the experimentation was done. According to the author, sea water is a much more complex beast than the equations posted above. The other ions in water (such as Magnesium and Sulfate among others) influence the pH buffering system of seawater. Buffering action of sea water. A point made from author's perspective: "Control of pH in this fashion is by means of a pH-stat rather than through a buffering system. The capacity of the system is huge; at 348 ppm CO2 in the gas phase, a concentration reasonably near the normal CO2 content of the atmosphere, the extreme difference in ionic compositions produced a difference of only 0.25 pH units. Over the extreme range of CO2 concentrations, O-696 ppm, the largest pH difference was 1.4 pH units. For scawatcr with normal ionic ratios, a doubling of the CO2 content of the air would lead to a change of only 0.30 pH units an amount about cqual to the normal range of variation of seawater pH." The purpose of this post is to make sure not to miss the reality that the processes going on with seawater are more complex than a few equations. -
Bibliovermis at 12:43 PM on 1 July 2011Arctic icemelt is a natural cycle
In 2007, a lightweight catamaran made the 3,200-mile Northwest Passage voyage entirely by sail. Peter Semotiuk, who runs a single-band sailor's radio network at a port in the middle of the passage, completed the voyage in 1988 and said: "This summer [2007] the passage was largely wide open. It's a very different picture to say 20 years ago, when I travelled the length of the passage." Corporal Henry Larsen's St. Roch was made from extra thick timbers of Douglas Fir, sheeted in Australian gumwood and powered by a diesel engine. University of Calgary: The Larsen Expeditions BBC: Plain sailing on the Northwest Passage -
Trueofvoice at 12:40 PM on 1 July 2011Roy Spencer on Climate Sensitivity - Again
I apologize for my ignorance, but when you say Spencer is modelling purely on ocean diffusion, do you mean he assumes heat evenly diffuses throughout the seas without considering upwelling, convection or conduction? -
adelady at 12:06 PM on 1 July 2011Arctic icemelt is a natural cycle
Fortuitously, Peter Sinclair has just posted this item on why the melt is so fast. Yet another reminder that air temperature and SST cannot give us the whole story. -
Camburn at 12:01 PM on 1 July 2011Arctic icemelt is a natural cycle
michael: Capt Larson made the voyage in 1944 through the northern route. Even last year his route was not passable. Live with it, it is history. IF you lived near the Arctic, you may know that the Canadian Coast Guard replenishes supplies on an annual basis to the northern stettlements. It has been doing this for decades. Just the way it is. During WW2, the Northest Passage was also sailed by German Warships......remember? If you don't you can look it up. Some simple history items are well known. How can I question cyrosphere? Quit easily. It is a graph posted with no supporting data prior to 1979. Sorry that my 3.5 prediction with the support of the Shindell/Schmidt paper, russtles your feathers it seems.Response:[DB] Assertions without links to sources will be disregarded. IIRC, the Komet took the NE passage, not the fabled NW passage (so even that does not help you).
BTW, Climate4you is a blind guide: it will lead you astray.
"How can I question cyrosphere? Quit easily. It is a graph posted with no supporting data prior to 1979."
Study this link for a history of Arctic Sea Ice, how to find the data on it...and how to properly analyze it.
Or you can email your questions to the good people at the Arctic Climate Research at the University of Illinois here: cryosphere-science@atmos.uiuc.edu
-
michael sweet at 11:50 AM on 1 July 2011Websites for Watching the Arctic Sea Ice Melt
Camburn, I posted a response here. -
michael sweet at 11:48 AM on 1 July 2011Arctic icemelt is a natural cycle
Camburn, You need to stop posting gibberish about things you do not know. This Wikipedia article documents that the entire Northwest passage was ice filled until 10 years ago. Your assertion that it has been passable by non-icebreaking vessels for decades is simply untrue. Capt. Larsens voyage has been replicated in recent years, in only a few weeks to make the passage, it is no longer remarkable for a light icebreaker to transit the NW passage. It is remarkable that someone who posts so little data is so fast to question scientists who actually measure the Arctic ice. How can you question that work when you have no idea how they measured it? -
GrahamC at 11:43 AM on 1 July 2011OA not OK part 1
Doug, I still can't see justification for your claim that the fromation of calcium carbonate is a source of carbon dioxide, not a sink. Could you please explain it to me again, including the formation of the bicarbonate ions in your explanation? -
adelady at 11:42 AM on 1 July 2011Websites for Watching the Arctic Sea Ice Melt
Eric "...the North Atlantic is particularly cold this year, and will not provide warm waters to increase melt." But the far North Atlantic is not so congenial. Check out this animation of DMI/COI SST anomalies for June as shown at the Arctic Sea Ice blog mentioned in the post. -
Doug Mackie at 11:33 AM on 1 July 2011OA not OK part 1
We are gratified that some find this simplistic. However, the quality of comments at this blog and elsewhere suggests that there are many who do not find this chemistry simple at all. @mb: Yes you are missing something. You are missing the point of this post which is that just because you can write a balanced equation does not mean it is a correct equation. Your set of equations is: What do you think happens to the 2H+ ?
Though we invoke it later ourselves, Le Chatelier's principle is no longer taught as such in most chemistry courses. Instead it is better to compare the equilibrium constant (K) with the reaction quotient (Q).
What do you think happens to the 2H+ ?
Though we invoke it later ourselves, Le Chatelier's principle is no longer taught as such in most chemistry courses. Instead it is better to compare the equilibrium constant (K) with the reaction quotient (Q).
-
Marcus at 11:28 AM on 1 July 2011Throwing Down The Gauntlet
Eric. No need for massive flooding to provide Hydro-electric power. There are a number of hydro-power options that don't require large dams or back-flooding. http://en.wikipedia.org/wiki/Small_hydro http://en.wikipedia.org/wiki/Run-of-the-river_hydroelectricity http://en.wikipedia.org/wiki/Microhydro_systems -
Dave123 at 11:26 AM on 1 July 20112nd law of thermodynamics contradicts greenhouse theory
I don't want to revive a dead thread, but I've noticed that the responses on 2-nd law violation tend to be a bit um... dry. So I thought of an analogy that might...err resonate. Consider pushing a child in a swing. You aren't strong enough to push the swing very far in one push. But each cycle of the swing you can push a bit more and the higher the child goes. The kinetic energy of the swing can greatly exceed what you've put in in any one push. However, eventually you reach a point where the energy you put into the swing is completely dissipated on any cycle.... the swing goes no higher. This isn't obviously an exact analogy, but reason you can have larger values of back radiation and surface emitted radiation than TSI is somewhat analogous to pumping a swing. Whether this will help people caught up in inventing their own versions of the 2nd law I dont know.
Prev 1635 1636 1637 1638 1639 1640 1641 1642 1643 1644 1645 1646 1647 1648 1649 1650 Next


