


 Arguments


Recent Comments
Prev 1681 1682 1683 1684 1685 1686 1687 1688 1689 1690 1691 1692 1693 1694 1695 1696 Next
Comments 84401 to 84450:
-
mike williams at 08:30 AM on 30 May 2011The Critical Decade - Part 1: The Science
[ Snip ]Response:[dana1981] Please take the time to familiarize yourself with the site Comments Policy. In particular "No off topic comments". This topic has nothing to do with cap and trade or Flannery's correct comment that while we can slow global warming, we're not going to cause cooling. If you would like to discuss Flannery's comments, take it to CO2 limits won't cool the planet
-
drrocket at 08:27 AM on 30 May 2011Solar Cycle Length proves its the sun
Re John Cook, 6/26/10, Solar Cycle Length A five parameter, causal filer of the Wang, et al. (2005) solar radiation model predicts the entire 140-year HadCRUT3 record of annual surface temperature with one standard deviation of 0.11ºC. With three parameters, the fit is 0.13ºC. See SGW. The accuracy is within 10% (variance reduction ratio of 79.0% vs. 89.3%) of IPCC's non-causal, smoothed estimate for surface temperature. Published 3/27/10, rev. 4/17/10. Is there a comparable result in all of climatology? -
les at 08:11 AM on 30 May 2011Climate Change Denial book now available!
44 - "You need to be a little more sceptical of people who have a personal axe to grind, and check 'facts' for yourself." Yes, indeedy. -
okatiniko at 08:09 AM on 30 May 2011The Critical Decade - Part 1: The Science
skywatcher, I'm not sure of what you're really doing - just comparing two trends with some arbitrary end points ? with a noisy signal, I guess you can easily adjust the end point to get an increase of the trend. But that's not what is usually considered as a significant acceleration - you have to compare the difference with the statistical uncertainty, at least. DB : thanks for the plots, but my question wasn't about the projections, but their validation. I mean, it's easy to plot the result of models, but when do you expect that the acceleration will be clearly measurable ? concerning SLR, what does this GIA stuff really mean ? is the "real", observed, SLR described by the curve with, or without, the correction ? but anyway, since the correction seems to be taken as a constant, it shouldn't influence the acceleration. So what's the current acceleration rate, say for the smoothed 30 last years ?Response:[DB] SLR plots from UCAR/NCAR need to have the corrections applied to them to account for regional isostatic rebound effects and seasonal effects to be properly filtered out. If using the unadjusted/improperly adjusted data, one risks writing posts on CO2 snow...

And from Church and White, 2011:

The Tamino posts I linked to were essentially validating the existent temperature records, not models or projections. Since the future hasn't happened yet (some existentialists are sure to quibble on this point), I supplied you with 2 links discussing 2 recent temperature scenarios, one by MIT and the other by the Royal Society (IIRC).
If you're asking for clues to recognize when shifts are occuring, then I would suggest monitoring the Mauna Loa CO2 monthly updates (you can also get CH4 updates there as well), the GISS temperature trends (updated monthly), droughts in the Amazon and the volume of Arctic Sea Ice lost each year relative to the mean and the trend. Also watch for papers on evapotranspiration changes, desertification, arable land crop productivity, etc.
CO2 and CH4 will give you some idea of temperature trends to come (30-40 year lags built-in to the system...we are currently experiencing the effects of the CO2 emissions of the 1970s now). The others will give you an idea of how much the rate of change is itself changing.
If the natural oceanic and land sinks decline in their ability to temporarily sequester anthropogenic GHG emissions (and there is some evidence that they already are), then that will be revealed in the Mauna Loa data. But keep this in mind: the past, while a guide, is no good indicator of future results WRT to climate and climate change. Temperature change and climate change are multifactorial; the change to come, as evidenced in the MIT and RS papers, is expected to be non-linear.
What to expect when? This is about as good a guess as any:

-
skywatcher at 07:38 AM on 30 May 2011The Critical Decade - Part 1: The Science
Camburn #56: You like cherries? especially extra(polated) juicy ones? Have you read Polyak et al 2010 and the attendant sources therein? You would see how picking a carefully-selected single site does not tell you about all the Arctic, and also a wealth of evidence pointing to Arctic sea ice being less extensive now than in several millennia. The graph from Kinnard et al 2008 would show you how ice extent would have to be ~1.5 million sq km (~18%) lower than in any other estimated extent from 1870-1960 in order to be comparable to the past few years. Much like individual logs of submarines surfacing in polynyas at the North Pole say nothing of overall extent, neither does a single log of a single journey in a single part of the Arctic.Response:[DB] To say nothing of logs detailing 12-15 meter thick ice...
-
skywatcher at 07:22 AM on 30 May 2011Climate Change Denial book now available!
This would be this Judith Curry or this Judith Curry? Sounds like she's plunked herself into a camp that doesn't require relying on hard evidence and science any more... Reading the RealClimate exchange where Judith Curry claims to support Montford's book with blog-like misinformation and outright falsehoods, then wonders why Gavin hammers her for her unfounded opinions, then claims she wasn't really having an opinion on the book, is both eye-opening and sad. She displays none of the expected critical academic traits in her treatment of climate science therein, and appears to fail to comprehend why the misinformation she presents is offensive to many. Sadly, she does indeed appear, through her very own words, to be a biased scientist. -
damorbel at 07:13 AM on 30 May 2011Of Averages and Anomalies - Part 1B. How the Surface Temperature records are built
I would like to echo post #1 To validate your procedure I suggest that you find what the actual correlation (in space and time) exists between the stations. At present the values for this parameter appear to be quite arbitrary. -
KR at 07:12 AM on 30 May 2011Clouds provide negative feedback
RW1 - You might be interested in Wylie 2005. They looked at various satellite measures of cloud cover over the last 20 years. The High Resolution Infrared Radiometer Sounder (HIRS) found no significant cloud trend, while the International Satellite Cloud Climatology Project (ISCCP), with slightly different instruments, found a slight decrease in cloudiness over that period. Keep in mind that while specific humidity (total amount of H2O) in the atmosphere may be rising with temperature, relative humidity (relative to the total amount air can hold at any temperature) may remain steady or even decrease. So - steady or decreasing clouds with rising temperatures, neutral or positive feedback to warming.Response:[DB] Fixed Link.
-
damorbel at 07:06 AM on 30 May 2011Of Averages and Anomalies - Part 1A. A Primer on how to measure surface temperature change
Re OP you wrote:- "Obviously both values don’t match what the correct value would be if station C were included, but the second method is much closer to the correct value." I am so glad you are able to say which is the 'correct' value for temperature; it seems fully in accordance with the principles of scientific climatology!Response:[DB] Glenn was using a specific simple example to illustrate the principles underlying the measurements of the temperature records. If you were thanking him for the clarity of the illustration and the sense it made, then you're welcome.
If, on the other hand, your had other, ideological, meanings for making your comment, then those ideological meanings and intimations have no place in the science-based dialogues here.
-
tallbloke at 06:34 AM on 30 May 2011Climate Change Denial book now available!
JMurphy@41 Perhaps instead of taking 'Deepclimate's word for what Curry actually said when I cheekily presented her with the T-shirt you ought to check for yourself. Isn't that what sceptical scientists do? http://www.youtube.com/watch?v=dCjTRgHWTMs Now, for a start, she wasn't speaking 'for herself' but recapitulating Josh the cartoonists charicature of her. Being the good sport she is, she took the gift in good humour, and brightened everyone's evening by making a laugh out of it. People from both sides of the debate are sat either side of her. It brought us together in laughter, and helped us overcome our differences. The working groups next day were noticeably more able to consult and generate statements on common ground together. This was a positive result. To twist the true situation (and remember, I was there, 'Deepclimate' wasn't) into some kind of accusation that Judith Curry is a biased scientist, is about as far from the truth as you could stray. You need to be a little more sceptical of people who have a personal axe to grind, and check 'facts' for yourself. -
Camburn at 06:13 AM on 30 May 2011The Critical Decade - Part 1: The Science
Being the museum, owners of the log of the St Roch, won't allow it to be digitalized and more readily available, I can only suggest that people purchase the book. It is available on the Vancouver museum site. Capt Larson did not say there was no ice, but I can say that he was very surprised at areas that there was litteraly no ice, where he thought passage would be extremly difficult. -
Camburn at 06:09 AM on 30 May 2011The Critical Decade - Part 1: The Science
In reference to the map: 1. The southerly route is used on an annual basis by the Canadian Coast Guard to replish supplies to the cities/outposts on the northern side of Canada. 2. The northerly deep sea route is much more desireable as a commercial route as the water is consistently deep. The area between Banks and Victoria Islands is somewhat treacherous. If the area to the north of Banks open to the Beaufort Sea, that would/could become the route of choice. The black carbon emissions from China/India etc are hastening the ice melt. When and IF the people wake up and demand cleaner skies and healthier lives, that source should become more of a marginal effect. The rate of growth in China of coal fired power plants with wide open smokestacks continues to boggle my mind, so within the next 10 years I don't see any decrease that will slow the melt of the Arctic. The black soot provides approx 4w/sq meter of loss of albedo. This is a huge amount. I don't know how to pressure China/India etc to clean up their acts. Only the people living there can do that. As far as other countries with a lot of charcol burning etc......that is extremely difficult as that is their main source of cooking and heating. This is an area that has only recently been studied, yet has been known about for a long time. The effects are devasting to say the least and the teck is here, proven, and veryyyyyyy benficial to overcome this. Not demanding and doing so is totally foolhardy. -
John Donovan at 06:09 AM on 30 May 2011Skeptical Science Educates My Students
I previously wrote to "apirate": But the phrase that struck me most of all in your response was the statement "The various science departments at that school are heavily slanted towards support of the AGW theory." I find that wording itself "heavily slanted". How can the faculty be "heavily slanted" if they agree with the current expert scientific consensus? Would we not expect that a science faculty agrees with current scientific expertise? Would you also describe the science faculty there as "heavily slanted" towards evolutionary theory? I find your wording most problematic. Please share the survey data with us as I would be most interested to understand why one college in your area (even considering it is in the southern US!) is noticeably outside the scientific mainstream on any field of science. I can't provide an opinion without more data. I have to add that I am disappointed that "apirate" has so far not only not shared his polling data, but neither has he named the two schools in question, which makes his claims undocumented at best and also without the possibility of being confirmed. But perhaps even more interestingly nor has he explained his "heavily slanted" wording quoted above. -
DSL at 05:59 AM on 30 May 2011Climate Change Denial book now available!
Nik: "I would like to point out to potential readers that your book contains certain political statements that they can either agree or disagree with" Thank you, Nik. I never would have realized it. Shocking suggestions, I must say. I certainly won't let children or some of my more idiotic friends read it. They'd immediately be turned into commies! Gasp! Sarcasm off. Since even the tiniest bit of cultural production has political content, your warning is akin to saying, "Be careful! The ocean is wet!" Garrrr . . .Moderator Response: [Dikran Marsupial] italic tags fixed -
RW1 at 05:45 AM on 30 May 2011Clouds provide negative feedback
Sphaerica (RE: 159), "3. Your argument that models "assume" and require a positive cloud feedback is wrong." It's not really "my argument". The IPCC report specifically says this in the fine print, which I have posted here. "While clouds do represent a large area of uncertainty in the models, it is incorrect to think that the scientists who have done the modeling have not thought things through a little more carefully, and in more detail, than you have. You cast aspersions by generalizing their work into the word "assume," and yet provide no direct evidence (other than the general positive/negative thing) that their work is not well considered." No, I have not seen the evidence their work on the cloud feedback has been carefully considered at all, especially because it seems to ignore the basic physics of water vapor and clouds. -
RW1 at 05:33 AM on 30 May 2011Clouds provide negative feedback
Sphaerica (RE: 159), "2. Your theory is inconsistent with the observational evidence (Dessler 2010) that demonstrates a positive, not negative, feedback in response to short-term warming. While this cannot necessarily directly support a long-term positive effect, it directly refutes your "was negative before, so must be negative in the future" theory." Dessler 2010 is primarily just looking at TOA net fluxes and temperatures – he’s made little (if any) attempt to carefully discern cause and effect, and has not come up with any physical reasons or mechanisms behind his interpretation of the data. He admits in the paper at the beginning that the net effect of clouds in the current climate is to cool by about 20 W/m^2, yet doesn’t seem to ascribe much significance to this or express any curiosity as to why this is the case when clearly it needs to be explained. Furthermore, I notice that the SW component is also positive, which seems to be consistent with decreasing clouds causing the warming rather than warming causing decreasing clouds. Even if the claim is warming causes decreasing clouds for positive feedback, how is this consistent with increasing water vapor from warming? Does increasing water vapor from warming cause decreasing clouds? That doesn’t make any sense since water vapor concentration drives cloud formation. It seems to me that unless Dessler can explain all of this and corroborate it with all the other data and system behavior, he really doesn’t have a case. -
NikFromNYC at 05:10 AM on 30 May 2011Climate Change Denial book now available!
I would like to point out to potential readers that your book contains certain political statements that they can either agree or disagree with: “A sustainable society will require fairness (equity) and justice locally and globally.” – John Cook (“Climate Change Denial”, 2011). “Preventing the collapse of human civilization requires nothing less than a wholesale transformation of dominant consumer culture.” – John Cook (“Climate Change Denial”, 2011). “Just because there a professor of something denying climate change does not mean it is not true, it is just that the professor is in denial. This is why one must make use of the preponderance of evidence in science, the collective view.” – John Cook (“Climate Change Denial”, 2011). -
JMurphy at 04:58 AM on 30 May 2011The Critical Decade - Part 1: The Science
With regard to the NorthWest Passage, you can compare the map given in the link provided by Tom Curtis : (4. ST. ROCH: Northern Deep-Water Route (East-West)
1944 [Yellow line])
With a more recent one giving the likely commercial opportunities opening up :
(4. ST. ROCH: Northern Deep-Water Route (East-West)
1944 [Yellow line])
With a more recent one giving the likely commercial opportunities opening up :
 Response:
[DB] Fixed images
-
Jeff T at 04:56 AM on 30 May 2011Of Averages and Anomalies - Part 1B. How the Surface Temperature records are built
Thank you for a clear description of the methods and the reasons for choosing them. -
trunkmonkey at 04:54 AM on 30 May 2011CO2 only causes 35% of global warming
This site has very high standards requiring explicit physical mechanisms, yet in the notion that CO2 controls water I have heard nothing but metaphor. Described variously as a "skin", "skeleton", "relentless ratchet", and now designated driver (1.), this control knob implies something more than just a steady supply of radiative forcing. I can understand how CO2 mixed into the stratosphere could act as some sort of lid and as a backstop for escaping photons. It now appears ice and CO2 mix into the mesosphere (although how they get through the ozone inversion is problematic unless they leaked through the holes). In the parts of the absorbtion spectra where CO2 and water vapor overlap water vapor seems to dominate the absorbtion and reduce the effect of CO2. Whither the control?Moderator Response: [Dikran Marsupial] You raised the point about the overlapping absorption bands of water vapour and CO2 here and I answered it for you here. This is not the first time (to say the least) you have received an answer to a question and ignored it and moved off onto another thread to start afresh. This does your credibility no good at all. Further discussion should return to the thread where the question was initially raised.As to CO2 controls water, it influences the amount of water vapour in the atmosphere because the warmer the air, the more water vapour it can hold. If you don't believe me, buy a hygrometer and watch relative humidity fall in winter and rise in summer.
-
les at 04:41 AM on 30 May 2011The Critical Decade - Part 1: The Science
Fascinating. this graph is doing the "denyosphere" rounds, not least of all goddard showing sea level as being the lowest since 2004; but an overall rise of 0.76mm/year... It comes from aviso for Envisat without Glacial Isostatic Adjustments applied. With those corrections it would be 1.6mm/year (2004-2011). The site also allows you to view each altimeter individually, all on the same graph; with and without their various adjustments. In addition to 'just' showing Envisat - the oddest looking results and therefor the favorite of the "denyosphere" - you can see Jason-1 and Joson-2 individually - showing 2.75mm/year (2003-2011) and (a very wobbly) 2.44 mm/year (2009-2011). Their overall processing result is, as in 54, 3.25mm/year (1993-2011) as shown here. My point being that it's just childish to quote one or two numbers out of context and then claim 'fowl'. The data and tools out there are so good... why do people just quote a couple of numbers and 'eyeball' trend-lines. weird!Response:[DB] Les, it's all about adjusting the data to meet one's preconceived curve expectations...
-
JMurphy at 04:35 AM on 30 May 2011Climate Change Denial book now available!
tallbloke wrote : "Gavin Schmidt declined the invitation to join us, but he did prejudge us, like you just have." I don't think he prejudged you at all : he was very explicit in his reply to the invitation : The Invitation At this stage we are planning to have a workshop where the main scientific issues can be discussed, so that some clarity on points of agreement and disagreement might be reached. We would try to stay off the policy issues, and will also exclude personal arguments. The issues we have in mind are Medieval Warm Period, ice, climate sensitivity, and temperature data. We would hope to have smaller groups discussing these in some detail, hopefully with scientists who are very familiar with the technical issues to lead the discussion. The "Thanks, but no thanks" response Thanks for the invitation. However, I’m a little confused at what conflict you feel you are going to be addressing? The fundamental conflict is of what (if anything) we should do about greenhouse gas emissions (and other assorted pollutants), not what the weather was like 1000 years ago. Your proposed restriction against policy discussion removes the whole point. None of the seemingly important ‘conflicts’ that are *perceived* in the science are ‘conflicts’ in any real sense within the scientific community, rather they are proxy arguments for political positions. No ‘conflict resolution’ is possible between the science community who are focussed on increasing understanding, and people who are picking through the scientific evidence for cherries they can pick to support a pre-defined policy position. You would be much better off trying to find common ground on policy ideas via co-benefits (on air pollution, energy security, public health water resources etc), than trying to get involved in irrelevant scientific ‘controversies’. tallbloke also wrote : "I find that kind of a priori thinking rarely goes together with even handedness, though you may disagree. I'm not sure who these 'opponents of climate science' you refer to are. Not Judith Curry for sure, since she is herself an eminent and well published climate scientist." Even handedness ? Like this : Tallbloke gave her a commemorative t-shirt with a Josh cartoon on it — the cartoon depicts a trash can labelled “Climate Science”. Curry quips “My reaction to climate change”. Say no more… Climate science being shown to be in a trash can is in agrrement with her "reaction to climate change" ? Yes, very even handed...not. -
Albatross at 04:29 AM on 30 May 2011Climate Change Denial book now available!
Yes Skywatcher @38, a pretty damning refutation of McIntyre's data manipulation. -
tallbloke at 04:24 AM on 30 May 2011Climate Change Denial book now available!
Albatross@35 Both McIntyre and Curry can verify that I challenge them on their scientific viewpoints as much as I do anyone else. I am my own sceptic. [reciprocal challenge snipped]Moderator Response: [Dikran Marsupial] Please can everybody exercise a bit more restraint and avoid making things personal. It is possible to discuss the causes and effects of denial without focussing on the individuals taking part. -
skywatcher at 04:18 AM on 30 May 2011Climate Change Denial book now available!
Sorry Albatross, hit send before I saw that. Sill, Deep Climate's expose of McIntyre is well worth a read. -
skywatcher at 04:16 AM on 30 May 2011Climate Change Denial book now available!
#33 tallbloke. This would be the same Steve McIntyre who wrote a piece of code that created 10,000 sets of null proxy datasets, created an index of how much like a 'hockey stick' each proxy was, sorted the datasets in order of how much like a hockey stick they were, then selected 12 graphs from within those top 1% of red noise diagrams that looked most like a hockey stick. He then presents those 12 carefully selected graphs as a random pick from the original 10,000 and uses it to claim Mann's hockey stick was false. Now I have a lot of experience with writing computer code, and these falsehoods of McIntyre, as found by Deep Climate are not the sort of things you can do by accident. Unfortunately for you, a balanced and honest assessment of climate science, as done by John Cook, or by the many independent inquiries of last year, does not tend to read favourably for the opponents of science. -
tallbloke at 04:12 AM on 30 May 2011Climate Change Denial book now available!
Tom@34, you use the word 'so' to commence your final paragraph as if it somehow logically followed from the rest of your comment. McIntyre spends his time trying to replicate the results of the work which supports the IPCC consensus, in order to ensure it is properly carried out and verified scientific work. Curry is engaged in novel research of her own, and in blogging about the problem she sees as the inadequate scientific support the IPCC consensus position has. From what I can see, they both have disagreements of opinion with both IPCC consensus supporters and detractors. This is all in the rough and tumble of normal scientific discourse. Science has to be challenged, or it is dogma. Scientists who are confident of the correctness of their results welcome challenges, because it gives them the opportunity to show where the challenger is mistaken, and set their science on a more secure footing by honing their arguments and improving their supporting evidence. It is part of the essence of the scientific method and true scientific scepticism. How else can science progress? -
Albatross at 04:10 AM on 30 May 2011Climate Change Denial book now available!
Tom @34, Be wary of the poster you are engaging @33-- D-K alert. The person in question was involved in sharing Gavin Schmidt's private email with Fred Pearce and McIntyre. For some entertainment go to DeepClimate (see also Part 2) and Deltoid and SheWonk. As you have probably gathered by now, the person is an uncritical acolyte of Curry and McIntyre. Please folks, DNFTT. -
Albatross at 03:59 AM on 30 May 2011The Critical Decade - Part 1: The Science
Regarding the absolute nonsense being peddled @51 regarding the trend in global sea level. From the CSIRO sea-level page: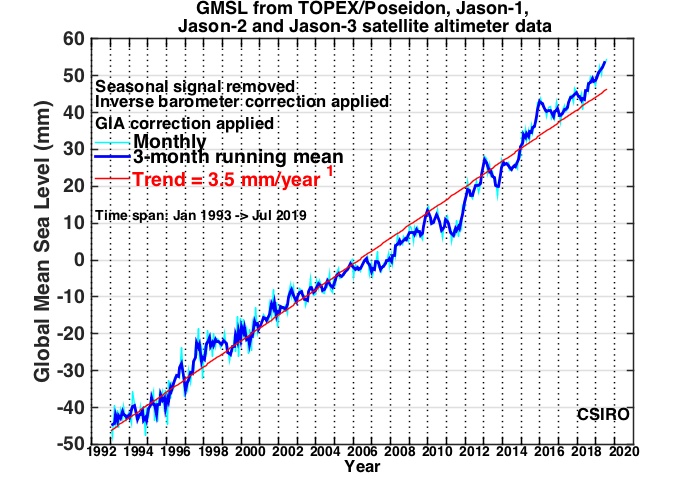 [Source]
Trend in global SL is 3.2 mm/yr.
[Source]
Trend in global SL is 3.2 mm/yr.
-
Tom Curtis at 03:27 AM on 30 May 2011Climate Change Denial book now available!
tallbloke @33, as a "qualified historian and philosopher of science" you should be adverse to misusing terminology. Consequently you should be aware that to prejudge somebody I (and Schmidt) would have to judge them, not before meeting them, but before reading their works. As that is true in neither case, you are showing your prejudice in your choice of words. So also does your claim that Judith Curry and Steve McIntyre are "well balanced", which I do not doubt. But do you think that Schneider, or Hansen, or I are not? What does the ability of somebody to be more or less urbane, and more or less sane have to do with the quality of their intellectual work? The simple fact is that both Curry and McIntyre has shown a willingness to stitch up climate scientists and climate science (Curry's membership of the former group not-with-standing) on limited evidence that is capable of, and in some case inconsistent with anything other than a more charitable interpretation. At the same time they show themselves to be almost entirely uncritical of astonishing flaws from their fellow travellers. So, it is not properly carried out and verified scientific work that Curry, McIntyre, and as you include yourself in their club, you, are keen on; but only such work that be seen as challenging the IPCC consensus. -
tallbloke at 03:04 AM on 30 May 2011Climate Change Denial book now available!
Tom@31, I've met both Steve McIntyre and Judith Curry in person, and discussed climate science with them extensively. I found them both to be well balanced people with well developed specialist knowledge in the climate science field. Gavin Schmidt declined the invitation to join us, but he did prejudge us, like you just have. I find that kind of a priori thinking rarely goes together with even handedness, though you may disagree. I'm not sure who these 'opponents of climate science' you refer to are. Not Judith Curry for sure, since she is herself an eminent and well published climate scientist. And certainly not me. As a qualified historian and philosopher of science I stand in support of correctly carried out and properly verified scientific work. McIntyre seems keen on that too. -
skywatcher at 02:09 AM on 30 May 2011The Critical Decade - Part 1: The Science
#51 ... and just what proportion of the whole record is 2002 - 2011? When did we start calculating climatic trends on ~9 years of data? 1992 - 1997 looks slower too, yet the overall trend is clearly much larger than your cherry pick. This reminds me of the way in which you can break down the entire 100+ year GISS tmperature record into short (<10 years or so) negative-trending segments, yet the overall trend is still resoundingly upwards. #51 KL and #48 okatiniko: On acceleration. If there is no acceleration, or indeed if there is a 'flattening' of the trend, then why is it that when you plot the GISTEMP temperature data trend from 1981-2000, then plot the temperatue trend from 1981 to 2010, the trend line steepens up? Do this on woodfortrees if you like. Doesn't look awfully much like a 'flattening' or 'decelerating' trend to me. In fact, it looks rather more like an accelerating trend with entirely expected noise. With HADCRUT3, despite it being very much a non-global series, there's also an acceleration, though smaller, and in UAH there is a large acceleration when 'noughties' data is added. I'll second Tom Curtis' comment in #35 - the diversion by KL onto East Antarctica is truly disingenuous - does he really think we should not worry about Greenland and West Antarctica's melt (which will lead to metre-scale sea level rise) just because East Antarctica is currently relatively stable? To Gish Gallop and plant the seeds of misinformation in the unsuspecting readers takes seconds; to debunk even obvious disinformation like #13 takes rather longer. -
KR at 01:45 AM on 30 May 2011If It's Not Sex, Drugs, and Rock 'n Roll, what is it? Creativity maybe?
NikFromNYC - Excellent graphic, a rare presentation of the Gish Gallop in visual form. If you're not familiar with the Gish Gallop, it's the spewing of half-truths, inaccuracies, misstatements, etc, hoping to overwhelm any rational response. It's the embodiment of "If you can't dazzle them with brilliance, baffle them with bull." I spent a few moments looking through the various statements in your poster, and I believe that ~95% could be located in various discussions in Skeptical Science by using the "Search" box. They just don't hold up to a rational point of view. Which isn't terribly surprising, given the emotional approach your poster presents. Perhaps better points of optimism might be reaching the Moon? Or the Peace Corps? The post-WWII support of and economic redevelopment of Europe? -
DSL at 01:39 AM on 30 May 2011How Jo Nova doesn't get the tropospheric hot spot
Mike, I think you're referring to "post-structuralist" views of language. Postmodernism is, as Fredric Jameson has it, "the cultural logic of late [global] capitalism." While the post-structuralism of the 60s and 70s may have been energized by the general postmodern conditions within the larger middle-class segments of the economy, the slipperiness of the link between signified and signifier has been noted for quite a while. Interestingly, post-modernity is expressed (well, one expression) in the rejection of metanarratives, and some view the scientific method as a metanarrative, one that places the mind exclusively within the material context, contradicting all other bases of "reality." Science is not, however, an individual pathway to reality. Science is socially developed. This makes it resistant to postmodern conditions. I strongly suspect, given Tom's record, that you'll find little postmodernity expressed in his comments. What the postmodern boils down to for Jameson, Baudrillard, even Hutcheon, et al., is that the generation of capital has become the central logos. People in the postmodern condition are willing to do anything--revise and mix up history, treat science as a cafeteria, treat anything and everything as commodity, etc.--in order to accomplish the neverending quest to generate more capital [Hi there, Michaels, Lindzen, Watts, et al.]. -
Tom Curtis at 01:23 AM on 30 May 2011Can we trust climate models?
trunkmonkey @57, Dikran Marsupial's response is more than adequate. However, as a simple matter of logic, with a fluctuating CO2 level as has occurred over deep time, if the the relationship was not reversable, than any doubling of CO2 would bring a small increase in temperature, but halving the CO2 back to the original level would bring not bring temperatures back down to the original level. Over time, CO2 fluctuations would act as a ratchet, and in a fairly short time in geological terms you would have a runaway greenhouse. No climate scientist, however, is that alarmist - and the relationship is fully reversible. -
trunkmonkey at 00:53 AM on 30 May 2011Can we trust climate models?
Tom Curtis @ 43. It is not clear to me that the logarithmic incremental forcing works in reverse. The logarithmic effect is due to crowding, saturation etc.,that only apply for increases. If CO2 is the "relentless ratchet", should it not, like a ratchet, spin freely in reverse? Isn't this the reason in paleo studies CO2 is treated as "feedback only"?Moderator Response: [Dikran Marsupial] The logarithmic relationship applies both for increasing and decreasing CO2, as for decreasing CO2 there is a complementary de-crowding and de-saturation etc. In paleoclimate studies CO2 is primarily treated as a feedback as the only source/sink of CO2 that counts as a forcing is volcanic emissions and changes in geological weathering due to e.g. plate tectonics. Neither of those things have a great deal of effect on climate on the timescales we are normally interested in. -
Riccardo at 00:51 AM on 30 May 2011The Critical Decade - Part 1: The Science
The Jason 1 and 2 data taken from the homepage you linked to gives 2.3 mm/yr, not 1.7-2.0 as you say. Be carefull when quoting numbers if you care of being taken seriously. To explain why you drop part of the record with no apparent reason is another story. -
Ken Lambert at 23:56 PM on 29 May 2011The Critical Decade - Part 1: The Science
For those who want to check SLR see this link: http://sealevel.colorado.edu/ For Jason 1 & 2 - note that 2002-07 half of the smoothed curve is above the 3.1mm/year trend line and the 2007-11 half is below the trend line. Jason 1 & 2 are clearly on a lower slope trend line which is estimated at 1.7-2.0mm/year. -
Ken Lambert at 23:45 PM on 29 May 2011The Critical Decade - Part 1: The Science
Agnostic #34 "Hansen et al (2011) warn that as a result of anthropogenic emissions and these slow emissions, polar temperature can be expected to more rapidly reduce sea ice and increase Arctic amplification. This is predicted to result in decadal doubling of ice loss from the Greenland Ice Sheet, initiating its eventual collapse and raising sea level by 5m before 2100." The SLR for Jason 1 and 2 is flattening to a global 1.7-2.0mm/year - down fom the official longer term trend of 3.1mm/year - and tide gauges are showing less than 1.7mm/year. Jason 1 & 2 have been in operation since 2002. What could be explanation for this slowing of SLR when CO2GHG forcing and ice melts are supposed to be accelerating? BTW, Hansen has just reduced the warming imbalance from roughly 0.9W/sq.m to 0.6W/sq.m for the 2005-10 period. While his underestimated Aerosols presumably coming from 'unmeasured developing countries' is a feasible explanation, his delyed Pinitubo effect is quite preposterous. His own charts show no forcing from Pinitubo after year 2000. -
okatiniko at 23:39 PM on 29 May 2011The Critical Decade - Part 1: The Science
DB, is it correct to say that the trend doesn't show any significant acceleration as well? an average 0.17°C /decade means that we would need 120 years to reach 2°C - is it the correct order of magnitude, or is a significant acceleration term expected, and when is it expected to be measurable ?Response:[DB] Currently the obfuscationists deny that it is warming at all AND that what warming is occurring is natural and less-than-linear in rate. Tamino debunks that last point here and here.
As far as the warming in the pipeline, consider this and this. The thermal inertia of the oceans, coupled with the albedo changes due to the loss of the Northern Hemisphere's refridgeration system (the ongoing loss of summer sea ice in the Arctic Ocean) and increasing outgassing of GHG's from melting permafrost & clathrates mean that our descendants will have a rough go of things. Especially if we continue to refuse to do anything about it now, while our actions can still make a difference.
Time remains to have a say in our descendants future, should we demonstrate the collective will to do so. Or not.
Our history we write daily will testify about us rather starkly.
-
Charlie A at 23:39 PM on 29 May 2011Can we trust climate models?
Kevin C @51, myself @52 .. Like many things, it is obvious in hindsight. The correct expression for each R(t) coefficient is {exp(-t/tau) - exp(-[t-1]/tau} * step size. The step size in this case is 1 year, so it drops out. Since integral of exp(-x) = exp(-x), the above equation is the area of the response curve for that year. The area of R(t)becomes 1.000 using the above equation for the coefficients, since the sum of the R(t) series becomes exp(-0)-exp(-infinity)=1. This means that the scale factors for the two boxes (0.0434 and 0.0215 in your post #33) will become the equilibrium temp rise for a unit step, i.e. 0.0889 and 0.5440. This revision to the equation might help your optimizer routine, since tau would no longer affect the total equilibrium delta T. -
heystoopid at 22:44 PM on 29 May 2011Climate Change Denial book now available!
Say, I went down to the local shopping centre book store, the lass at the counter was not interested in ordering it in at all, although they had a copy of Naomi Oreskes book "Merchants of Doubt". Interestingly, you have appeared to have severely rattled the cages of Jo Nova, Bob Fernley-Jones and Anthony Watts, who are calling the Robyn Williams interview "The Worst “Cook”book Interview Ever?". Keep up the good work! Since the book store doesn't want my money, I shall be ordering this book on line in due course. -
NikFromNYC at 22:10 PM on 29 May 2011The Climate Show Episode 13: James Hansen and The Critical Decade
James Hansen? Oh that's the 1988 prophet, "the first to ring the bell" which lead to the IPCC! How is his prophecy working out, I wonder? But wait, I thought it was worse than predicted, and then worse still, even though his best case scenario has not been exceeded (not even by GISTEMP). Hmm.... He makes the circular argument that the much higher past T shown in the Greenland ice core didn't matter since mud cores from non polar regions show lesser high past T since warming is "amplified" on top of an ice sheet. But he fails to complete the circle of logic, by rights discounting in kind that current T rise in Greenland must also be "amplified" instead of representative. What he should have said, of course is that mud cores UNDERNEATH THE OCEAN are in fact attenuated due to the massive thermal inertia of the oceans, and the much vaunted Global Average Temperature does not refer to the bottom of the sea but to the air and the top of the sea. He again mentions massive sea level rise that will require a rate 5X as high as what actual sea level rise has been stuck at 3 mm/year (and recently plunging) for decades and tide gauges still show more like 2 mm/year instead ramping up to match the satellite record. And yet I'm in "denial" if I don't believe his prediction of the future? I certainly do deny that his past predictions have shown any competency whatsoever. That NYC where I live two blocks down from Tom's Diner and GISS was to have the West Side Highway next to the Hudson River under water in 20 (later retroactively switched to 40 by the reporter involved) years from 1988, well, wouldn't *that* require that the NYC tide gauge would show some sort of trend change? It doesn't. Have any of you taken the time to actually browse single site tide gauge records to confirm what you would expect, namely that the oldest records that continue to this day, dozens of them, should mostly show a recent upturn in the rate of sea level rise? Good luck hunting for any that do! I think I found one or two, a tiny minority, that did in a literal sea of unwavering trends. Those that show declining trend also show no slower decline, recently. But, never mind, at least you have statistical studies that prove your case even though the input data doesn't support the results.Response:[DB] Thank you for providing a clear example of the non-contextual cherry-picking that "squeptics" typically use to distort & dissemble in their promulgation of their ideology. Your link to "Triple-Point/CO2 Snow" Goddard is revealing as is your focus on single data points to conflate into global trends. Please refrain from the use of all-caps.
-
Tom Curtis at 21:56 PM on 29 May 2011How Jo Nova doesn't get the tropospheric hot spot
mike williams @42, the reason I refer adversely to your character is quite simple, you have taken my words and misrepresented their content. I am careful with my wording because I am used to that tactic by both evolution deniers and AGW deniers (not to mention various 911 deniers, lunar landing deniers and other kooks I have had the misfortune of encountering on the internet) I stated that the sentence, "The biggest misunderstanding about the tropospheric hot spot is the mistaken notion that it's caused by the greenhouse effect" was poorly phrased because it did not properly express the intended meaning of its author. That intended meaning was "that the tropospheric hotspot is not uniquely caused by the greenhouse effect", as I stated in my 36. And of course, that is true. Therefore the original sentence was poorly phrased, not "wrong" because that would be incorrectly interpreted as an error of belief by the author, where no such error existed. Of course, you wanted that misinterpretation to flourish, hence your post 40. You show the same trolling pattern in your 42 when you bring in the term postmodernism as a rhetorical cudgel (which you incorrectly apply, and misdiagnose). What is more, instead of directing it at my actual response to you, you just choose technical terms at random (and evidently without understanding) to support your rhetorical attack. Plainly, for your, effect is far more important than relevance or cogency. -
Tom Curtis at 21:41 PM on 29 May 2011How Jo Nova doesn't get the tropospheric hot spot
mike williams, you have been posing as a fair minded enquirer seeking illumination, but it is quite plain from the tenor of your questions and comments that you are in fact a denier trying various rhetorical gambits. For example, let's take your question about in what other fields is wind shear used as a measure of temperature. Clearly your purpose is to delegitimize the method on the basis that it is not used in any other field (if that is in fact the case). That represents an evasion on your part in that you are avoiding discussion of the physical basis of the method, a ground on which, no doubt you have no ground. So rather than tackling the science where it is strong, you use innuendo. Now, the correct answer to your question is, who cares? It does not matter that variation in the propagation speeds of sound waves is only used to measure the temperature beneath the surface of the sun (if that is in fact the case). What matters is whether temperature affects the propagation speeds of sound waves, and sufficient data can be gathered from this to determine internal temperatures. So, if it happens to be the case that only the sciences of meteorology and climatology use wind shear to measure temperature, so what? If oceanographers do not use wind shear to measure temperature, that is irrelevant to the use of the method. Likewise if metallurgists have also neglected this technique, or geologists. In fact, only sciences which measure wind (of which their are only three) could conceivably use this technique and two of those are so closely related that in this area they are not separate fields. The third science that could conceivably use this technique is astronomy. Whether astronomers ever have or not, well I hardly claim to be up on all the papers in that field, and I doubt many contributors to Skeptical Science are. But it is irrelevant whether they have or not. So, the proper interpretation to the silence that met your question (silence, note - not evasion because there was no response to your initial question at all by anybody), is that nobody cared. Your question was irrelevant. Of course, when you asked it a second time, it was clear what your rhetorical game was. So I provided an answer to the rhetorical point, your unsubtle suggestion that the method was ad hoc. And by the way, the method has been used before, though not in another field. In fact, the method was first used (that I know of) in climatology by that well known champion of AGW denialism, Roger Pielke Snr in 1998. As always, it is not the method deniers really have a problem with - it is the result. -
Dikran Marsupial at 21:20 PM on 29 May 2011Can we trust climate models?
GC@53 If you mean this diagram, then I rather doubt Hubert Lamb would have approved of anyone in 2011 preferring an essentially qualitative plot based on central England (rather than global) temperatures as a proxy for global paleoclimate, when there is far more global proxy data available now and 30 years more research on paleoclimate.
See Appendix A of P. D. Jones et al., The Holocene 19,1 (2009) pp. 3–49, High-resolution palaeoclimatology of the last millennium: a review of current status and future prospects available here, for details.
then I rather doubt Hubert Lamb would have approved of anyone in 2011 preferring an essentially qualitative plot based on central England (rather than global) temperatures as a proxy for global paleoclimate, when there is far more global proxy data available now and 30 years more research on paleoclimate.
See Appendix A of P. D. Jones et al., The Holocene 19,1 (2009) pp. 3–49, High-resolution palaeoclimatology of the last millennium: a review of current status and future prospects available here, for details.
-
NikFromNYC at 20:57 PM on 29 May 2011If It's Not Sex, Drugs, and Rock 'n Roll, what is it? Creativity maybe?
"How would Janis Joplin or Jimi Hendrix tackle global warming?" By writing songs that point out how oppressive and totalitarian the alarmist movement is. As a person who grew up with The Whole Earth Catalog as my adolescent bible (one that championed Bucky Fuller's anti Malthusian and anti Ehrlickian sense of optimism), as a person inspired to pursue chemistry due to an interest in neurochemistry inspired by having read all of Tim Leary's books, I can tell you that the counter-cultural swing of the 60s was very much anti-state, anti-war and very libertarian. Your whole vibe is however authoritarian, statist and left wing. It is profoundly anti libertarian. I was inspired recently to capture some of this bitter pill flavor in a new poster graphic that I call Authority. Several quotes from your book with Hayden feature in it. Since you are pursing a statist solution to a perceived problem, I suggest looking not at counter examples like the dionysian 60s but to other successful statist youth movements. History has a few to offer. First you need to demonize a perceived enemy.... -=NikFromNYC=- Ph.D. (Columbia/Harvard) -
RyanStarr at 20:48 PM on 29 May 2011The Critical Decade - Part 1: The Science
Page 9, 'Climate Commission, The Critical Decade', A recent model study comparing the relative importance of various greenhouse gases for the climate estimates a sensitivity of approximately 4 °C for a doubling of CO2 (Lacis et al. 2010). Lacis et al 2010, For the doubled CO2 and the 2% solar irradiance forcings, for which the direct no-feedback responses of the global surface temperature are 1.2° and 1.3°C, respectively, the ~4°C surface warming implies respective feedback factors of 3.3 and 3.0 (5). (5) Hansen et al 1984, Our 3-D global climate model yields a warming of ~4°C for either a 2 percent increase of So or doubled CO2 1984 is recent? -
mike williams at 20:39 PM on 29 May 2011How Jo Nova doesn't get the tropospheric hot spot
"As to using wind speed as a measure of temperature, we currently use the following methods to measure temperture:" Thats correct Tom..but as you are more than aware..I was not asking you what other indirect ways do we measure temperature,I was asking you about using wind. My original question was What other fields is wind shear used for measuring temperature.? And you still didnt answer it..I will not bother you on this "sensitive" point anymore Tom.. The answer to my question from the silence and evasion was probably...None.. :) -
mike williams at 20:13 PM on 29 May 2011How Jo Nova doesn't get the tropospheric hot spot
mike williams @40, my statement was correct. If you want to replace it with a falsehood for your own rhetorical purposes, it is only informative about your character. Hi Tom... You have to love postmodernism views on science and the meaning of words.. :) "The biggest misunderstanding about the tropospheric hot spot is the mistaken notion that it's caused by the greenhouse effect." Turns into "enhanced greenhouse effect" The IPCC use the term greenhouse effect Tom.. http://www.ipcc.ch/publications_and_data/ar4/wg1/en/faq-1-3.html And there doesnt appear to be a difference between greenhouse effect and enhanced greenhouse effect in their interchanging usage in the IPCC papers either Tom.. As for your strange and slightly juvenile "attack" on my character Tom..I gather you are exempt from the "ad hominem comments will be deleted" policy on the board..or do post modernists have a new interpretation of ad hominem as well as other words. ? : ) As to using wind speed as a measure of temperature, we currently use the following methods to measure temperture: Thanks you very much for those examples Tom..much appreciated. ! You learn something new every day.! "As you have not advanced a single argument against the method beyond your disbelief, that shows us only that you are rejecting the analysis because you dislike the conclusions." I had no belief either way..there are papers for it..there are papers against it..their are scientists for and against.. I was just puzzled about the use of wind for temperature..sorry to express my puzzlement.. :)
Prev 1681 1682 1683 1684 1685 1686 1687 1688 1689 1690 1691 1692 1693 1694 1695 1696 Next


