


 Arguments


Recent Comments
Prev 1718 1719 1720 1721 1722 1723 1724 1725 1726 1727 1728 1729 1730 1731 1732 1733 Next
Comments 86251 to 86300:
-
Bob Lacatena at 03:12 AM on 8 May 2011Lindzen Illusion #2: Lindzen vs. Hansen - the Sleek Veneer of the 1980s
angusmac seems to be woefully lost in the difference between a scenario -- a set of preconditions on which to base a projection -- and the projection resulting from that scenario. He wants to argue that Scenario X is the right one because the end result matches observations, without regard to the fact that the conditions underlying Scenario X never came to pass. He then further obfuscates things by using the 10-year-old description of a scenario (such as "business as usual" for Scenario A) as an argument that it should apply today (because we currently describe what we've done since 1998 as "business as usual"). It's all really a very clever misunderstanding. angusmac, here are some basic facts that point out the major fallacies in your comments to date: 1) Scenarios A, B, and C represent emissions growth patterns, not temperature predictions. 2) Hansen's own description of those scenarios at the time was this:Scenario A assumes continued exponential trace gas growth, scenario B assumes a reduced linear linear growth of trace gases, and scenario C assumes a rapid curtailment of trace gas emissions...
Note the use of the word "continued," which is sort of like "business as usual," but I hope that you can appreciation the difference. 3) Actual emissions growth since 1998 has been linear (i.e. scenario B) even though at that time the pattern had been exponential, and would have matched scenario A. This makes scenario B the best match to actual events for the emissions on which each projection is based 4) So whatever projection went with scenario B (which more closely matches actual emissions) is the one we should consider. 5) Since that projection accompanied a pattern of emissions which never came to pass (i.e. scenario B is closest to, but not equal to, actual emissions since 1998) it is fair to adjust the projection in a minor fashion to more closely match what it might have said, had scenario B matched actual emissions. Which of these rather simple points still eludes you? -
Jesús Rosino at 02:50 AM on 8 May 2011Why 450 ppm is not a safe target
Sphaerica #39, Sorry for repeating, but I want to make it clear that I didn't mean to criticise RC for being silent, I was rather interested in RC's opinion and I thought their silence was also telling. That's because I think the possibility of 2-5 m. SLR in this century suggested by Hansen & Sato is important enough as to devote an entire post to it, especially when they've been posting regularly on the subject. However, in the absence of a specific RC blog post, you've digged deeper than I to give some insight into RC's opinion. Firstly, they seem to place Hansen's numbers within the bounds of Pfeffer et al. I do not go along with that. Pfeffer et al says 2 m. is their highest conceivable bound, but they find it highly unlikely and they add that "more plausible but still accelerated conditions could lead to sea level rise of 80 cm by 2100" (my bold). Hansen and Sato says that under BAU scenarios, multi-meter SLR "are not only possible, but almost dead certain" and that 5 m is possible [citations at the end of comment #38] I don't think 1.5 m is "multi-meter". I think that's downgrading the meaning of "multi". I think multi-meter means at lest 2 (and I think that's what most readers are interpreting, especially that was the reading of the comment I meant to reply to). I think Hansen tries to add something to the literature, and I think it's the suggestion that all current projections may be too low. So not only I don't think Pfeffer and Hansen are in the same bounds, but I think they're just opposite. Then we move on to RC's relevant statement:"We stress that no-one (and we mean no-one) has published an informed estimate of more than 2 meters of sea level rise by 2100."
Agreed. That's why I think RC is de facto rejecting Hansen & Sato's suggestion. In any case, it doesn't matter, what is important, in my view, is that, when talking about Hansen & Sato SLR numbers, we stress that the most widely accepted projections for 20th century SLR cluster around 1 m. -
Tom Curtis at 02:50 AM on 8 May 2011Frauenfeld, Knappenberger, and Michaels 2011: Obsolescence by Design?
chris @181, I'm sorry if I was not clear enough. I just compared three data points on the Tedesco chart, 2005, 2007, and 2010. Setting the difference between 2005 and 2007 as 1, then the difference between 2005 and 2010 is 1.2. The value for 2010 = (v_2007 - v_2005) * 1.2 + v_2005, where v_x stands for the value for the year x. This assumes that FKM and Tedesco's Ice Melt Indices retain proportionality, which is probably not true, but close enough. The addition of the 2010 value does make a significant difference to the 10 year lagged mean in part because 2000 has a very low (in fact negative) ice melt index. Carrying the mean forward to 2010 not only adds 2010 to the ten year lagged mean, but drops 2000 from it, hence the relatively large effect. I would certainly like to see the author's publish a chart including 2010, or better yet, publish the annual values from the current chart so that we can remove the guess work. -
Marco at 02:33 AM on 8 May 2011Frauenfeld, Knappenberger, and Michaels 2011: Obsolescence by Design?
Chris, just a suggestion if you want to make any future analysis: there are several programmes that can extract data from graphs. Wikipedia even has a webpage about it: http://en.wikipedia.org/wiki/Converting_scanned_graphs_to_data with links to several programmes. -
chris at 02:30 AM on 8 May 2011Frauenfeld, Knappenberger, and Michaels 2011: Obsolescence by Design?
O.K. Tom; I'll do that later. However it's not obvious to me what your value should be. If you can suggest a value for the 2010 melt index based on the Tedesco data and compatible with the FKM reproductions in my post (2.2 ??), I'll use it. It will make very little difference to the 10 year lagged running average. Having plotted the data it's clear that's a half-assed means of smoothing time series data anyway (reviewer went AWOL) - It'll make a little more difference to the unlagged 5 year running average. I'll also plot the 10 year unlagged smooth which I think will illustrate how misleading a lagged 10-year smooth is, especially for data that is seemingly rising quite quickly at the contemporary end point. (Any other ideas, I'll plot them!) P.S. Note that when I say "fit" in my post with plots, I don't mean "fit" at all. I mean "running average" or "smoothing"... also it's conceivable that I didn't reproduce the data points exactly correctly, although I made sure that there were 10 data points for each decade of data. If someone thinks I've made any tiny errors, I can easily correct these. If anyone wants my list of melt index vs year, I can post those too.... Of course the authors could post theirs and that would be even better.... -
Marcus at 02:27 AM on 8 May 2011Lindzen Illusion #3 and Christy Crock #5: Opposing Climate Solutions
"Whereever you are Marcus - tell us what the life cycle costs of coal fired generation are compared with PV Solar." Its right there in the text you quote. Official industry figures put *generation* cost of coal at $0.06c/kw-h for coal (which I assume is based on all of the factors you mention), & $0.33c per kw-h for PV solar. Of course, the distribution costs for coal-fired electricity are considerably higher, which is why the *retail* cost of coal is closer to $0.30c per kw-h. Of course, I'm curious why you have this constant obsession with PV solar? I mean, you are aware that there are many other sorts of renewable energy technologies out there-most of them cheaper than PV's (though the cost of PV electricity is falling all the time). Solar thermal has a life-cycle cost of $0.10c/kw-h to $0.12c/kw-h (without storage). Wind is around $0.08c/kw-h (without storage). I can't recall what tidal or geothermal power cost, but do recall that they're around the same range as Wind or Solar Thermal. Hydro power is around $0.03c/kw-h to $0.05c/kw-h. So yes, PV's still have a way to go before their generation costs are competitive with those of coal but, for local energy supply (say, within around 5km-10km of the generation site) the total costs for PV solar even out quite nicely. "That includes the capital cost of the plant, fuel costs, maintenance and running costs divided by the total energy generated over the plant life." You are aware that there's more to calculating life-cycle costs than that. There is the so-called "Discount Rate", which factors in things like depreciation & expected return-on-investment times. Of course, there is a long history of economists applying higher discount rates to coal & nuclear than to renewable energy projects, thus causing the latter to appear even *more* expensive than they really are-or need to be. Also, how can you properly factor something like fuel costs, over a 30-50 year lifespan, when you have absolutely *no clue* how expensive the fuel is going to be in 20 years time or, even more importantly, how expensive the fuel needed to extract the coal is going to be. -
Marcus at 02:15 AM on 8 May 2011Lindzen Illusion #3 and Christy Crock #5: Opposing Climate Solutions
"Apart from the personal derogation" Hilarious, you're the one who accused me of being ignorant-I was merely responding in kind. I think someone is being just a little bit too precious for words-maybe because their arguments are being made mincemeat of, right Ken? "I am happy to engage you on the numbers Marcus, not florid claims about 'subsidies' by governments who seem to be hell bent on helping out vested interests in the 'fossil fuel' industries rather than serving the people." Are you really Ken? Well I've given some very clear numbers above (#97 & #98)-from no lesser an authority than the EIA. You care to dispute these figures, or try to justify such large subsidies for such a mature & profitable industry as the coal & oil industries clearly are? Also, I never made accusations of conspiracies. A large number of the subsidies date back to when the technology was still relatively new, & no-one has been bothered to remove them-a decision that certainly isn't helped by a very powerful fossil fuel lobby. Also, if you think politicians put the interests of the electorate ahead of powerful lobbies, then you really *do* live in a parallel universe. That's not conspiracy theory, that's a simple "whoever pays the piper, calls the tune". I really don't understand how you continue to be incapable of accepting these basic facts. -
dana1981 at 01:44 AM on 8 May 2011Lindzen Illusion #2: Lindzen vs. Hansen - the Sleek Veneer of the 1980s
Albatross - I kind of tried to make that point, that with this data, the most likely sensitivity is actually closer to 3.4°C. -
dana1981 at 01:43 AM on 8 May 2011Lindzen Illusion #2: Lindzen vs. Hansen - the Sleek Veneer of the 1980s
angusmac - as I've said, climate scientists aren't in the business of predicting how emissions will change. That depends on policymakers, not physics. Perhaps if emissions had continued to accelerate at the rate they were in 1988, Scenario A would have become reality. Regardless, nothing was "amended downward". A different scenario became reality. Yes, coincidentally when adjusting Scenario B to reflect 3°C sensitivity, current temp projections come close to Scenario C with 4.2°C sensitivity. I think it's kind of silly to obsess over coincidences though. -
Tom Curtis at 01:43 AM on 8 May 2011Frauenfeld, Knappenberger, and Michaels 2011: Obsolescence by Design?
Chris @179, by close comparison of Tedesco's figure reproduced by Lucia @140, it shows the 2010 melt to be 120% of the difference between 2005 and 2007 higher than 2005. On your chart that would certainly make a visually discernible difference both to the location of the 2010 value, and to the end point of the running mean (five year or ten year). This is slightly more than the 116.7% of the 2005/2007 separation I reported earlier based on figure 2 of the main article. If you where to rework your graphs based on this value, it would save me my laborious attempt to do something similar to what you have done. -
Albatross at 01:32 AM on 8 May 2011Lindzen Illusion #2: Lindzen vs. Hansen - the Sleek Veneer of the 1980s
Dana, Believe it or not, the above obfuscation has given me an idea. I'll try and post about it this weekend. Basically what it boils down to is that these data suggest that a sensitivity of +3 K may be somewhat too low. -
bibasir at 01:22 AM on 8 May 2011Q and A with Dr Haydn Washington, co-author of Climate Change Denial
There are some great quotable lines. Skepticism is about looking for the truth, denial is about hiding from it. ‘global warming happened in the past’. Yes it did, but bushfires happened in the past, yet we know arson is not a good idea -
Bob Lacatena at 01:15 AM on 8 May 2011Why 450 ppm is not a safe target
Martin, concerning ocean cores... I've certainly never seen the statement that ocean cores are a "much better guide to global mean temperatures than ice cores" anywhere. It's not in Hansen and Sato 2011. I'm not sure it's a question that scientists debate. They are different tools, with different qualities, and they are used as such and interpreted as needed. From Hansen and Sato 2011:Ice cores and ocean cores are complementary tools for understanding, together providing a more quantitative assessment of the dangerous level of human interference with the atmosphere and climate.
and laterIce core and ocean core records each have limitations as a measure of global temperature. Here we point out constraints on both records and hypothesize a reason why these two records seem to differ during recent interglacial periods.
This is followed by a detailed discussion of the advantages and disadvantages of each. And, concerning their impact on estimates of temperatures in the Eemian:Ice cores and ocean cores are valuable complementary sources of climate information. Fig. 4 shows that they provide similar pictures of Milankovic glacial cycles, with one exception. Ice cores suggest that the Eemian and Holsteinian interglacials were warmer than the Holocene by 2°C or more. In contrast, ocean cores suggest that these earlier interglacials were warmer than the Holocene by at most one degree, perhaps by only tenths of a degree Celsius.
Of course, this is just from Hansen and Sato 2011. Your question is about the "climate science mainstream"... which I'm not sure is something that exists. -
Bob Lacatena at 01:01 AM on 8 May 2011Why 450 ppm is not a safe target
Martin, I'd point out that Hansen suggests that in a simple model sea level rise would be geometric, not exponential (although I made the same mistake in an earlier comment, saying "exponential" when I'd meant "geometric"). That is, he argues that if rate of ice mass loss is doubling every ten years, then sea level rise could double every ten years. More importantly, however, we are at the very start of any ice melting, so there would as yet be no measurable geometric increase in sea level rise. Given this, your statement #2 above would not be close to the climate science mainstream... but that's not relevant, and that's some of Hansen's point. The question isn't what's happened until now, the question is what will happen. His main point is that if melt rates are not linear, then sea level rise will not be linear, even if sea level increases seen to date are linear. Your statement #3 is also invalid as stated. It is true that the rate of loss of ice in Greenland appears to have doubled in the past ten years. It is not valid to instantly extend this to say that this trend will continue without variation. In addition, some have questioned the proper interpretation of the GRACE satellite data (specifically, the impact of isostatic rebound on those measurements), so even the exact measure of loss is not yet certain. I think the rate of ice mass change in Greenland and the Antarctic is still in an early "wait and see" mode. -
KR at 00:50 AM on 8 May 2011Climate is chaotic and cannot be predicted
neil - Gah; all that typing and I forgot to include the main point. Given a system with multiple equilibria, a wide variety of initialization points will almost certainly provide a sampling of the equilibria, with various initializations stabilizing to local minima in the state space. That doesn't mean it's easy to move from one equilibrium to another, just that they exist. That said, we look to be heading to an ice-free Arctic, and if we maintain high temperatures for a few millennia we may see significant loss of the Antarctic as well. Florida (and Bangladesh) are not great long term real-estate investments. -
KR at 00:42 AM on 8 May 2011Q and A with Dr Haydn Washington, co-author of Climate Change Denial
michael sweet - Here in my area we have a large group of people (complete with decorated RV's) touring the capital, handing out pamphlets, claiming that the end of the world will be at 6PM, May 21st (local time, rolling apocalypse). To balance that, there's a group of atheists (blasphemy required as a hiring condition) spread across the USA, that for a fee and continuing subscription - promise to come by, collect your pets, and take care of them if you are swept up in the Rapture. It takes all kinds... -
chris at 00:37 AM on 8 May 2011Frauenfeld, Knappenberger, and Michaels 2011: Obsolescence by Design?
It's been questioned what FKM's data might have looked like if they'd included 2010 melt. I decided to spend two hours of my life finding out. Here' FKM2011 figure 2 pinched from Rabett Run's blog: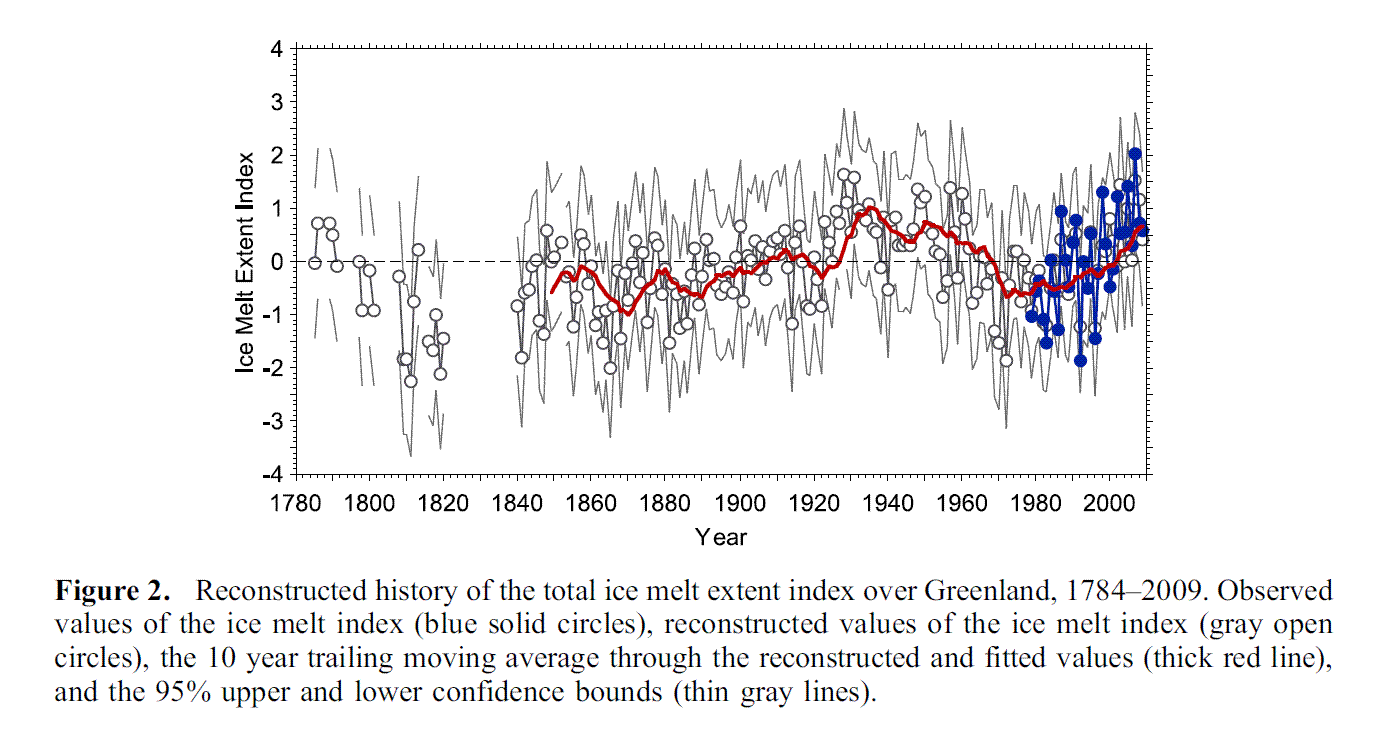 It's not totally obvious what FKM actually did, but I found I could reproduce their data fit pretty well by using a 10 year running average with a five year forward shift. (in other words "year 2009" is defined by the average melt index of the years 2000-2009 inclusive (if you think about it that's really the average of 2005 and the 4 years previous and subsequent).
 Note that this is not quite identical to FKM Figure 2 for 2 reasons:
1. I determined the values by eyeballing the data points(think I did a pretty good job - blew it up large on lined paper)
2. FKM2011's fit is to the modelled data right through 2009. My fit is a splice (my bad) that includes the modelled fit through 1978, and the empirical data from 1979-2009. I did this because I simply couldn't see the white circles undeneath the blue ones in FKM's figure 2. However, it's somewhat preferable since it is a comparison of the directly measured empirical data from 1979 with the earlier data. I also omitted pre-1840 data.
Note how the fit to the empirical data seems to lie rather low, relative to the points. That's because of a rising data set, a 10-year running average has the effect of delaying/suppressing the rise.
Here's what it looks like with an estimate of the 2010 data added. I assumed here that the 2010 melt index is the same as the 2007 (it seems to be close to that – see Figure 2 in Daniel’s top post):
Note that this is not quite identical to FKM Figure 2 for 2 reasons:
1. I determined the values by eyeballing the data points(think I did a pretty good job - blew it up large on lined paper)
2. FKM2011's fit is to the modelled data right through 2009. My fit is a splice (my bad) that includes the modelled fit through 1978, and the empirical data from 1979-2009. I did this because I simply couldn't see the white circles undeneath the blue ones in FKM's figure 2. However, it's somewhat preferable since it is a comparison of the directly measured empirical data from 1979 with the earlier data. I also omitted pre-1840 data.
Note how the fit to the empirical data seems to lie rather low, relative to the points. That's because of a rising data set, a 10-year running average has the effect of delaying/suppressing the rise.
Here's what it looks like with an estimate of the 2010 data added. I assumed here that the 2010 melt index is the same as the 2007 (it seems to be close to that – see Figure 2 in Daniel’s top post):
 Here’s a curve fit that is really more scientifically-justified (5 year non-trailing running average). Since it’s a 5 year average you lose 2 years front and back; however the data isn’t rather foolishly lagged!).
 Not saying this couldn't be done better. However it helps in discussions of what the effect of including/leaving out 2010 might be expected to be. To my mind the smoothing usd by FMK isn't too clever but at least they were quite clear how they did this, and the reviewer gave them a pass....
-
Daniel Bailey at 00:26 AM on 8 May 2011Q and A with Dr Haydn Washington, co-author of Climate Change Denial
@ michael sweet Interesting dilemma. I would tell them: 1. They will not know the day nor the hour of His return, but are commanded to be vigilant 2. Likewise, they are to be good stewards, as the Earth has been given into their care as a trust. Since the poor and the weak (a population segment specifically given into their care) are most likely to suffer under the impacts of rising GHGs, any mitigation of release of those gases will also help mitigate their effects. HTH, The Yooper -
KR at 00:22 AM on 8 May 2011Climate is chaotic and cannot be predicted
neil - Agreed, multiple equilibria are very possible. In fact, that was discussed here in the What would a CO2-free atmosphere look like thread. One important point about the dynamics, though - many times a particular equilibrium (a local minima in terms of the N-dimensional state space of the system) can be quite robust, stable through a fair amount of peturbation yet remaining in that region. Small perturbations shift the system a bit, but it tends to return to the local minima. Only upon a very large perturbation can such a system be moved over a ridge to another valley in the state space, another equilibrium, where it again will be stable until a large perturbation shifts valleys again. The thread I referenced shows that for a very simple model - there are three different equilibria for a single value of CO2, but the shift to a different valley of stability regarding CO2 concentrations takes a very large perturbation. I find it very interesting that this has now been shown for more complete models of the climate, although given state space behavior it's not entirely surprising. At the edges of the equilibria are the phase changes - glaciation, melt of the icecaps, severe thermohaline shifts, clathrate release, and so on. Large perturbations to watch out for... -
Martin at 23:51 PM on 7 May 2011Why 450 ppm is not a safe target
Agnostic, having followed your link to Hansen's paper and read it, I have a few questions which you might be able to answer. Hansen makes a number of statements supporting his hypothesis that a sea level rise of 5m by the end of this centurey is plausible. Which of these statements is not close to the climate science mainstream? 1. The sea level rise is accelerating. 2. The increase in sea level rise is exponential. 3. The ice mass change and the ice mass change rate of Greenland and the Antarctic are compatible with a doubling period of 10 years. 4. Ocean cores are a much better guide to global mean temperatures than ice cores. 5. The Eemian and the Holsteinian interclacials were less than 1°C (probably only a few tenths) warmer than the peak holocene global temperature. -
Bob Lacatena at 23:41 PM on 7 May 2011Video on why record-breaking snow doesn't mean global warming has stopped
On snow extent, four more interesting graphics, among others, from the Rutgers U. Global Snow Lab: Spring NH Snow Extent Winter NH Snow Extent Eurasia Spring Snow Extent North America Spring Snow Extent -
Bob Lacatena at 23:36 PM on 7 May 2011Video on why record-breaking snow doesn't mean global warming has stopped
27, Ken,Just think of the INCREASE in albedo for all that record area of snow white snow covering the NH areas for a few extra weeks. Could lead to an unnatural cooling.
Unlikely. First, extra snow on top of snow already there will not change albedo. Second, the snow exists primarily in the winter months when insolation is already low (much shorter days, low angle of incidence). Third, the extended snow cover could well be offset or even more than offset by earlier springs (i.e. it melts away sooner, and snow that was usually there at more northern latitudes also melts away sooner), or by later winters (i.e. what snow usually arrives does not accumulate on average until later in the winter). Fourth, snow that falls much further south doesn't last long, because temperatures there do not usually remain low for extended periods of time. Much of this snow won't last weeks, let alone into the spring. Certainly, I think it would make an interesting study, and a small negative feedback is possible. Without actual numbers and specifics I'd leave this in the "interesting" category... You can see the Winter (low insolation) versus early Spring (higher insolation and less snow cover, not more) using the Rutgers University Global Snow Lab. Compare November and March (less lower latitude snow) to December through February (more snow on top of snow, or snow reaching lower latitudes). ...but it's hardly going to reverse climate change, or have much impact on total climate sensitivity, which is founded on a lot more than a nit-picking accounting of every individual positive and negative feedback. -
RSVP at 23:24 PM on 7 May 2011Waste heat vs greenhouse warming
KR 423 "Your opinion holds proof against both quantitative and qualitative evidence to the contrary." This discussion is only about two quantities. The amount of the Sun's energy (which is unchanging), and civilization's waste heat, which has only been on the increase over the last 150 years. You've consistently displayed what I consider a cardinal sin of intellect, not thinking for yourself, that is, uncritically parrotting GHG doctrine. It is one thing for temperature distribution to possibly change, and a very different thing for the total entropy of the Earth to go up or down. Since you dont appear to understand this fundamental difference (which has its basis in the second law of thermodynamics, not my "opinion"), it is quite understandable that all you can do is repeat yourself "over and over". -
michael sweet at 23:04 PM on 7 May 2011Q and A with Dr Haydn Washington, co-author of Climate Change Denial
An article in my local paper claimed that over 40% of people in the USA believe that Christ will come and the world will end before 2050. Why should we take action to protect the Earth if it is going to end so soon anyway? How can you argue with that?Response:[DB] You should tell them that the Vatican's Pontifical Academy of Sciences has just issued a report, citing the moral imperative before society to properly address climate change. News release here. The report itself is here.
Declaration by the Working Group
We call on all people and nations to recognise the serious and potentially irreversible impacts of global warming caused by the anthropogenic emissions of greenhouse gases and other pollutants, and by changes in forests, wetlands, grasslands, and other land uses.
We appeal to all nations to develop and implement, without delay, effective and fair policies to reduce the causes and impacts of climate change on communities and ecosystems, including mountain glaciers and their watersheds, aware that we all live in the same home.
By acting now, in the spirit of common but differentiated responsibility, we accept our duty to one another and to the stewardship of a planet blessed with the gift of life.
We are committed to ensuring that all inhabitants of this planet receive their daily bread, fresh air to breathe and clean water to drink as we are aware that, if we want justice and peace, we must protect the habitat that sustains us. The believers among us ask God to grant us this wish.
-
Bob Lacatena at 23:03 PM on 7 May 2011Why 450 ppm is not a safe target
Agnostic, I think you should certainly correct your post. You present the 5m "prediction" from Hansen and Sato 2011 as if it is such, when it is nothing more than an extreme upper limit... and an outlier, much as the upper limit on warming set by the IPCC is around 9.5˚C. Statements like yours can very easily be misinterpreted and result in a wild flurry of useless activity (as Jesus and I have done). In my book, it does qualify as alarmist, in that it presents the extremes of the science without clearly explaining the logic, or clarifying the middle ground (i.e. 0.8 to 2m sea level rise by 2100). Again, the actual, relevant text from Hansen and Sato 2011:Alley (2010) reviewed projections of sea level rise by 2100, showing several clustered around 1 m and one outlier at 5 m, all of which he approximated as linear. The 5 m estimate is what Hansen (2007) suggested was possible, given the assumption of a typical IPCC's BAU climate forcing scenario. Alley's graph is comforting, making the suggestion of a possible 5 m sea level rise seem to be an improbable outlier, because, in addition to disagreeing with all other projections, a half-meter sea level rise in the next 10 years is preposterous. However, the fundamental issue is linearity versus non-linearity. Hansen (2005, 2007) argues that amplifying feedbacks make ice sheet disintegration necessarily highly non-linear. In a non-linear problem, the most relevant number for projecting sea level rise is the doubling time for the rate of mass loss. Hansen (2007) suggested that a 10-year doubling time was plausible, pointing out that such a doubling time from a base of 1 mm per year ice sheet contribution to sea level in the decade 2005-2015 would lead to a cumulative 5 m sea level rise by 2095. Non-linear ice sheet disintegration can be slowed by negative feedbacks. Pfeffer et al. (2008) argue that kinematic constraints make sea level rise of more than 2 m this century physically untenable, and they contend that such a magnitude could occur only if all variables quickly accelerate to extremely high limits. They conclude that more plausible but still accelerated conditions could lead to sea level rise of 80 cm by 2100.
I'd also point out that Hansen's Eemian statements are far less dramatic than is implied by the conclusion of this post. There are two important points there. The first is that the peak Eemian temperatures were only 1˚C above those of the Holocene, so reaching them is not going to be all that hard given current estimates of climate sensitivity. A second important point, relevant to sea level rise, is that sea levels during the Eemian were 5m higher than today, another indicator that if we allow temperatures to reach those levels, then at some point (not at all necessarily by 2100) sea levels could well reach those same heights. -
Bob Lacatena at 22:53 PM on 7 May 2011Why 450 ppm is not a safe target
38, Jesús, Apologies. I misunderstood what you had written, thinking that "this blog" referred to whatever blog you were quoting, instead of "this blog" meaning Agnostic's post here. The confusion was entirely mine, and I apologize (although . On the issue of RC, however, I'd point out that they have pretty much posted everything short of an actual, explicit, unequivocal refutation of Hansen's 2007 statement. How Much Will Sea Level Rise (Sept 2008) Ups and downs of sea level projections (August 2009) Again, let me point to one line from the Sept 2008 post (emphasis mine):We stress that no-one (and we mean no-one) has published an informed estimate of more than 2 meters of sea level rise by 2100.
I'm pretty sure that the crew at RC has read Hansen 2007, and maybe spoken with him from time to time at lunch, so I think it's pretty safe to say that this statement includes Hansen 2007, and that RC has not been silent on this. They later state:The nearest thing I can find is Jim Hansen who states that “it [is] almost inconceivable that BAU climate change would not yield a sea level change of the order of meters on the century timescale”. But that is neither a specific prediction for 2100, nor necessarily one that is out of line with the Pfeffer et al’s bounds. Thus, this media reporting stands as a classic example of how scientists get caught up trying to counter supposed myths but end up perpetuating others, and miss an opportunity to actually educate the public.
And from the August 2009 post:And there are arguments (e.g. by Jim Hansen) that over time the ice loss may be faster than the linear approach suggests, once the ice gets wet and soft and starts sliding.
Again, I would argue that his statement and his logic is being woefully misinterpreted. It is not a prediction of 5 meter sea level rise, it is an explanation as to why 1-meter sea level rise and lower is unlikely, and a warning against putting too much emphasis on linear sea level rise projections. Hansen admits that he has no firm ground for a real prediction, and so he doesn't make one: he restricts his statement to the more vague "meters" meaning more than 1 and less than a whole lot. -
Ken Lambert at 22:23 PM on 7 May 2011Trenberth can't account for the lack of warming
If the facts change and the measurements are robust - of course I would change my opinion. We are all searching for the truth here. My constant theme is that the AGW case is not as strong as projected by the 'enthusists' precisely because the measurement is deficient. 'Correcting' the CERES imbalance to match the theory and calling that supporting evidence is not science. Elements of the theory also have wide error bars - eg. clouds and feedbacks. I am not claiming that there are not bogus arguments on the 'denier' side as well. Of course there are. However two wrongs don't make a right. -
batsvensson at 22:00 PM on 7 May 2011Video on why record-breaking snow doesn't mean global warming has stopped
Errata: "I do not see what relevance this comment has to what I wrote." -
batsvensson at 21:54 PM on 7 May 2011Video on why record-breaking snow doesn't mean global warming has stopped
"Moderator Response: [DB] Where I live (in the northern snow belts of the Great Lakes of North America) snowfall totals have been down significantly for the last several years. So increases are not necessarily global or even regional." I do not see what the relevance if this comment is to what I wrote. And why is it made as a moderator response? -
batsvensson at 21:51 PM on 7 May 2011Video on why record-breaking snow doesn't mean global warming has stopped
@JMurphy: You wrote "batsvensson, I haven't a clue where you get the "personal attacks" belief from, but if that is what you see, it isn't what I intended. Is English your first language ? If not, perhaps that is where the difficulty is. Anyway, no personal attacks intended. " You claim that I had not read more than "the head lines" and also suggested that I lack proper knowledge. I am puzzled about how you possible can have any knowledge of this? To fence of my comment you then suggest I do not have proper understanding of English. These are all comment about my person and not the subject at hand or do you disagree with me on this? -
mspelto at 21:44 PM on 7 May 2011Frauenfeld, Knappenberger, and Michaels 2011: Obsolescence by Design?
Science is built slowly one step at a time building upon the references which are your foundation. In the case of FKM the lack of consideration of obvious key references such as Wake et al. (2009) and Hall et al (2008) indicate a poor foundation that allows an armchair scientist to offer up an appealing data analysis, but one that is not really cognizant of the science reality that has been developed. Stephen Mosher advocates for open science data. I had a paper published in the discussion section of the Cryosphere yesterday. At this site all reviews and author responses are public and the paper may or may not end up being published. It does have to an editors review to be published in the forum. Do I feel compelled to initially share all the data gained from the field work that is the ground truth? This paper was based to a large extent on insight gained from living for six months on the glacier, with the longest period without a shower being 42 days, there was no water to be had with a snowbank inside our living quarters. An armchair scientist may want complete access to hard earned data such as this, but the actual researcher has earned first crack at it. -
angusmac at 21:25 PM on 7 May 2011Lindzen Illusion #2: Lindzen vs. Hansen - the Sleek Veneer of the 1980s
Dana@73, "Your claimed dramatic drop in temperature projections is purely imagined." I disagree. It is not imagined it is fact. Let me explain as follows. In this blog you compare Hansen (1988) with Lindzen (1989). What Hansen and Lindzen said then is particularly relevant. Hansen (1988) in his congressional testimony described Scenario A as “business as usual” (see below). In effect, Hansen told Congress in 1988 that the temperature anomaly for 2019 would be circa 1.57°C. This is a fact. Later (2006), Hansen was economical with the truth when he re-worded his 1988 congressional testimony to be Scenario A, "was described as on the high side of reality."
 Dana the facts are that the 2019 temperature anomaly has been amended downwards from 1.57°C in Hansen (1988) to 0.69°C in this blog.
Furthermore, your adjusted Scenario B has reduced the Hansen's Scenario B anomaly from 1.10°C to 0.69°C but you neglected to mention this fact. Surely this temperature drop can be described as dramatic?
Finally, I would be pleased if I could have a response to my question in angusmac@70. Do you have a problem with declaring that your adjusted Scenario B is only slightly above Hansen's zero-emissions Scenario C?
0.69°C for your adjusted Scenario B and 0.61°C for Hansen's original Scenario C seem pretty close to me.
Dana the facts are that the 2019 temperature anomaly has been amended downwards from 1.57°C in Hansen (1988) to 0.69°C in this blog.
Furthermore, your adjusted Scenario B has reduced the Hansen's Scenario B anomaly from 1.10°C to 0.69°C but you neglected to mention this fact. Surely this temperature drop can be described as dramatic?
Finally, I would be pleased if I could have a response to my question in angusmac@70. Do you have a problem with declaring that your adjusted Scenario B is only slightly above Hansen's zero-emissions Scenario C?
0.69°C for your adjusted Scenario B and 0.61°C for Hansen's original Scenario C seem pretty close to me.
-
Jesús Rosino at 21:16 PM on 7 May 2011Why 450 ppm is not a safe target
Sphaerica,"you were just blindly parroting what you read on some blog somewhere (and yet you can't provide a link to what you read, and a Google search finds nothing)"
As I've already told you before, I've read it here, Sphaerica, in "this blog post" you and I are supposed to be commenting on; you can scroll up and read it. Do you want me to link to the web page you are already reading and commenting on? I'm NOT atacking RC at all, quite on the contrary, they are the reference regarding climate change, and what I've said is that (for that same reason) the fact that they've just ignored this paper by Hansen & Sato (and Hansen 2007) on SLR suggests that it has no merit whatsoever (I'm with RC, not atacking them). Scientists as James Annan and William Connolley see it this way and say everybody else does (linked above). Your citations from RC on SLR are far from contradicting this. My point (from the very beginning) is that Hansen hasn't been able to persuade any scientist that more than 2 m. (up to 5m!) SLR in this century is a credible possibility. Your verbosity hasn't shown otherwise. Direct citations from Hansen and Sato 2011 that aren't shared by their colleagues:"BAU scenarios result in global warming of the order of 3-6°C. It is this scenario for which we assert that multi-meter sea level rise on the century time scale are not only possible, but almost dead certain. The 5 m estimate is what Hansen (2007) suggested was possible, given the assumption of a typical IPCC's BAU climate forcing scenario."
-
Ken Lambert at 21:06 PM on 7 May 2011Lindzen Illusion #3 and Christy Crock #5: Opposing Climate Solutions
Marcus #95 "Shows what you know Ken. Grid interactive PV's have a generation cost of about $0.33c/kw-h, even with the application of an unnecessarily harsh Discount Rate (much harsher than the ones applied to new coal-fired power stations). Even though this cost is much higher than the supposed $0.06c/kw-h for generating electricity from coal, it is *not* that different to the $0.26c/kw-h I currently pay for electricity from fossil fuels." Whereever you are Marcus - tell us what the life cycle costs of coal fired generation are compared with PV Solar. That includes the capital cost of the plant, fuel costs, maintenance and running costs divided by the total energy generated over the plant life. -
Ken Lambert at 21:00 PM on 7 May 2011Lindzen Illusion #3 and Christy Crock #5: Opposing Climate Solutions
Marcus I must be in a parallel universe lately. Apart from the personal derogation: "Your comprehension skills seem awfully weak if you haven't figured that part out yet!" and "Shows what you know Ken" and "I've spent the better part of 15 years studying the history of the electricity industry, Ken, & the only one displaying ignorance here is *you*." Such comments made by me about you would surely have been snipped by moderators. I am happy to engage you on the numbers Marcus, not florid claims about 'subsidies' by governments who seem to be hell bent on helping out vested interests in the 'fossil fuel' industries rather than serving the people. That alone is a conspiracy theory of sorts - and accusations of conspiracy are banned on this site. -
angusmac at 20:44 PM on 7 May 2011Lindzen Illusion #2: Lindzen vs. Hansen - the Sleek Veneer of the 1980s
Moderator@69, a temperature trend of 0.26°C/decade pre-2000 and 0.15°C/decade post-2000 (GISS LOTI) is a dogleg. Your last chart also shows the dogleg with figures of 0.02°C/year for start dates of 1990 and earlier and 0.01°C/year for start dates of 2000 and later. A renowned climate scientist (Hansen, 2006) stated that we should be able to distinguish between Scenarios B and C within a decade (see below): Within a decade is by 2015. However, if you consider this period to be statistically insignificant then I suggest that you argue with Hansen.
Incidentally the no-increase-in-emissions Scenario C gives an even hotter decade than real-world "hottest decade on record" (GISS LOTI).
Response:
Within a decade is by 2015. However, if you consider this period to be statistically insignificant then I suggest that you argue with Hansen.
Incidentally the no-increase-in-emissions Scenario C gives an even hotter decade than real-world "hottest decade on record" (GISS LOTI).
Response:[DB] This has been clarified for you multiple times on several threads. Your persistence and determination in maintaining your narrative in spite of all evidence and physics to the contrary is admirable, but misplaced.
I don't mind continually reinventing the wheel to enable learning, but I draw the line at reinventing the flat tire.
-
alan_marshall at 20:03 PM on 7 May 2011Brisbane book launch of 'Climate Change Denial'
John, Here is an illustration that might be helpful at the book launches in Sydney and Canberra: Q. How many times could Sydney Harbour be filled using the ice that melts and is lost from Greenland in just one year? A. More than 500 times! Greenland ice lost in 2009 = 286 x 10^9 tonnes = 286 x 10^12 litres Sydney Harbour = 560 GL = 560 x 10^9 litres = 0.56 x 10^12 litres Ratio = 286 / 0.56 = 511 -
scaddenp at 19:50 PM on 7 May 2011Climate is chaotic and cannot be predicted
Completely stuffed that post... Trying again. That is an interesting paper Neil. Coincidentally, someone else I think has asked about at RealClimate I have posted the link to this paper. I would say stay tuned.Phil -
Barry Brook at 19:14 PM on 7 May 2011Q and A with Dr Haydn Washington, co-author of Climate Change Denial
Hayden, when you say:The technological solutions exist, such as renewable energy and energy efficiency, and we discuss these. We also discuss ‘false’ solutions such as nuclear power and carbon capture and storage, which involve their own denial of problems.
... are you trying to be ironic, or insulting, or are you simply misinformed? -
neil at 17:56 PM on 7 May 2011Climate is chaotic and cannot be predicted
scaddenp @51 & KR @50 Thanks. Those were interesting discussions to read. I believe they confirm, as I was trying to point out, that there is indeed chaotic behaviour in climate models themselves. When one takes long averages of climate model output it does not appear chaotic - by rather reflects the forced response of the system - I agree. That is why climate models have performed well at predicting the forced response to CO2 so far. This success does not discount the possibility that the climate system could "flip" into a totally separate equilibrium, given enough forcing. This is the idea of abrupt climate change, and although the chances of this may be very small - it certainly should not be ruled out as a possibility. This type of chaotic behaviour actually exists throughout a hierarchy of models: Stommel's classic analytical model of the thermohaline circulation is very simple, yet demonstrates mutiple equilibria are possible for the oceanic circulation. People in the field have sometimes questioned whether this behaviour would exist in a complex-model: The new results from the MITgcm team confirm that it does. The MIT experiments use a state-of-the-art fully coupled AO-GCM, including a dynamic-thermodynamic sea-ice model. The model is therefore similar to any AR4 model in terms of the ocean-atmosphere dynamics (it had a simplified representation of the continents though). (The MIT study by Ferreira et al. ) I'm not trying to argue the predictability of the forced response to CO2 - its clear the models are capable of that. I'm suggesting that there are good reasons to carefully consider what uncertainties exist - because we may have underestimate the climate risks associated with our CO2 forcing. -
NickWare at 16:46 PM on 7 May 2011Climate Change Denial book now available!
Looking forward to the book launch in Canberra on the 16th. I'm trying to get some notorious local deniers along - but they're not biting. -
Mike Palin at 16:19 PM on 7 May 2011Q and A with Dr Haydn Washington, co-author of Climate Change Denial
Some form of engineered carbon capture and storage - organic or otherwise - will need to be instituted at some point in the future even if we manage to slow the accelerating rate of GHG emissions. To ignore this reality is folly. Yes, the concept most commonly talked about is in connection with "clean coal" - an overstatement to be sure, but one that at least recognises ordinary coal is dirty! The magnitude of warming "in the pipeline" is extremely serious and getting more so every day. -
Riduna at 14:52 PM on 7 May 2011Brisbane book launch of 'Climate Change Denial'
Congratulations John Is it true that you are going to be interviewed on the ABC's The Science Program about "Climate Change Denial" ?Response: Your sources are well placed :-)
Except we already recorded the interview with Robyn Williams, just after the book launch (he had a mobile recording studio with him).I just looked up airing time, the Science Show just aired 12pm on ABC Radio today and apparently airs again on Monday 7pm.
UPDATE: just got an email from Robyn Williams, our interview airs on the Science Show on ABC Radio at 12pm Saturday 14 May. -
Marcus at 14:49 PM on 7 May 2011Lindzen Illusion #3 and Christy Crock #5: Opposing Climate Solutions
Additionally, from what I've read, depending on what you count as a subsidy, the US government pays out between $6 billion & $40 billion per annum to the entire fossil fuel industry. Globally, governments gave out more than US$300 billion in 2009 alone-compared to only US$19 billion for the far less mature Renewable energy industry. Does that sound fair to you Eric? Especially given the environmental cost that we're going to have to foot in the future, I'd say that's an emphatic *no*. -
Marcus at 14:43 PM on 7 May 2011Lindzen Illusion #3 and Christy Crock #5: Opposing Climate Solutions
Well Eric, according to what I've read the amount of US subsidies for the oil & gas industry alone rank around US$10 billion per annum. Other reports suggest that simply cutting-not completely removing-the subsidies for Coal & Oil will save about $40 billion over a roughly 8 year period (so around $5 billion per annum). So based on the stuff you've shown me, I'd argue that taxes-subsidies, in the US at least, leave State & Federal Governments *out of pocket*. Given that its usually Governments who need to clean up the messes left behind by the fossil fuel industries when the resources dry up, I'd say that the fossil fuel industry gets a very good deal. -
Wibble at 14:29 PM on 7 May 2011Skeptical Science Firefox Add-on: Send and receive climate info while you browse
And another strange 'argument' - URL to http://columbia.edu/blahblah ... -
Wibble at 14:26 PM on 7 May 2011Skeptical Science Firefox Add-on: Send and receive climate info while you browse
Another comment: there's an odd 'argument' listed that I don't think should be there, text begins "OK! First of all I hope my observation won't be deemed friv..." (search the list for 'OK!' and you'll find it). -
Wibble at 13:52 PM on 7 May 2011Skeptical Science Firefox Add-on: Send and receive climate info while you browse
Nice tool! :) Suggestion for improvement: make it easier to input multiple arguments. A particular annoyance I'm experiencing is that after input of one argument, the list resets to the top, which means labourious scrolling down to where I was (with the entire list of 450-odd arguments, this becomes increasingly tedious; no fun -- the tool needs to be FUN to encourage use!) Possible solutions: 1) when a single argument is submitted, store current list index so as to avoid resetting to the beginning every time 2) allow multiple argument submission with (Windoze) standard Ctrl+click -
KR at 13:30 PM on 7 May 2011Climate is chaotic and cannot be predicted
scaddenp - Agreed; those are well written, certainly better than I can do late on a Friday night. Ed Loretz was truly a genius. -
Eric (skeptic) at 13:28 PM on 7 May 2011Lindzen Illusion #3 and Christy Crock #5: Opposing Climate Solutions
Marcus, thanks for the rapid response. Your point does remain, but your argument is not strengthened by leaving out the money flow directly back to the government. We get lease payments in exchange for the public or formerly public fossil fuels in the ground. We don'y get payments for use of wind and sunshine. We add production taxes like we add sales or excise taxes, for revenue purposes Income tax is irrelevant in this argument. I pay auto excise tax mainly in proportion to the services required for that property (emergency services and some road maintenance). The fossil fuel companies pay production taxes for no comparable services or benefits.


Prev 1718 1719 1720 1721 1722 1723 1724 1725 1726 1727 1728 1729 1730 1731 1732 1733 Next


