


 Arguments


Recent Comments
Prev 1720 1721 1722 1723 1724 1725 1726 1727 1728 1729 1730 1731 1732 1733 1734 1735 Next
Comments 86351 to 86400:
-
les at 05:58 AM on 26 May 2011Even Princeton Makes Mistakes
33 Jay - why? It's completely consistent... Exxon clearly had a big say in the Bush administration. Seems the Georgy Boy Marshall Institute gets cash from Exxon etc. He used the classical "needs more research" Merchents of doubt technique... So, why don't you agree? Just 'cos he's a mate? -
Kevin C at 05:54 AM on 26 May 2011Can we trust climate models?
#9 Galloping Camel: Yes, Charlie understood me correctly. My only reservation is that a 1-box model is just a bit too simple, because the real system seems to require at least two characteristic periods to fit the 20th century behaviour. With only one, you have to fit the multidecadal response and lose the faster ones. This is most apparent in a failure to fit the response to volcanic forcings. (I haven't tested that however, it is my synthesis of several different bits of work by Tamino and the others.) I actually agree with Arthur Smith here that attaching a physical meaning to even the 2-box model is suspect. You may as well abandon the pretence of physicality and simply determine the response function by a parameterised deconvolution, where a parsimonious parameterisation is chosen to best fit the observed data. Two exponentials happen to work quite well, but it may be possible to do better. Conceptually, cross validation should tell us just how parsimonious to make the parameterisation, but looking at the curves my gut says that there is not enough data once you account for autocorrelation. -
Dr. Jay Cadbury, phd. at 05:52 AM on 26 May 2011Even Princeton Makes Mistakes
@Les I agree with some of that but I don't think Happer was hired to disagree about climate change. @Sphaerica See I don't understand how plants would ultimately suffer with elevated co2 levels because they were huge in the time of the dinosaurs with high co2 levels. Since greenhouse owners often pump levels of 1,000 ppm into greenhouses, what level would be detrimental to plants? -
Bob Lacatena at 05:52 AM on 26 May 2011Even Princeton Makes Mistakes
15, Cadbury, The list continues:More CO2 is supposed to cause flooded cities, parched agriculture, tropical diseases in Alaska, etc., and even an epidemic of kidney stones.
I haven't myself seen these studies, but even if they exist, the implication here is clearly that if it hasn't happened already, it will never happen. This is a lie by implication.The question is how much warming, and whether the increased CO2 and the warming it causes will be good or bad for the planet.
No one scientific has raised this question, only deniers. The question is "how bad", not "good or bad." This lie falls somewhere in the gray area between a direct lie, a lie by implication, and a lie by omission.The argument starts something like this. CO2 levels have increased from about 280 ppm to 390 ppm over the past 150 years or so, and the earth has warmed by about 0.8 degree Celsius during that time. Therefore the warming is due to CO2.
This is a bold faced lie. First, it's not an "argument," it's a scientific position shared by the vast majority of practicing climate scientists. Beyond this, the argument has to do with radiative physics, contemporary observations, deductions through paleohistory, and more. The argument was never "CO2 rose, and so did temperature, so the former caused the latter." That one was probably the most egregious lie in his article.There have been many warmings and coolings in the past when the CO2 levels did not change
This is another lie by omission. Any climate change which endured for a half a millenium or more did see changes in CO2 levels, which were a result of the warming. Periods like the Medieval Climate Anomaly did not last long enough to produce CO2 feedbacks. But more to the point, the planet has never before had an intelligent species capable of digging up and burning the carbon that nature spent hundreds of millions of years burying. It should be no surprise that this has never happened before, or that because there can be other causes for climate change, this cannot be one of them.Since the end of the little ice age, the earth has been warming in fits and starts, and humanity’s quality of life has improved accordingly.
This is a lie by implication, i.e. that because temps have increased, and human quality of life has increased, then the two are related and any warming of any magnitude is good. But who was it that said "correlation is not causation?" Oh, yes, it was Happer, just a few paragraphs back. And before that he said "in reality, you can get too much or too little of a good thing." This time he should listen to himself.Our present global warming is not at all unusual by the standards of geological history, and it is probably benefiting the biosphere.
Another lie by ommission. It's not unusual, and life and the planet may well survive, but such climate change in the past has spelled the end for many species, and will be just as dangerous to ours. The statement about benefiting the biosphere has already been addressed, and is a direct, egregious, and complete falsehood. Okay, this is getting boring, because pretty much every other sentence in his article is a falsehood of one sort or another. I'll stop here, rather than clutter the entire comment thread with more of his drivel. -
les at 05:46 AM on 26 May 2011Even Princeton Makes Mistakes
I don't have my copy of MoD to hand... but my above post made me wonder...reskes and Conway have unearthed a treasure trove of primary documents covering decades of this sort of activity that leaves one enormously impressed at the scope of their efforts. But this is not just a history of a time before we all became far too sophisticated to fall for such foolishness. It is worth noting that the heirs of this tradition, such as William Happer, a Princeton University professor of physics and current chairman of the George C. Marshall Institute, continue to operate in the same way.
bingo! -
les at 05:32 AM on 26 May 2011Even Princeton Makes Mistakes
I'm fascinated by the "Gore fires Happer" story... a quick google reveals that Happer was fired because he objected to the VP wanting to take over the world by pretending AGW is true. However Happer was a Bush appointee and only, originally, kept on for 4 months at the start of the Clinton administration. He was fired after 3 for disagreeing with Gore both about climate change on the Ozone hole - claiming he agreed that both where important but more measurement is required... in his own words at the time. Who knows? It's not unusual for administrations to keep folks on for a period and then change... and much the same happened to his predecessor Bob Watson... ousted by Exxon! So Happer got his job to oppose climate change action and lost it for doing the same thing... -
BlueRock at 05:31 AM on 26 May 2011Carter Confusion #2: Green Jobs
Good post, Dana. This study was also widely debunked when it first appeared: * Gabriel Calzada: A study by a Spanish economist showing that as many as 20 jobs are lost for every “green job” created, has been criticized by the Spanish government as being “simplistic” and “reductionist” and based on “non-rigorous methodology.” http://www.tnr.com/blog/the-avenue/breaking-down-spain%E2%80%99s-green-jobs-spending * Spanish government debunks green jobs study cited by GOP. http://thephoenixsun.com/archives/4133 * Debunking The Study by Gabriel Calzada on The Dire Result of Green Jobs Creation in Spain. http://greeneconomypost.com/debunk-spanish-study-green-jobs-1582.htm It's a good example of the anti-renewable propaganda and lies that is constantly being pushed out to confuse the public. -
Mike Lemonick at 05:31 AM on 26 May 2011Even Princeton Makes Mistakes
Sphaerica 27: I'll add to it now. Happer has asserted that since the human race has survived dramatic climate change in the past, it follows that we'll be fine (I paraphrase). It's an idiotic statement, since the human population was dramatically less during the transitions into and out of ice ages, for example; it was nomadic, not dependent on an integrated world economy involving fixed infrastructure--and besides, "survived" is a pretty low standard. Does Happer know, for example, that 50% of the human race wasn't wiped out in those past episodes? Of course he doesn't. In short, another statement that a scientist with an ounce of shame wouldn't let emerge from his mouth. -
NewYorkJ at 05:25 AM on 26 May 2011Even Princeton Makes Mistakes
Happer's been at it awhile. Exxon Funded Think-Tank Chair Will Happer to Testify in Congress on Climate CO2 Famine -
Bob Lacatena at 05:22 AM on 26 May 2011Even Princeton Makes Mistakes
15, Cabury, You asked for a list:By breathing are we rendering the air unclean, defiling or desecrating it?
This is an idiotic thing to say. Obviously no one has said that human breath is making the air unclean. This is a lie by implication (i.e. implying that a claim has been made, when it has not).As far as green plants are concerned, CO2 is not a pollutant, but part of their daily bread...
A pollutant is anything that contaminates an environment. It does not in itself need to be directly poisonous. In the case of CO2, if it raises temperatures and reduces precipitation patterns, it will be harmful to the species of plants currently adapted to existing (and to be changed) ecosystems. This makes CO2 a pollutant. It also makes the above statement a lie by omission.We conclude that atmospheric CO2 levels should be above 150 ppm to avoid harming green plants and below about 5000 ppm to avoid harming people.
This is based on the failed logic that only direct poisoning by CO2 is dangerous, which is clearly not what anyone is saying. This makes this statement disingenuous to an insulting nth degree. Another lie by omission. By analogy, there is probably a maximum amount of water that a person can safely drink, so shoving your head in a bucket full of that amount of water and holding it there should be perfectly safe!As we have discussed, animals would not even notice a doubling of CO2 and plants would love it.
False! Plants will ultimately suffer with raised temperatures and reduced precipitation in areas. Humanity could actually see the loss of huge swaths of the Amazon rainforests, among other ecosystems. Ignoring this aspect of climate change is insane. That statement was a flat out lie....since the predicted warming has failed to be nearly as large as computer models forecast...
This is false, as discussed elsewhere on this site.Climate change itself has been embarrassingly uneventful
This is a disingenuous distraction. No one ever said that climate change would be instantaneously harmful. The major effects of our actions today won't be felt for 20-50 years, but they will be irreversible. To ignore this truth is a lie by omission....to stop the hypothetical increase of extreme climate events like hurricanes or tornados. But this does not necessarily follow. The frequency of extreme events has either not changed or has decreased
Again, a lie by omission. No one ever said climate change would instantly and obviously increase storm strengths. In fact, I've never seen any statement in the science about it increasing tornadoes. Even the science on hurricanes is not settled (see What is the link between hurricanes and global warming? for an overview of published papers on the subject). This is enough for now. I'll add to it later. -
Albatross at 05:18 AM on 26 May 2011Even Princeton Makes Mistakes
Jay, "Happer is a true environmentalist and believes we should be focusing on some other problems in the environment." That may be true, but he is presenting people with false choices in that case. The REDD programme is about protecting forests while also tackling AGW. We have been and can still continue do both. The scenario that you are trying to paint is an old "skeptic" tactic. As for "I do in fact have a phd but I am not comfortable disclosing it." Then why on earth is it part of your moniker. I have PhD too, as do other regular posters here, but do not feel entitled to advertise it each and every time I post. -
Dr. Jay Cadbury, phd. at 05:09 AM on 26 May 2011Even Princeton Makes Mistakes
@Paul Barry Paul, I don't appreciate the cheap shots. I do in fact have a phd but I am not comfortable disclosing it.Response:[DB] Please, let us all return to the subject of this thread.
-
Albatross at 05:08 AM on 26 May 2011Even Princeton Makes Mistakes
Jay @16, "Give me a natural disaster or a storm that has happened since the beginning of the industrial era and I can find you a bigger storm or larger natural disaster in the past." And because we had wildfires before, does not mean that we do not have people causing fires now does it? Please, this is a science site. You are intentionally missing the point. And you need to do much, much bette than that horrendously lame attempt quoted above. The science shows that extreme rainfall events are on the increase. See here, here, here and here for some examples. Happer is doing a fine job destroying his credibility, he doesn't need your help. But why should I care...... -
les at 05:08 AM on 26 May 2011Even Princeton Makes Mistakes
21 - yes, of course he is! Oh, and the poster called "Albatross" is really a sea-going bird. No, really... -
Dr. Jay Cadbury, phd. at 05:07 AM on 26 May 2011Even Princeton Makes Mistakes
@Rob okay that's not what I asked for. But I do in fact understand distribution curves. @Albatross As I stated before, I am a friend of Happer so yes of course I read the article and happen to agree with most all of it. I think what got lost in the article is that Happer is a true environmentalist and believes we should be focusing on some other problems in the environment. -
Paul Barry at 05:02 AM on 26 May 2011Even Princeton Makes Mistakes
Just a thought folks. Is Dr Jay for real? Sounds like a joker to me. Hardly worth spending time responding to his asinine remarks. "Ph.D." might be more convincing than "phd"! What's your doctorate in Dr. J?Response:[DB] It is immaterial whether Jay has a doctorate or what it may be in. Perusal of his comments over time here and elsewhere should make it self-evident as to his capabilities to make and formulate objective and substantive comments and decisions. Thus, unless also from Princeton, it has no bearing on the topic of this thread.
-
Rob Honeycutt at 05:02 AM on 26 May 2011Even Princeton Makes Mistakes
Jay @ 16... Then obviously you do not understand distribution curves, or are conveniently attempting to ignore what they mean. -
Mike Lemonick at 05:01 AM on 26 May 2011Even Princeton Makes Mistakes
Excellent post, but this sentence troubles me: "In short, even Princeton can make mistakes in who they decide should represent their department" What in the world led you to believe that Princeton decided to let Happer represent them? That's nonsense. Princeton didn't decide that Happer should represent anyone or anything. Happer decided entirely on his own to speak out on topics he doesn't really understand very well. Most universities have a handful of faculty members with tenure who end up making stupid statements that are an embarrassment. But being embarrassing isn't a criterion for dismissal or suppression. -
David Lewis at 05:01 AM on 26 May 2011Climate Change Denial book now available!
Just to identify myself - that long comment immediately above this was written by David Lewis. I have been a climate activist since 1988. I was a voice in Canadian politics advocating stabilizing the composition of the atmosphere and aiming for returning it to the preindustrial composition starting from that date. -
David Lewis at 04:58 AM on 26 May 2011Climate Change Denial book now available!
I received my copy of your book yesterday and haven't had time to read much of it yet. I appreciate the work on climate that you do and ordered it on the strength of that. I'm looking forward to reading your book, as I have appreciated the way you handle the arguments of those who deny the validity of climate science. However, I immediately went to see what you had to say on nuclear power and carbon capture, to see if you approach those issues in the way you wish climate denialists would approach climate science. I think that if you want to understand a bit more about why climate science deniers just can't seem to understand that climate change is happening, consider your remarks in the book on nuclear power and carbon capture. A few points: The IPCC AR4 says because nuclear is "similar" to renewables in terms of lifecycle CO2 emissions, it is "an effective GHG mitigation option". It seems you disagree. Does this mean you would say the IPCC is a suspect source for information? Should we just cherry pick what we agree with from it and dismiss the rest? You say 6.7 cents a kWhr is "not cheap" and you say instead of building nukes that could produce power at that price we should spend where CO2 can be displaced "soonest". What does that mean? Shouldn't we be concerned about the cost? Take a look at the chart Al Gore took from McKinsey, i.e. the "global GHG abatement cost curve" he republished on page 240 of his book "Our Choice". McKinsey found that nuclear is a more cost effective mitigation option per tonne of CO2 displaced than wind or solar. Gore removed the word "nuclear" from his version of the chart so renewables supporters couldn't see what McKinsey found. Aren't you arguing the same way? Take a look at Monbiot’s critique of German solar power subsidies - Why are feed in tariffs for solar set so high if 6.7 cents a kWhr for nuke electricity is so expensive? You say the nuclear “fuel cycle produces weapons grade uranium and plutonium”. It doesn’t. Weapons grade material refers to highly refined material, i.e. in the case of uranium that means a sample that is 90% U235, in the case of plutonium that means Pu-239 93%. The fuel cycle for commercial nuclear power produces U235 at 3%. The plutonium would have to be reprocessed out of the waste and the bomb grade isotope separated. Why assert that a specific grade of material is created that is not? Do facts matter? If I used words the way you do, I could say crushing ordinary granite for gravel produces “weapons grade uranium”, just because it contains minute amounts of U235. Nuclear proliferation is a serious issue, but you should make your case about it without lies or whatever you want to call what you’ve done here. Nuclear waste can’t be dealt with, you imply. You might want to take a look at Kahan’s Cultural Cognition of Scientific Consensus. Kahan was studying, among other things, why people reject climate science. One thing he discovered is that people who accept climate science tend to reject the equally authoritative scientific consensus among the relevant scientists about nuclear waste. He cites NAS NRC studies on climate science and nuclear waste to show what the consensus on the two issues is, then writes about his data and conclusions. The NAS concludes nuclear waste is a political problem, not a technical one. You assert otherwise. Why? Look up WIPP, which is a licensed facility in the US that is safely disposing of US military nuke waste in a salt formation. The formation has been there for 300 or so million years, There isn't water flowing through it to carry anything anywhere because otherwise the salt wouldn't be there. The formation is large enough to hold the entire world supply of nuclear waste. Opponents of nuclear power insist there is no place to put the waste. Why? Why do you, as someone who wants something done about climate, add your voice to theirs? In order to make your point that nuclear plants are not being built, you had to tell us to ignore the places where they are being built, i.e. Asia. Why does arguing this way not seem very weird to you, given how much time you must spend going over the fine points of climate denier arguments? We’ll have to mine uranium, unless we use breeder reactors, but we can’t use those, according to you. MIT said they didn’t expect breeders to be used in the immediate future, so you refer to them, but you don’t say why they said that. They said there is enough uranium, which you dispute, they said light water reactors are proven and available and not too dangerous or too expensive to use given the climate problem we face, which you dispute, so they expect the industry, if people decide climate change should be dealt with, will use those. Your argument cherry picks MIT for what you can distort them to say to support your conclusions, which MIT would disagree with. Does this type of argument sound familiar to you? You assert that nuclear power stations can “melt down like Chernobyl”. None ever has. Only Chernobyl. Chernobyl didn’t have a containment building, and it had a graphite core that could burn. The reactor core caught fire and burned out of control without a containment for some days. It is a significant design difference from anything operating in other places. You might want to let the dust settle before declaring how great a catastrophe Fukushima was or is or will be in response. Dr. Robert Gale, who directed the medical effort treating victims of Chernobyl, expects no one will be able to detect the small theoretical increase in cancer that he expects will be calculated to have occurred as a result of Fukushima over the next decades. Why state what has to be disposed of when a nuke plant is decommissioned in units of pounds? Why not micrograms, or better, picograms? Wouldn’t that make the number look even bigger? Isn’t that your point – to exaggerate? Why do it? What is remarkable about the nuclear fuel industry is the tiny quantity of waste that has to be disposed of compared to the amount of power produced. When I toured a reactor, its entire production of waste was sitting in a back parking lot in casks, or in the spent fuel pool in the plant, for a facility that was producing about 10% of the power to the US state I live in for decades. One thing to bear in mind about the anti nuclear movement is that it predates widespread awareness that climate change is a problem. Eg. If you look up the written policy of the Sierra Club, the largest environmental organization in the world, you'll find that all of its nuclear policy is dated prior to their first attempt to write any policy at all about what they called back then "the enhanced greenhouse effect". Policy and attitudes conceived before it dawned on the people who conceived them that there is a very great problem nuclear may be able to help address, may need to be reconsidered, given how serious climate change is. Would you disagree? You should carefully examine Amory Lovins a bit before quoting what he says. Among people who are looking seriously at nuclear power, Lovins is regarded as a liar, something like Lord Monckton. For instance, at the height of the Fukushima crisis I tuned into Public Radio International's "Living on Earth" podcast which featured an interview with Lovins. He asserted that the entire cost of a new nuclear plant is being paid for by the US government at the moment and even at that, no one wants to build a plant that's how undesirable nuclear power is. The program he referred to is a loan guarantee program, where the US government provides insurance to a utility that is building a plant and charges the utility for that insurance. The utility still has to pay the entire cost of building the plant. Lovins says otherwise. He’s been around long enough and he’s been confronted with this often enough this is an outright lie he repeats to the ignorant which is who he thinks listen to a show like this. This is how climate deniers operate - and it is exactly how Lovins operates. Listen to this interview with Lovins and read third comment on this post Etc, Etc. On carbon capture, I note that the IPCC takes a different view than you do, see their Special Report on Carbon Capture and Storage. Mark Jaccard wrote a more accessible look at the technology entitled "Sustainable Fossil Fuels". I find it weird that people who want something done about climate tend to reject carbon capture but who tend to have a more open mind about removing carbon dioxide from the atmosphere after it dawns on civilization at some future time that it has to do so to survive. What will civilization do with that carbon given the arguments you make against stopping it from going into the atmosphere in the first place? Etc. Etc. -
Albatross at 04:57 AM on 26 May 2011Even Princeton Makes Mistakes
Jay @ 15, "Okay well why don't you comb the article again, give me some statements you think are incorrect and I will check up on it with him" You have actually bothered to read the feature post that we are all commenting on right? -
Albatross at 04:57 AM on 26 May 2011Even Princeton Makes Mistakes
JMurphy @14, "It's obvious by now that being a Phd doctorate.....is certainly no guarantee of rational, thoughtful, considerate, honest, unbiased or intelligent writing. What a great shame." Amen. Now are you talking about Happer or Lindzen or Christy or Spencer or Michaels or McKitrick or Muller or Curry or Plimer...? ;) -
Dr. Jay Cadbury, phd. at 04:55 AM on 26 May 2011Even Princeton Makes Mistakes
@Rob Honeycutt Give me a natural disaster or a storm that has happened since the beginning of the industrial era and I can find you a bigger storm or larger natural disaster in the past. -
Dr. Jay Cadbury, phd. at 04:52 AM on 26 May 2011Even Princeton Makes Mistakes
@Sphaerica Okay well why don't you comb the article again, give me some statements you think are incorrect and I will check up on it with him? -
Albatross at 04:49 AM on 26 May 2011Skeptical Science Educates My Students
Apirate @ 95 APirate "I provided the requested answer in the second paragraph" Did you mean this? "I will play your game and say that I do get some good information from WUWT" The games continue. WUWT is a disinformation machine, set up to feed fodder to the 'skeptics' and those in denial about AGW. It is also, for the most part, a faux science site. WUWT does not satisfy the criteria outlined in the post @64 ("One that demonstrates the science in a balanced way, with no games, no tricks, no misrepresentations, no blatant falsehoods?"), not even close. So you answer (WUWT), whether or not it was intended, is insulting. You tried to answer the question, but failed. Try again. -
JMurphy at 04:49 AM on 26 May 2011Even Princeton Makes Mistakes
It's obvious by now that being a Phd doctorate (especially when it is being used to try to project some sort of scientific credibility to impress the credulous) is certainly no guarantee of rational, thoughtful, considerate, honest, unbiased or intelligent writing. What a great shame. -
Utahn at 04:43 AM on 26 May 2011Even Princeton Makes Mistakes
Dr. Cadbury: "Happer happens to be a friend of mine and since he is an authority on physics he doesn't need to site items that are common knowledge to himself." "Common knowledge to himself." That is pretty funny. And talk about appealing to authority. -
Rob Honeycutt at 04:36 AM on 26 May 2011Even Princeton Makes Mistakes
Cadbury said... "The only way elevated co2 levels could cause harm to humanity is if it caused extreme weather events, which it does not." This kind of casual dismissal of what amounts to vast swaths of known science never ceases amazing to me. -
Bob Lacatena at 04:34 AM on 26 May 2011Even Princeton Makes Mistakes
Dr. Jay Cadbury, phd.,Happer happens to be a friend of mine and since he is an authority on physics he doesn't need to site items that are common knowledge to himself.
So why does he cite untruths that are common knowledge to everyone, and have been debunked dozens of times, and are easy to categorically and indisputably disprove? The level of Happer's piece is appallingly simplistic. I don't know the man, and I'm unfamiliar with his work, but if his physics is as childish as that diatribe, I'd never let anyone I know attend Princeton, or trust anything that comes out of that institution.Furthermore, Happer was fired by Al Gore as director of energy research, which just further proves the point that global warming began and is still a political movement.
No, it's an important issue which requires action, and someone who is too ignorant or biased to act in the best interests of the country and humanity has no right to such a position.Furthermore, it is quite ignorant to dismiss history as is done on this website.
That's quite a strong accusation, but it's unclear what you're talking about.The only way elevated co2 levels could cause harm to humanity is if it caused extreme weather events, which it does not.
What complete foolishness. Obviously rising sea levels, increased droughts, drops in food production, and other calamities which have not yet become pronounced, but which are an inevitable consequence of global warming will be a very serious and indisputable way that elevated CO2 levels can cause harm to humanity. Your attempt to portray the situation otherwise does not speak well for your understanding of the issues.Simply having a lot of co2 in the atmosphere does not effect a human's ability to breath, unless it exceeds 8,000 ppm, which is pointed out in Happer's article.
What complete foolishness. Nobody has said that CO2 is poisonous to breathe. Arguing that point reflects rather poorly on your understanding of the issues. Really, why am I not surprised that you and Happer are friends, and your comment here looks almost as if it were written by Happer himself (based on the level of knowledge and thought contained in both)? -
Stephen Baines at 04:25 AM on 26 May 2011Even Princeton Makes Mistakes
Cadbury...that's pretty poor "...he is an authority on physics he doesn't need to site items that are common knowledge to himself" He does if nobody else knows about them. Noone is exempted from that in academics, no matter who employs them or how respected they are. "Furthermore, Happer was fired by Al Gore as director of energy research, which just further proves the point that global warming began and is still a political movement." Are you suggesting that the earth is making a political statement by warming in response to greenhouse gasses? Sour grapes if you ask me. "The only way elevated co2 levels could cause harm to humanity is if it caused extreme weather events, which it does not. " First, we do not know Co2 levels don't affect hurricane or tornados - more research is required before any judgement can be made negative or positive. That would be the proper statement... That aside... you are ingnore all of the other possible impacts on impacts of sealevel rise, agriculture, extreme heating and precipitation events.... -
KR at 04:23 AM on 26 May 2011Even Princeton Makes Mistakes
Dr. Jay Cadbury - So, you defend Happer's misstatements with a few of your own? "Simply having a lot of co2 in the atmosphere does not effect a human's ability to breathe" - Complete strawman, nobody has asserted that we're going to start flopping like fish out of the water due to CO2. "The only way elevated co2 levels could cause harm to humanity is if it caused extreme weather events" - Please read the thread on it's not bad. Sea level rise, ocean acidification, terribly expensive changes to croplands, food supplies, etc., species loss - you consider these to not be "harm"??? I'm appalled, Jay, simply appalled. Happer's article is a list of well debunked skeptic arguments, absolutely no science, and represents a political view in and of itself. Yet you're defending it? You have now, more clearly than ever, defined your point of view. And it's certainly not a scientific one - more one of denial. -
witsendnj at 04:13 AM on 26 May 2011Even Princeton Makes Mistakes
Here is the text of a letter I sent last June, to which I have yet to receive a reply: From: "Wit's End" -
Dr. Jay Cadbury, phd. at 04:11 AM on 26 May 2011Even Princeton Makes Mistakes
@Shoeymore Happer happens to be a friend of mine and since he is an authority on physics he doesn't need to site items that are common knowledge to himself. Furthermore, Happer was fired by Al Gore as director of energy research, which just further proves the point that global warming began and is still a political movement. Furthermore, it is quite ignorant to dismiss history as is done on this website. The only way elevated co2 levels could cause harm to humanity is if it caused extreme weather events, which it does not. Simply having a lot of co2 in the atmosphere does not effect a human's ability to breath, unless it exceeds 8,000 ppm, which is pointed out in Happer's article.Response: "The only way elevated co2 levels could cause harm to humanity is if it caused extreme weather events, which it does not"
Let me direct you to http://sks.to/impacts to disabuse you of that notion. -
Charlie A at 04:10 AM on 26 May 2011Can we trust climate models?
#9 Galloping Camel -- I think you misunderstand what Kevin C has stated in comment #1. If the only thing you are looking at is a global average temperature, than an incredibly simple 1 box model fed with a set of forcings data will have an output which nearly identical to the most complex AOGCM. If you make a prediction for the annual net forcing for each of year of the next couple of decades, then I will make a prediction of the global average temperature over that period that will be virtually indistinguishable from the AOGCM outputs. Indeed, the each individual run of the typical AOGCM would probably have less correlation with the actual future temperature than my toy model, because of the internal variability of the AOGCMs. -
Bob Lacatena at 04:08 AM on 26 May 2011Even Princeton Makes Mistakes
I've said it before about Lindzen, and now I'll say it about Happer and Motl. Princeton, MIT, and Harvard should all be huddled in shame. Certainly such institutions have to be very careful about squelching independent thought, allowing their researchers to pursue their instincts and their initiative where ever it takes them, and making sure that they have freedom of speech concerning political issues, as is the right of any one in the USA. But that does not entitle a researcher to use his title and standing at that university to "authoritatively" spout what are inarguable academic and scientific falsehoods, and to disparage an entire field of science and practicing scientists. This is particularly true if they do not actively do research and publish in that particular field. It may seem okay because the science has been turned into a political issue by economic and social forces (meaning fossil fuel interests, wing nuts, and weathermen with too much time on their hands), but it makes the university in question look very, very bad. MIT, Harvard and Princeton should all be ashamed, and in my mind it reflects very, very poorly on those particular institutions. Are there no actual climate scientists at these institutions? Don't they have something to say in the matter, when someone like Happer pontificates in an area that is clearly outside of his realm of understanding? -
Lou Grinzo at 04:08 AM on 26 May 2011Even Princeton Makes Mistakes
Happer stoops to using "correlation is not causality" when talking about the overwhelming majority of climate scientists? That's an astonishingly narrow-minded and condescending claim. I've heard many people talk about how physics is the field that produces the most adamant and often just plain wrong deniers. (Which is NOT to say that all physicists are deniers, merely that the worst ones with a background in a hard science tend to come from that field.) Happer sounds like a prime example of the phenomenon, right up there with Dyson.Response: [JC] Hey, no dissing physicists! What about petroleum geologists? :-) -
BillWalker at 04:04 AM on 26 May 2011Even Princeton Makes Mistakes
Has Happer "gone emeritus", or is he about to? Perhaps he needed a little extra retirement money. -
apiratelooksat50 at 03:28 AM on 26 May 2011Skeptical Science Educates My Students
I provided the requested answer in the second paragraph. No insult intended so you shouldn't feel too bad.Response:[DB] For clarity's sake, you consider WUWT to be an example of a skeptical site doing good science?
-
Camburn at 03:01 AM on 26 May 2011Monthly Climate Summary: April 2011
Albatross: You are correct. I should have been thinking April 10th verses now as that is the context of the subject matter. The temps to the north in April were even colder than the present deviation, so it was a very strong clash. -
Albatross at 02:59 AM on 26 May 2011Skeptical Science Educates My Students
Apirate @93, I'll remind you of the question: "Can you find a "skeptical" site that you consider to demonstrate good science?" So stop insulting us by playing games and answer the question posed @64. The poster was very clear, and asked you to provide a "skeptic" site (note the quotation marks). While your sad attempt to avoid the question is entertaining, I for one would appreciate an unambiguous answer. Truth is you will not be able to find a 'skeptic'/contrarian/denier site that meets specified criteria. Sad that fact does not seem to register with your or bother you in the least. -
Albatross at 02:45 AM on 26 May 2011Monthly Climate Summary: April 2011
Camburn @17, Sorry for not being clear-- I was specifically referring to the SST anomalies during the super outbreak/s in April as per Dr. Master's blog. Positive anomalies have weakened since then, but here are the mean anomalies for the past month, still above the 1971-2000 average in parts of the GOM. This is what Dr. Master said (in the link that I provided @16) when referring to the record breaking outbreak in April: "April 2011 sea surface temperature in the Gulf of Mexico were at their third highest levels of the past 100 years, so there was plenty of warm, moist air available to create high instability, whenever approaching storm systems pulled the Gulf air northwards into Tornado Alley, and brought cold, dry air south from Canada." It would help if contrarians actually followed the links provided before opining. Since then the SST anomalies have weakened, here are the mean anomalies (wrt the 1971-2000 base period) for the past month. Mean SST anomalies have still been above average over portions of the Gulf over that time.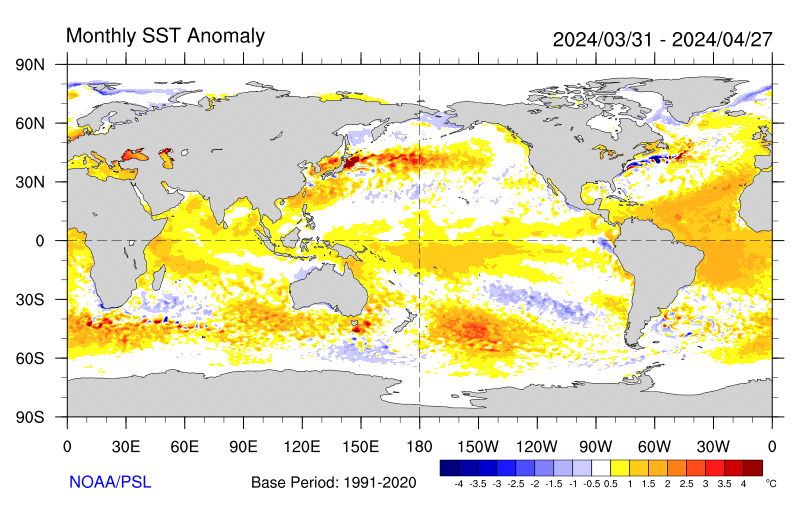 [Source]
-
apiratelooksat50 at 02:40 AM on 26 May 2011Skeptical Science Educates My Students
Sphaerica @ 64 Can you find a "pro" site that you consider to demonstrate good science? Just one? One that demonstrates the science in a balanced way, with no games, no tricks, no misrepresentations, no blatant falsehoods? I will play your game and say that I do get some good information from WUWT. I also get some good information from SKS. Eventually, though, investigation will lead to sites like the following 3 examples: http://sealevel.colorado.edu/ http://www.noaa.gov/ http://www.nasa.gov/ -
Camburn at 02:31 AM on 26 May 2011Monthly Climate Summary: April 2011
DB: I understand the AMO quit well, and know that it is a long term oscillation. We know that the AMO and the AO affect central upper plains of the USA weather. The result of the current status of them combined is keeping an open door to cold coming south. We have been between .7 and .4 degrees F below 30 year averages for several months now, and current forcast show no easing of this pattern. This is enhancing the development of tornados as the contrast is very strong. -
Camburn at 02:21 AM on 26 May 2011Monthly Climate Summary: April 2011
Albatross@16: Actually, current SST anomoly of the Gulf shows that it is not much above. Parts are warmer and parts are colder. http://www.esrl.noaa.gov/psd/data/correlation/amon.us.data -
Eric the Red at 02:15 AM on 26 May 2011Can we trust climate models?
Kevin, I read both today's and yesterday's posts. I think the result of Hansen's paper is that there is still a lot that we do not understand. He offers several possible explanations; all which will coincide with the observed data. However, that does not tell us which is correct, if any. My opinion is that many of the models underestimate several forcings, in addition to the aerosols. Ocean cycles are still being updated for model use, and may play a much mroe vital role that previously thought. Camel's link to Greenland temperatures may be largely due to the cylcic nature of the AMO. Phil Jones has co-uthored a paper recently in Nature which shows the changes in SST in the north Atlantic during the past century. http://www.nature.com/nature/journal/v467/n7314/full/nature09394.html -
shoyemore at 02:03 AM on 26 May 2011Even Princeton Makes Mistakes
My attention was drawn to Happer's article when I saw it referenced on a website I visit. Of course, it was being quoted in favour of the denialist position. It astonishing that it contains no references to peer-reviewed science at all, just Happer's unsupported assertions. If anything, it showed his lack of acquaintance with climatology. A miserable effort from someone who must have been once quite distinguished. -
gallopingcamel at 01:48 AM on 26 May 2011Can we trust climate models?
Bern, Yes, I was aware of that 1981 Hansen prediction. I agree that it looks pretty good. So good in fact than one might be tempted to extrapolate it forwards to 2100 or backwards to 1930 or even 1850. However, when you extend the timescales, the wonderful correlation breaks down. Anyone who believes that CO2 is a major driver of global temperature is looking for hockey stick trends because that is what the CO2 concentration is doing. I tried to match the CO2 hockey stick to the Greenland temperatures shown in the attached graph which I prepared with the idea that temperature trends are magnified at high latitudes. Can you see the correlation? http://diggingintheclay.files.wordpress.com/2010/12/coastal-average.png?w=1024&h=621 -
Alexandre at 01:45 AM on 26 May 2011Even Princeton Makes Mistakes
He does not imply that the Earth has cooled 10ºC in the Younger Drias. He actually states that: "During the “Younger Dryas” some 12,000 years ago, the earth very dramatically cooled and warmed by as much as 10 degrees Celsius in fifty years." What would be the correct statement here? Maybe "During the Youger Drias Greenland has warmed by as much as 10ºC in fifty years"? No comments about the rest. Really disappointing from someone that probably knows how unscientific, unaccurate and harmful to our society that kind of text is. -
dana1981 at 01:45 AM on 26 May 2011Even Princeton Makes Mistakes
Nice post, Chris. It's worthwhile to read Happer's article just to see the sheer number of absurd claims he makes. The article contains on the order of 20 of the SkS climate myths. A true Gish Gallop unworthy of a Princeton physicist. -
Charlie A at 01:41 AM on 26 May 2011Roy Spencer’s Latest Silver Bullet
@Kevin C, #34 re climate response function and Hansen 2011 et al. Hansen's sections 5,6, and 7 and figure 9 discuss only the ocean mixing in regards to the climate response function. It seems to me that, since the forcing for Figs 7, 8a and 9 is a step doubling of CO2, then there are some additional important time constants related to the decrease of CO2. Perhaps CO2 is the cause of the change in slope around 700 years on Figure 7 and around 50 years on fig 8a. For CO2, IPCC AR4 defines a response to a step in CO2 that has 4 time constants. "About 50% of a CO2 increase will be removed from the atmosphere within 30 years, and a further 30% will be removed within a few centuries. The remaining 20% may stay in the atmosphere for many thousands of years." ref: 2nd bullet under Carbon Cycle.. at AR Exec summary Chap 7, WG1 The specific time constants are given in note a of Table 2.14 in AR4 WG1 errata.. It gives 3 time constants, with the 4th time constant of infinity implied by the fixed a0 = 0.217. Note that the 50% decrease in 30 years in the exec summary descriptive text above is the combined result of A2/tau2 and A3/tau3 pairs of 19% decaying with 1 year e-folding period and 34% of the CO2 decaying with 19 year e-folding period. The 30% in a few centuries text corresponds to the A2/tau2 of 33.8%, tau2 of 172.9 years. The twenty percent remaining corresponds to the a0 of 21.7 and a tau of infinity CharlieResponse:[DB] OK, let's try to rein in the off-topic discussion here. Plenty of threads exist to discuss specific options, like sensitivity or models. This thread is about a repost of Professor Bickmore's piece on Spencer's latest attempt to un-physicalize the downsides of the anthropogenic GHG contributions to global warming. IMHO, the Spencer series should be called "Spencer Straws", as the grasping going on is plainly evident.
Prev 1720 1721 1722 1723 1724 1725 1726 1727 1728 1729 1730 1731 1732 1733 1734 1735 Next


