


 Arguments


Recent Comments
Prev 1831 1832 1833 1834 1835 1836 1837 1838 1839 1840 1841 1842 1843 1844 1845 1846 Next
Comments 91901 to 91950:
-
Tom Curtis at 14:27 PM on 19 March 20112nd law of thermodynamics contradicts greenhouse theory
LJR @678 the lid is not transparent to the shortest wavelength photons emitted as black body radiation by the back and sides. Clearly whether this is the case or not depends on the total energy of the incoming light, and hence needs to be stipulated. -
Marcus at 14:22 PM on 19 March 2011Those who contribute the least greenhouse gases will be most impacted by climate change
So Gilles, when you consider the declining energy intensity of Western Economies & the growing proportion of energy derived from renewable energy sources in these same countries, then we see how weak your claims regarding "the dependence of wealth on fossil fuel consumption" actually are. If the developed nations of the world were sensible, though, they would be exporting their more than 30 years experience in energy efficiency & renewable energy to the 3rd World, to ensure that they can achieve-& maintain 1st world wealth *without* the need to consume more fossil fuels- ( -Snip- ).Moderator Response: [DB] The goal is to provoke you; do not allow it. -
L.J. Ryan at 14:17 PM on 19 March 20112nd law of thermodynamics contradicts greenhouse theory
Tom Curtis 677 I compliment your thoroughness, though I see a couple problems with your examples. But first clarification. You said: "Importantly, the wavelength of the incoming light is less than the critical wavelength of the lid." Ok got it. "Also, for simplicity, the total energy of the incoming light is less than the amount at which the shortest wavelength of a black body emission from the back and sides of the box is shorter than the critical wavelength." Are you saying peak bb emissions are not transparent to the lid or the wavelength shorter then peak are not transparent or something else? -
Marcus at 14:17 PM on 19 March 2011Those who contribute the least greenhouse gases will be most impacted by climate change
Also, a few facts for you Gilles. All First World Countries have actually reduced the energy intensity of their economies. The US, for instance, went from 15,000 BTU/US$ GDP in 1980 down to around 9,000 BTU/US$ GDP. France, Germany and the UK show similar downward trends in the energy intensities of their economies. Not only that, but France, Germany & the UK have energy intensities of between 5,000-6,500 BTU/US$ of GDP, yet Brazil, Panama & Argentina-for example-use closer to 7,000 to 9,000 BTU/US$ GDP, yet these nations are significantly *poorer* than the aforementioned nations of Western Europe. Indeed, when you look at a table of energy intensity of various nations-between 1980 & 2006 (which is all I currently have available from the Energy Information Administration at this point)-there is very, very little relationship between the change in energy intensity & change in wealth of the various nations over this time period-with many developing nations significantly increasing their energy intensity, whilst their actual GDP (total or per capita) has failed to increase in any significant fashion. Meanwhile, wealthy countries have reduced the energy intensities of their economies whilst still enjoying strong improvements in GDP growth. So really your claims, Gilles, lack any foundation in basic fact-even *before* you even consider the role of fossil fuel consumption in the equation of energy intensity. -
Marcus at 14:01 PM on 19 March 2011Those who contribute the least greenhouse gases will be most impacted by climate change
Gilles, the point you keep missing is that the wealth of the First World nations *precedes* the rapid rise in the consumption of fossil fuels. How else can you explain the fact that, between 1900-1950, annual CO2 emissions remained between 1 to 2 billion tonnes? I'd go so far as to say that it was the pre-existing wealth of the First World nations which allowed them to invest all that money in the construction of such large energy networks, & the wealth of its individual citizens that allowed them to buy all the luxuries-post WWII-that allowed them to make use of the fossil fuels-so you've really put the cart before the horse in your desperate bid to "prove" the necessity of fossil fuels in the creation of wealth. Also, I too have relatives who remember the first half of the 20th century-in both the UK & Australia-and they don't tell me tales of grinding poverty or misery. Indeed, my family all enjoyed lives of well-fed, middle-class comfort-even those who lived a rural life never spoke of being poor, so again your claims of "proof" are actually extremely weak-something which is to be expected from what is, in effect, barely disguised propaganda. -
alan_marshall at 13:54 PM on 19 March 2011Examining the impacts of ocean acidification
Arkadiusz Semczyszak @ 35 You quote Jean-Pierre Gattuso, whom I respect. There are a variety of articles on the EPOCHA site. In the article published on 16 March, which I quote in comment 10, Hall-Spencer reports that “the area [near vents] where the pH is 7.8—the level that may be reached ocean-wide by the end of the century—is missing nearly a third of the species that live nearby, outside the vent system”. He points out that these missing species have failed to adapt, even though they have had thousand of years to do so. At least in this instance, Gattuso’s optimism about the “potential acclimation and adaptation by organisms” does not seem to be justified. A global loss of one third of species of calcifying organisms would have severe consequences. I find that disturbing. The projected end-of-century temperature rise of 4 °C under a business-as-usual scenario, coupled with an ocean surface pH of 7.8, will destroy almost all of our coral reefs. (Next to the tropical rainforest, they are the richest ecosystem on Earth. ) I find that disturbing. When James Hansen gave his famous congressional testimony in 1988, atmospheric CO2 was still around 350 ppm. The danger of climate change was well understood even then. If politicians had heeded his warnings we would not be confronted with the crisis we are facing now. I find that disturbing. -
johnd at 13:45 PM on 19 March 2011Maize harvest to shrink under Global Warming
Charlie A at 13:06 PM, Charlie, it's so obvious isn't it? One expects that anyone wanting to discuss this subject would at least have some basic understanding of how, this of all subjects, plays out in the working world. I found map(b) the most revealing with it's indications that the greatest impact on maize yields will generally occur in those areas which are already beyond where maize can be grown under present. conditions. -
garythompson at 13:42 PM on 19 March 2011Examining the impacts of ocean acidification
from your graphs it's obvious that co2 concentrations in the ocean are correlated with atmospheric co2 concentrations and that makes sense. you show the pH declining but are there other factors in ocean pH other than co2 concentration? what else could affect the ocean pH? also, the pictures of the differences in calcification (i think that is the right word) is obvious but are there measurements taken at specific reefs over time to measure this and is this also correlated with pH? i seem to remember a post somewhere linking the PDO to the pH cycles as well. can you provide a link to prove or disprove that?Moderator Response: [DB] Perhaps it would be best if you would hunt down a link to this post to which you refer, then this could be discussed further. -
TimTheToolMan at 13:27 PM on 19 March 2011What would a CO2-free atmosphere look like?
Yes, I have thanks Rob. Having contemplated the graph a little more I've decided its worse than I thought. If insolation was lower then CO2 levels must have been higher to compensate when looking at say 288K which is the equivalent of today's temperature. However, the CO2 level is quite a bit lower than today at around 130ppm. So its a double whammy on the graph being correct. -
Charlie A at 13:18 PM on 19 March 2011And so castles made of sand fall in the sea, eventually
#16 Daniel Bailey "Creation of new real estate (at all, let alone that above future SLR) = slim to none (outside of new volcanic islands)." That statement contradicts both historical record for both coral atolls and large cities. It also contradicts the historical record for places like Bangladesh. Look at the outlines of past shoreline maps of San Francisco, Boston, New York or virtually any other city and you will see that even though the global sea level has been rising for the last 100+ years, that the vast majority of cities have expanded in size area, with large portions of sea becoming land. Whether delta areas (such as Bangladesh) are increasing or decreasing in area depends upon the balance of land subsidence vs. land generation from the deposition of silt carried to the delta by rivers. -
Charlie A at 13:13 PM on 19 March 2011And so castles made of sand fall in the sea, eventually
#12 Yvan Dutil at 01:34 AM on 18 March, 2011 "In many place isostatic rebound is of the same order of magnitude as the sea rise rate. This means that some place will not see any increase, some will see decrease and some will see much larger increase." So what is the pupose of the paper. Without taking into account the local isostatic rebound it is not of much value for local planning. So that leaves the goal of the paper as educational/motivational? -
Charlie A at 13:06 PM on 19 March 2011Maize harvest to shrink under Global Warming
#25 JohnD says "Map (d) shows the current maize growing areas Map (e), shows the present growing areas where yields will vary, up and down, shaded according to the degree of variation. You should note the positive or zero shading in relation to the two areas I mentioned." It is no coincidence that the areas that are now have the highest percentages of corn acreage are the ones where 1C of warming results in an increase in yield. The effects of global warming at any one location are small compared to the natural year-to-year variations. That's why global warming is evident only upon analyzing hundreds of locations rather than just one or two. For a crop to have good yields for a reasonable percentage of years, the climate has to be such that normal year to year variations don't often dramatically reduce yields. A 1C global warming is small compared to normal year to year variations and doesn't present a major challenge, on the average, to the crops in the areas that are currently optimal for that crop. On the other hand, in areas with marginal climate, there will be many years with crop failure. If the failures are mostly due to high temps, then 1C of warming will significantly worsen the situation. But farmers already "know" that .... if not consciously, then as part of the overall local body of knowledge of what crops are suitable for that area. The above is a long winded way of saying the the above report confirms what is already known by farmers. Except that farmers are also smart enough to change the planting time in response to changing climate, while the paper assumes such a trivial adaptation will not take place. If the climate changes are more extreme, then farmers will move to other varieties of corn or even to other crops. This sort of low cost, low tech adaptation is why there is such a wide variation in percentage of different types of crops in different areas. -
The Skeptical Chymist at 13:00 PM on 19 March 2011Sea level rise: coming to a place near you
Alan (comment 18). The issue is that outside the USA the tool has a "horizontal resolution of 1 km" which might work ok for somewhere like Melbourne, but not Sydney or Brisbane (to keep it local). See here for some higher resolution info on the effect of SLR on Sydney. It only goes up to 1.1m so gives some indication of what will likely happen this century. -
Tom Curtis at 12:48 PM on 19 March 20112nd law of thermodynamics contradicts greenhouse theory
For anybody not convinced of AGW who has been following this discussion, consider the following model: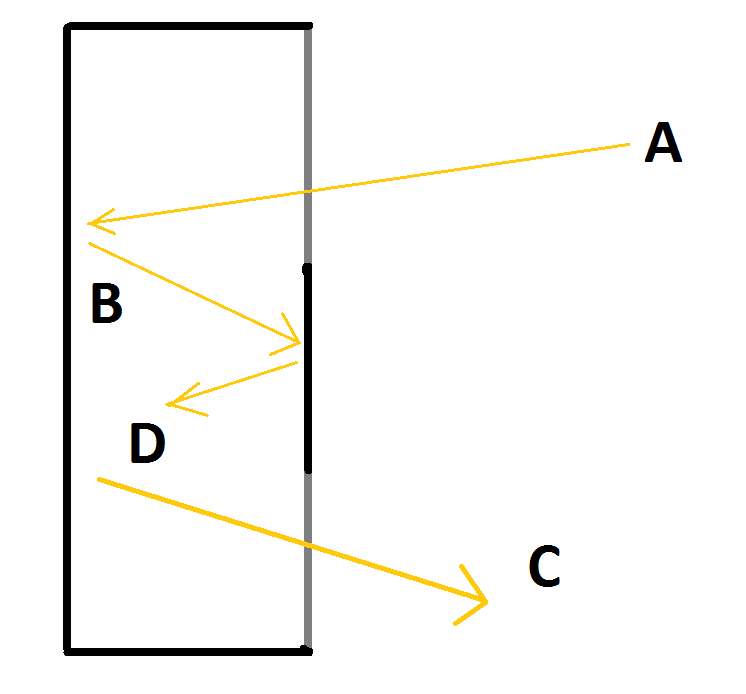 In this model we have light entering a box (A) at an angle. It then strikes a mirror on the back of the box, is reflected of a mirror on the front of the box so placed that it does not block any incoming light. The now twice reflected light returns to the back of the box, striking the mirror once more. It then goes through a second transparent zone in the front of the box.
Assume the ideal case in which all apertures are 100% transparent, all mirrors are 100% reflective and flat, and in which the light is so angled that neither the incoming beam (A) nor the outgoing beam (C) strike any part of the mirror on the top of the box. In that case, after sufficient time for light to transit the box three times, and with a constant light source providing beam (A), then the box will have the following equalities:
1) Incoming light (A) = Outgoing light (C) (by virtue of conservation of energy).
2) Light reflected from the lid (D) = Outgoing light (C).
3) Light reflected from the back = light striking the underside of the lid (B) = light transmitted by the lid (C) plus light reflected by the lid (D) (by virtue of conservation of energy). This may require a little clarification. The lid consists of three sections in this model, two transparent, and one mirrored on the underside. One transparent section allows in the incoming light (A). The other allows out the outgoing light (C). So the light striking the back of the lid equals the light striking the mirrored section plus the light striking the transparent section through which the light exits.
Therefore
4) Light reflected from the back of the box (B) = light reflected from the back of the lid (D) plus Incoming light (A) = 2 x A (again, by conservation of energy.
Such a box clearly does not violate any law of thermodynamics. If it did violate such laws, so much the worse for those laws, for the box could be set up as a primary school science project, and will behave as advertised. As I assume that the scientists of the world are not part of a massive conspiracy to foist upon us "laws" that can be refuted by any primary school kid with a plate of glass and two mirrors, I will take it that this box does not violate the laws fo thermodynamics is beyond dispute.
However, having said that, we should notice that in each time interval equal to the time it takes a photon to travel from the lid to the back wall:
5) the accumulated photons at equilibrium is 4 times the number of photons that enter the light box at each time interval; and
6) at equilibrium the number of photons reflected in each time interval is 3 times the number that enter the light box in each time interval. Of those, 2 times that number are reflected of the back wall, and a number of photons equal to the number that enter are reflected of the lid. This ignores reflections of the side walls which are irrelevant to the overall issue.
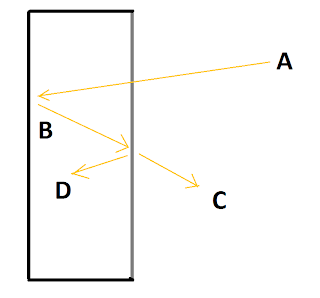
Now, reconsider this model:
The description of the model is found in comment 615 above. Essentially, however, it is the same model as above, except the lid is replaced by a lid which lets in all light from outside and reflects exactly half of light from the inside, transmitting the remainder. The walls are perfectly mirrored.
In this model we have light entering a box (A) at an angle. It then strikes a mirror on the back of the box, is reflected of a mirror on the front of the box so placed that it does not block any incoming light. The now twice reflected light returns to the back of the box, striking the mirror once more. It then goes through a second transparent zone in the front of the box.
Assume the ideal case in which all apertures are 100% transparent, all mirrors are 100% reflective and flat, and in which the light is so angled that neither the incoming beam (A) nor the outgoing beam (C) strike any part of the mirror on the top of the box. In that case, after sufficient time for light to transit the box three times, and with a constant light source providing beam (A), then the box will have the following equalities:
1) Incoming light (A) = Outgoing light (C) (by virtue of conservation of energy).
2) Light reflected from the lid (D) = Outgoing light (C).
3) Light reflected from the back = light striking the underside of the lid (B) = light transmitted by the lid (C) plus light reflected by the lid (D) (by virtue of conservation of energy). This may require a little clarification. The lid consists of three sections in this model, two transparent, and one mirrored on the underside. One transparent section allows in the incoming light (A). The other allows out the outgoing light (C). So the light striking the back of the lid equals the light striking the mirrored section plus the light striking the transparent section through which the light exits.
Therefore
4) Light reflected from the back of the box (B) = light reflected from the back of the lid (D) plus Incoming light (A) = 2 x A (again, by conservation of energy.
Such a box clearly does not violate any law of thermodynamics. If it did violate such laws, so much the worse for those laws, for the box could be set up as a primary school science project, and will behave as advertised. As I assume that the scientists of the world are not part of a massive conspiracy to foist upon us "laws" that can be refuted by any primary school kid with a plate of glass and two mirrors, I will take it that this box does not violate the laws fo thermodynamics is beyond dispute.
However, having said that, we should notice that in each time interval equal to the time it takes a photon to travel from the lid to the back wall:
5) the accumulated photons at equilibrium is 4 times the number of photons that enter the light box at each time interval; and
6) at equilibrium the number of photons reflected in each time interval is 3 times the number that enter the light box in each time interval. Of those, 2 times that number are reflected of the back wall, and a number of photons equal to the number that enter are reflected of the lid. This ignores reflections of the side walls which are irrelevant to the overall issue.
Now, reconsider this model:
The description of the model is found in comment 615 above. Essentially, however, it is the same model as above, except the lid is replaced by a lid which lets in all light from outside and reflects exactly half of light from the inside, transmitting the remainder. The walls are perfectly mirrored.
 After equilibrium is established (ie, in approximately 20 times the time it takes for light to travel from the lid to the back of the box, see Phil's comment @624 and my comments @626 and @640 above), the equalities (1) to (4) above hold of this box as well (with appropriate adjustment of wording - for exact wording see comment 615 above).
However, the facts (5) and (6) also hold of this box (see comment 647 above). Now, these two facts, according to some people, create a problem for this model. According to those people, they cause it to violate the laws of thermodynamics. But as we have seen, our first model (in this comment) has exactly these two properties, and does not violate the laws of thermodynamics. Therefore this model does not violate the laws of thermodynamics either. In fact, the only interesting difference between this model and the previous one is that this model takes about five times as long to reach equilibrium.
So, having established beyond reasonable doubt that the simple light box does not violate the laws of thermodynamics, consider the following model:
After equilibrium is established (ie, in approximately 20 times the time it takes for light to travel from the lid to the back of the box, see Phil's comment @624 and my comments @626 and @640 above), the equalities (1) to (4) above hold of this box as well (with appropriate adjustment of wording - for exact wording see comment 615 above).
However, the facts (5) and (6) also hold of this box (see comment 647 above). Now, these two facts, according to some people, create a problem for this model. According to those people, they cause it to violate the laws of thermodynamics. But as we have seen, our first model (in this comment) has exactly these two properties, and does not violate the laws of thermodynamics. Therefore this model does not violate the laws of thermodynamics either. In fact, the only interesting difference between this model and the previous one is that this model takes about five times as long to reach equilibrium.
So, having established beyond reasonable doubt that the simple light box does not violate the laws of thermodynamics, consider the following model:
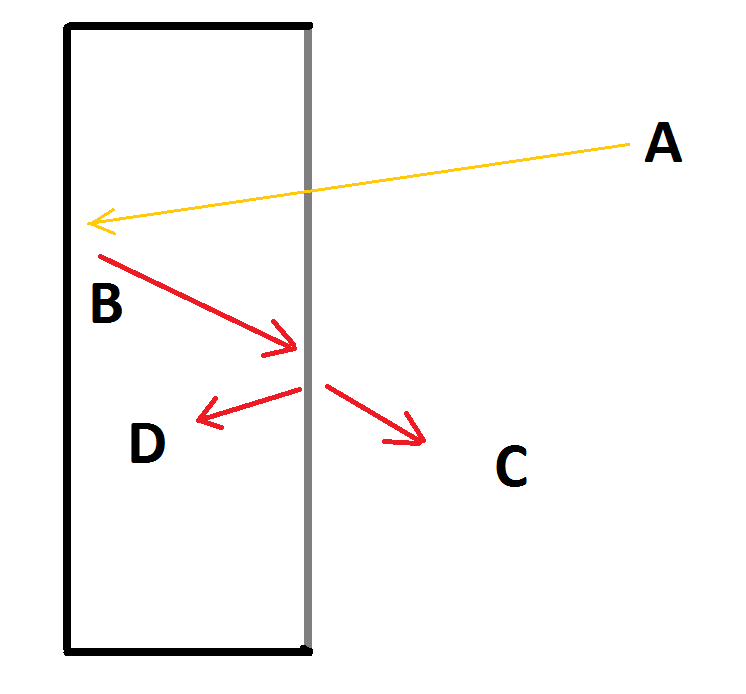 This model is quite different from the preceding two. For a start, (in the ideal case) the back and walls are perfectly absorbing on the inside, and perfectly reflective at all wavelengths on the outside. This means any light entering the box will be absorbed by the box, warming the back of the box. We also suspend the box in a vacuum so that energy can only escape by radiation. Because the outside of the walls and back are perfectly reflective, this means they have zero emissivity and energy can only escape through the lid.
The lid itself has (in the ideal case)perfect thermal isolation from the sides, and back (which means the box contains a vacuum). It is perfectly transparent to all light below a certain wavelength, and perfectly absorbing for all wavelengths above that amount. It (and the back and walls of the box) is also a perfect thermal conductor so that its outside and inside have exactly the same temperature.
Importantly, the wavelength of the incoming light is less than the critical wavelength of the lid. Also, for simplicity, the total energy of the incoming light is less than the amount at which the shortest wavelength of a black body emission from the back and sides of the box is shorter than the critical wavelength.
Given these conditions, when you start shining light on the box, the back and sides will heat up and start emitting long wave length radiation. Because all of that radiation has a wavelength longer than the critical value of the lid, the lid will in turn start heating up and emit radiation. Eventually the energy emitted outwards (C) will equal the energy of the incoming light (A), at which time equilibrium has been reached.
At that time, the following equalities will hold:
1) Incoming energy (A) = Outgoing energy (C) (by virtue of conservation of energy).
2) energy radiated from the lid inwards(D) = Outgoing energy (C) (by virtue of both sides of the lid having the same temperature and emissivity).
3) energy radiated from the back = energy absorbed by the underside of the lid (B) = energy radiated outwards by the lid (C) plus energy radiate inwards by the lid (D) (by virtue of conservation of energy).
Therefore
4) Energy radiated from the back of the box (B) = energy radiated inwards by the lid (D) plus Incoming energy (A) = 2 x A (again, by conservation of energy).
It will also be true that:
5) The accumulated energy in the box in the form of radiation will be four times the energy carried into the box by incoming light in the time it takes for light to travel from the lid to the back of the box.
Indeed, an additional amount of energy will be stored in the back, sides and lids of the box depending on their heat capacity. That means the greater their heat capacity, the longer the box will take to reach equilibrium. That is simple a consequence of the incoming energy being diverted to heat the wall and lid, and therefore not being available to leave the box. It is only when the walls and lid reach a stable temperature that the energy is no longer used in the box, and will leave at the same rate it entered.
Now, very clearly, these 5 facts mirror the first 5 facts in our first, and second model. Therefore, if those five facts do not cause the first two models to violate the laws of thermodynamics (which they do not), then these facts cannot cause the third model to violate the laws of thermodynamics. In fact, the only thermodynamically interesting difference between the first two and the third model is that in the first two, the leaving energy had an almost identical entropy to the incoming energy, whereas in this model, the leaving energy has a much higher entropy in virtue of its much longer wavelengths.
The other interesting fact about this model is that it is an example of (not an analogy to, but an example of) the green house effect. It is a very simple example, but example it is none-the-less. And as this example does not violate any law of thermodynamics, it follows that the greenhouse effect does not violate any law of thermodynamics.
QED
This model is quite different from the preceding two. For a start, (in the ideal case) the back and walls are perfectly absorbing on the inside, and perfectly reflective at all wavelengths on the outside. This means any light entering the box will be absorbed by the box, warming the back of the box. We also suspend the box in a vacuum so that energy can only escape by radiation. Because the outside of the walls and back are perfectly reflective, this means they have zero emissivity and energy can only escape through the lid.
The lid itself has (in the ideal case)perfect thermal isolation from the sides, and back (which means the box contains a vacuum). It is perfectly transparent to all light below a certain wavelength, and perfectly absorbing for all wavelengths above that amount. It (and the back and walls of the box) is also a perfect thermal conductor so that its outside and inside have exactly the same temperature.
Importantly, the wavelength of the incoming light is less than the critical wavelength of the lid. Also, for simplicity, the total energy of the incoming light is less than the amount at which the shortest wavelength of a black body emission from the back and sides of the box is shorter than the critical wavelength.
Given these conditions, when you start shining light on the box, the back and sides will heat up and start emitting long wave length radiation. Because all of that radiation has a wavelength longer than the critical value of the lid, the lid will in turn start heating up and emit radiation. Eventually the energy emitted outwards (C) will equal the energy of the incoming light (A), at which time equilibrium has been reached.
At that time, the following equalities will hold:
1) Incoming energy (A) = Outgoing energy (C) (by virtue of conservation of energy).
2) energy radiated from the lid inwards(D) = Outgoing energy (C) (by virtue of both sides of the lid having the same temperature and emissivity).
3) energy radiated from the back = energy absorbed by the underside of the lid (B) = energy radiated outwards by the lid (C) plus energy radiate inwards by the lid (D) (by virtue of conservation of energy).
Therefore
4) Energy radiated from the back of the box (B) = energy radiated inwards by the lid (D) plus Incoming energy (A) = 2 x A (again, by conservation of energy).
It will also be true that:
5) The accumulated energy in the box in the form of radiation will be four times the energy carried into the box by incoming light in the time it takes for light to travel from the lid to the back of the box.
Indeed, an additional amount of energy will be stored in the back, sides and lids of the box depending on their heat capacity. That means the greater their heat capacity, the longer the box will take to reach equilibrium. That is simple a consequence of the incoming energy being diverted to heat the wall and lid, and therefore not being available to leave the box. It is only when the walls and lid reach a stable temperature that the energy is no longer used in the box, and will leave at the same rate it entered.
Now, very clearly, these 5 facts mirror the first 5 facts in our first, and second model. Therefore, if those five facts do not cause the first two models to violate the laws of thermodynamics (which they do not), then these facts cannot cause the third model to violate the laws of thermodynamics. In fact, the only thermodynamically interesting difference between the first two and the third model is that in the first two, the leaving energy had an almost identical entropy to the incoming energy, whereas in this model, the leaving energy has a much higher entropy in virtue of its much longer wavelengths.
The other interesting fact about this model is that it is an example of (not an analogy to, but an example of) the green house effect. It is a very simple example, but example it is none-the-less. And as this example does not violate any law of thermodynamics, it follows that the greenhouse effect does not violate any law of thermodynamics.
QED
-
johnd at 12:17 PM on 19 March 2011Maize harvest to shrink under Global Warming
michael sweet at 11:35 AM, stop assuming, just show us where in the paper it is stated that all the trials were only of the top performers, which is what you are claiming. Top performers is relative, top performers as compared to what? Top in what aspect? -
L.J. Ryan at 12:09 PM on 19 March 20112nd law of thermodynamics contradicts greenhouse theory
Tom Curtis 675 "the Earth will never be hotter than the surface of the sun" The Earth receives 240W/m2 from the sun. The blackbody temp resulting from this flux represents the maximum temperature...not the sun's surface. That is, regardless of reflection and or re-radiation, 255K is the pinnacle temp for radiation alone. It is this fact by which blackbody was derived...trapping light in order to discover it's maximum thermal energy. ----clipped from another blog: The idea of trapping light is intriguing, and Gustav Kirchhoff (1824-1887) conceived a solution: A hole in a cave. A beam of light could enter this hole but the walls inside would absorb any reflections and prevent the light from escaping. Thus, by confining incoming radiation, the thermal energy which light confers could be shown to its maximum advantage. Kirchhoff's scheme was superior to selectively transmitting glass because a cave absorbs and traps all wavelengths of light,thus creating a complete radiative imbalance. At least theoretically. Well, so what was found by cavity experiments? That a perfectly absorptive ("black") body rises to a temperature a bit higher than an actual black body that’s free to radiate to its surroundings. A theoretical blackbody thereby defines the upper limit of temperature vs radiant absorption. Try to grasp the implication, then. A blackbody cavity mimics the radiative restriction that"greenhouse gases" are said to induce. Indeed, virtually none of the thermal radiation generated inside this cavity is allowed to escape. It "re-circulates" instead, and is sampled through a tiny hole. Does this confinement lead to a runaway greenhouse effect, though? No, it only sets an upper temperature limit — the SAME limit that’s applied to the earth in the first place, for its estimated temperature is based on a blackbody -
MattJ at 11:52 AM on 19 March 2011How Suffolk County Community College students contributed to the Guide to Skepticism
I love the cherry tree diagram too. But it doesn't illustrate anything about climate change, just what "cherry pcking" is and how misleading it can be. Of course, this too is important. It continues to amaze me how many people do not understand the dangers of cherry picking. Speaking of famous fruit tree metaphors, I cannot help but wonder if we could make this more relevant to the AGW issue by remembering the old legend bout Newton and his apple, drawing the cherry tree with a falling blue cherry falling on a certain famous skeptic's head. Then instead of discovering gravity like his countryman, he discovers 'evidence' that there is no global warming;) Yes, you can tell from this that I do not share ribwoods's aversion to ad hominem. Especially not when the fossil fuel lobby is using it so effectively against us all. -
michael sweet at 11:51 AM on 19 March 2011Those who contribute the least greenhouse gases will be most impacted by climate change
Gilles: By definition FF are limited in amount and will eventually run out. Is your contention that when that happens civilization will collapse? What will happen when the FF runs out? I think people are smart enough to find substitutes. Why don't we start now, rather than wait for the climate to be permanently damaged? Since we have already passed peak oil (you claim here that oil cannot be replaced), and the best coal deposits have been mined, your pessimism about the ability of civilization to adapt to less FF will be tested soon enough in any case. At the rate India and China are increasing their consumption, even the USA will have to cut back soon, the oil is gone. -
michael sweet at 11:35 AM on 19 March 2011Maize harvest to shrink under Global Warming
JOhnd: Why would you trial a variety that was not a top performer? To make it to the trial stage a variety must have shown promise. You still have cited only your personal opinion in opposition to peer reviewed data. Not very convincing. -
ribwoods at 11:35 AM on 19 March 2011How Suffolk County Community College students contributed to the Guide to Skepticism
John, 1) I see the smileys in Albatross's post and your response, but -- Please, don't _ever_ think of including ad hominem stuff, as some anti-AGW handouts do. (What if you drew up that speech bubble as a joke, then it accidentally got into the downloadable booklet? Mistakes do happen -- see below.) 2) While the booklet's cherry tree does have a pair of blue cherries, your cherry tree diagram in the article above has none that I can see. (I have red-green color vision deficiency ... but not red-blue color deficiency!)Response: Hmm, JPEG compression must have dulled the blue cherries.
Don't worry, I wasn't planning to use the speech bubbles (no offense, Albatross, I hope :-) -
johnd at 11:27 AM on 19 March 2011Maize harvest to shrink under Global Warming
Before my post is taken out of context, my comments above were about cereals and other crops in general, with a perspective from within Australia. -
Tom Curtis at 11:15 AM on 19 March 2011What would a CO2-free atmosphere look like?
TTTM, @93, well ignore those figures if you like. You are then left with the fact that climate sensitivity as measured over a range of cold (glacial) and warm (ie, with no polar ice caps) conditions yield similar climate sensitivities. From following posts: Luminosity is much lower because the sun was cooler in the past. In essence, as the quantity of Helium rises in the solar core, you need a hotter temperature to sustain the nuclear reaction. The hotter temperature is obtained by the shrinkage of the sun's diameter. This is a straight forward prediction of the standard solar model. It has been partially confirmed by observing other similar stars in different stages of their evolution. Google the "faint young sun paradox" for more information. With regard to carbon dioxide levels, Venus and Earth have basically the same amount of Carbon, but where most of venus' carbon is in the atmosphere, most of Earth's is in carbonate rocks. So there is unquestionably enough carbon on Earth to have a 66% CO2 atmosphere, or even a 90% CO2 atmosphere. Getting that much CO2 into the atmosphere is, however, considered to be a problem still in need of resolution. -
Utahn at 11:14 AM on 19 March 2011Those who contribute the least greenhouse gases will be most impacted by climate change
Gilles, you are avoiding the question, still. I see this has been a waste of time, take care. -
Rob Honeycutt at 11:11 AM on 19 March 2011Those who contribute the least greenhouse gases will be most impacted by climate change
Gilles... Why is it so difficult to comprehend that there are viable solutions to FF energy? I'm always left curious what the resistance is. -
johnd at 11:02 AM on 19 March 2011Maize harvest to shrink under Global Warming
Rob Painting at 09:13 AM, Finally!! Firstly, it is both fortunate and unfortunate that it takes an obstinate contrarian to ignite the spark that seemed so readily apparent. Whilst it may be comforting to be rubbed or patted by others to maintain a pleasant soft glow, such treatment is unlikely to result in the spontaneous combustion that a contrarian can invoke. In Australia, we are now producing 3 times as much cereals from the same acreage as we did 50 years ago. Whilst there are many factors that contribute to that, improved plant genetics have played a significant role. Importantly, the opinion is that that same rate can be maintained over the next 50 years over the world as access to better fertilisers, pesticides and new varieties extend into areas not yet benefiting as we are. I think that many seed companies might disagree with you that significant improvements are not possible. Most such companies claim significant improvements in the yields of their latest varieties over their competitors, and all companies are regularly releasing all types of new varieties, almost annually, with details of trials conducted to support their claims. The real peer review process is conducted by the growers who with commercial, rather than academic, interest driving them will quickly determine whether a new variety offers improvement of not. Perhaps an annual inventory of the seed suppliers shelves would yield the necessary data that would allow an academic study to be undertaken, but by the time it went through the normal convoluted academic peer review process, who would find it of benefit, or even of interest. -
Gilles at 10:52 AM on 19 March 2011Those who contribute the least greenhouse gases will be most impacted by climate change
"Gilles: "Where is the problem ?" The problem is not that there are correlations with wealth and fossil fuel use, just that *you state that fossil fuels increase wealth* and don't support your statements of causation with any facts. As I asked before, do you believe correlation is causation?" No more than for climate studies - how do you compute the effect of climate changes, tell me ? but they are numerous evidence of the necessity of FF - just look at japan and imagine they wouldn't have any FF at all - the distress would be much larger. Tell me just how they would carry rescuers, food, how they would heat , build new buildings. Part of the country without oil are in a total misery - as was Haiti. -
Gilles at 10:46 AM on 19 March 2011Those who contribute the least greenhouse gases will be most impacted by climate change
les : The point was that there have been many incidents of great wealth, technical advance, etc. before oil became ubiquitous." what do you call "great wealth" ? i don't know any wealth comparable with current western countries without or before the use of oil. Michael : I'm speaking of a general correlation and a minimum amount , not of a strict proportionality constant. Impact of climate changes are ALSO statistical, I can find numerous examples where a warming does not produce any inconvenience. Electrical power is the only application that can be replaced by other sources, but in a limited amount. Although some people here seem to ignore that wind energy is intermittent, it is. And there is no interconnected network where wind energy produces more than 25 % of power. So extrapolating the fact that SOME part of the FF consumption can be spared up to zero is just plainly unjustified - although extrapolations seem to be a fashionable game. -
Rob Honeycutt at 10:42 AM on 19 March 2011What would a CO2-free atmosphere look like?
Tim... Have you watched Dr Alley's lecture yet? -
johnd at 10:22 AM on 19 March 2011Maize harvest to shrink under Global Warming
michael sweet at 23:06 PM, the trials produced yields between zero and 15Mg/Ha under optimal conditions. Please show me where in the study it is noted that they only used the results from the best performing varieties, and if that is indicated, just how many specific varieties were used out of all that were trialled to arrive at the conclusions reached. -
alan_marshall at 09:57 AM on 19 March 2011Sea level rise: coming to a place near you
While I believe sea level rise will exceed 1 metre by the end of the century, I need to point out that your map showing projected inundation of Sydney is wrong. I should know. I live there! While there are some low lying areas of alluvial fill south of Sydney Harbour, the red shaded area should be a fraction of that shown on this map.Moderator Response: [DB] Thanks for pointing that out, Alan! Dr. Weiss has indicated that future iterations of the mapping tool will have a number of improvements including superior resolution. Let's hope they are able to obtain more robust datasets from Australia! -
Tom Curtis at 09:57 AM on 19 March 20112nd law of thermodynamics contradicts greenhouse theory
Fred Staples @664: Considering the example of the steel beam, the flames will not melt the steal beam because they will (eventually if it is well insulated) heat the steal to their own temperature. At that point the black body radiation from the steel will carry the same energy as the flames preventing further warming. Applying that example to my light box model, the photons leaving the box will never have a shorter wavelength (= higher temperature) then the photons leaving it. Nor will there be more of them on average, thus conserving energy. Applying that insight to the Greenhouse effect, that means the the surface of the Earth will never be hotter than the surface of the sun (ie, the temperature of the source of the energy that warms it), and the outgoing radiation will never have a shorter wavelength than the incoming solar radiation. You will struggle to find a prohibition against the greenhouse effect from these two facts. -
scaddenp at 09:31 AM on 19 March 20112nd law of thermodynamics contradicts greenhouse theory
" So the vector sums are zero, no atmospheric forcing...no AGW. You have confirmed my position." Umm, this is about whether the GHE is consistent with thermodynamics. If it is, the adding CO2 will create forcing as KR has pointed out. (and is measured at TOA). Now the numbers on Trenberth are derived from measurement and the flux has to be consistent with temperatures. The light box discussion is about understanding why these fluxes are not a violation of 1st law. -
TimTheToolMan at 09:23 AM on 19 March 2011What would a CO2-free atmosphere look like?
OK, At least I've spotted the cause of the fact that the graph bears no resemblance of today's situation... The value of L used is a fair bit lower than today's value. I'm going to have to find where that value comes from and how confident we are in it. Certainly the only value we've ever measured is much higher. -
shoyemore at 09:21 AM on 19 March 2011Maximum and minimum monthly records in global temperature databases
Anderson #53, Thanks for the reference. -
Rob Painting at 09:13 AM on 19 March 2011Maize harvest to shrink under Global Warming
Michael Sweet @ 38 - John D is simply acting the obstinate contrarian, but there is one point he raises which interests me; what improvement (yield %) would there be by comparing the most robust varieties against the trial average. The best of the best so to speak. He seems to believe that this would be significant, but that seems unlikely, given that years of selective breeding only provide incremental improvements. I'd be curious to know nevertheless. Arkadiusz Semczyszak - It has a very poor literature. Simple handwaving brutha. Some analysis?. As for Kim et al 2007, they don't look at yield, and there are so many differences between their experiments and the African field trials, it prevents a direct comparison. But I do note that even in conditions where they are well watered (mitigating heat stress) maize growth declines when temperatures exceed the low 30's. The point of the study of course was to see what effect, if any, CO2 fertilization had on maize. The answer was a resounding zilch. -
TimTheToolMan at 09:13 AM on 19 March 2011What would a CO2-free atmosphere look like?
@Bibliovermis "The CO2 came from unabated volcanic activity and tectonic forces over millions of years." But 66,000ppm (best case) is a lot of CO2. Thats what I mean by wondering whether the numbers add up. Is there enough time to do it? And where is it now? Do those numbers add up too? "I would agree that it makes little sense to look at things like Fig. 2 with a magnifying glass, but the general picture I have presented here is robust to different models and parameterizations" The thing is that people are now using those numbers in reasoning. Assuming the graph is from data output from those models, its pretty clear that the model didn't get it right and it didn't get it right in the area it was most likely to "get it right". What confidence does that give us about the areas where we have no knowledge? "while it is useful to know whether it takes 2000 or 4000 ppm of CO2 in the air to trigger glaciation under Neoproterozoic insolation, it plays little bearing on thinking through these problems on a forum like this." Its not 2000 or 4000 though is it? Its 66,000 or 660,000 and those numbers are much higher than I've seen our historic atmospheric concentrations of CO2 quoted to have been. Perhaps I've simply missed higher ones but the point is that this is a "sanity check" item. And because its so high (if it really is considered very high), then the question of where it came from and where it went to becomes necessary to consider. "are not hand-waving or other such “useless” exercises as he’d have people believe. " That hypothesis (that these results have some semblance of reality) has yet to be shown. Your answer is itself "handwaving". "Second, there is a rather weak vertical temperature gradient in the summer hemisphere of a snowball..." ...fundamentally assumes snowball earth is a a hard snowball which is quite an assumption. -
RickG at 08:51 AM on 19 March 20112nd law of thermodynamics contradicts greenhouse theory
damorbel, The diagram, or schematic as Trenberth calls it, is from one of his many PowerPoint presentations. In other words the schematic is meant to be presented with discussion in context with his presentation. The schematic as many of us have pointed out to you is about incoming solar energy and how it is distributed throughout the climate system taking different forms of energy. In describing this, not only by Trenberth, but all scientists, use the proper units of measure which is watts per square meter, not temperature. But since no one seems to be able to convince you of that, watch Trenberth describe that very schematic himself in this video. -
les at 08:40 AM on 19 March 20112nd law of thermodynamics contradicts greenhouse theory
661 Rysn good try at a twist. I'm afraid that it's transparent to all here that you really are not "doing physics" in your argumentation. At thus stage, really, we're just playing with you. Dont take your arguments so seriously - no one else is. -
Albatross at 08:32 AM on 19 March 2011How Suffolk County Community College students contributed to the Guide to Skepticism
Great news-- wonderful that the students were involved. John a question and a suggestion. How many people have downloaded the booklet to date? The suggestion, maybe one could include text bubbles in that graphic showing the three lonely contrarians (i.e, room full of climate scientists). Maybe something like: Spencer--"Dick where are you, I'm lost?" Lindzen-- "Over here Roy, waay over here. Don't worry, I'm lost too" Spencer-- "OK, but have you seen John (Christy)?" Dick-- "Umm, not sure, saw him a few hours ago looking very lost." Three lonely and wayward "skeptics" lost in a sea of science, facts and reason :)Response: The booklet has been downloaded around 128,000 times since December (that's not counting other websites hosting the booklet or translations).
I'll take the speech bubble idea under advisement :-) -
2nd law of thermodynamics contradicts greenhouse theory
L.J. Ryan - Since the Trenberth numbers are an energy budget, they should add up and cancel out for an unforced climate. If, however, you carefully add up the Trenberth numbers without rounding you get an imbalance of about 0.9 W/m^2 less leaving than arriving. That's the forcing. -
L.J. Ryan at 07:38 AM on 19 March 20112nd law of thermodynamics contradicts greenhouse theory
scaddenp666 Oh...Tom and Trenberth count the photon/flux twice. So the vector sums are zero, no atmospheric forcing...no AGW. You have confirmed my position. -
pbjamm at 07:19 AM on 19 March 20112nd law of thermodynamics contradicts greenhouse theory
L.J Ryan@559 No you would not have a laser, the beam would not be directional since photons would reach the aperture at a variety of angles and travel out that way too. From a photon=particle bouncing around standpoint I think the brightness of that beam would diminish over time as the number of photons hitting the aperture/sec would diminish along with the number in the box. "Light Decay" in the context of the discussion is light losing energy to the imperfect mirrors. As for Tom Curtis' original diagram @615 I think the missing element in most of this discussion is time. Over time A=C but not for every photon interaction. We need to be clear if we are talking about an instantaneous measurement or the totals over time. Same goes for the Trenberth Diagram. note: I am not a physicist nor mathematician. I reserve the right to be wrong. -
Riccardo at 07:09 AM on 19 March 20112nd law of thermodynamics contradicts greenhouse theory
damorbel given that you know how to calculate temperature from the energy flux, why are you asking Trenberth to report it in a summary graph? You really look polemical here, it adds really nothing to the discussion or to the undersdtanding of the energy budget. -
Chris Colose at 07:02 AM on 19 March 2011What would a CO2-free atmosphere look like?
I would agree that it makes little sense to look at things like Fig. 2 with a magnifying glass, but the general picture I have presented here is robust to different models and parameterizations, and also within the geologic record (particularly cap carbonates as a key indicator that the Neoproterozoic glaciations and deglaciations involve a jump between extremely different states). Different cloud parameterizations and feedbacks, simulation of circulation, etc may yield different results, and while it is useful to know whether it takes 2000 or 4000 ppm of CO2 in the air to trigger glaciation under Neoproterozoic insolation, it plays little bearing on thinking through these problems on a forum like this. This is how science advances in general, by building a useful scaffold upon which more technical details can be later hung. I feel like this is self-evident to most people here, and TTTM is just trying to argue; certainly, the results of something like Fig. 2 emerge in simple zero-dimensional energy balance models as well as in full flown GCM’s, and are not hand-waving or other such “useless” exercises as he’d have people believe. There is no fascination with attacking Lindzen either, he was just wrong, and admitting that rather than trying to defend it through “arguments from complexity” would be one more step toward a good discussion. Concerning the rather weak climate sensitivity in a snowball Earth, there are several published mechanisms for why this is the case. The first is the very weak water vapor feedback, which is relatively unimportant in regimes where the tropics are frozen. Without the help from water vapor, CO2 has limited power to warm up a Snowball Earth to the point of deglaciation. This is much less true for condensed water, which is much more efficient of an infrared absorber than water vapor. Second, there is a rather weak vertical temperature gradient in the summer hemisphere of a snowball, and even weaker in the winter hemisphere in which convection is suppressed (much like over Antarctica in the winter). The greenhouse effect can only operate insofar as you have colder air aloft to work with, so a weak lapse rate inhibits the ability for CO2 to do much. In regimes where you could condense CO2 as a cloud, you could generate a scattering greenhouse effect (rather than the traditional absorption and re-radiation we are used to) that works largely independent of the lapse rate (though this also serves as a limit to CO2 accumulation). This could play a role in Polar Regions in the winter time during the Neoproterozoic at high CO2 levels, early earth snowballs, or on early Mars for example.Moderator Response: [DB] Fixed Fig 2 reference per request. -
damorbel at 06:48 AM on 19 March 20112nd law of thermodynamics contradicts greenhouse theory
Re 650 RickG :- "For what Trenberth is demonstrating temperature is neither necessary or relevant in that diagram. I have no problem understanding the diagram myself." It is difficult to believe that a diagram showing emission of thermal radiation (W/^m2) can be considered useful when no indication is given of the temperature of the emitting body; why else would the Stefan-Boltzmann equation (E= rhoT^4) be so widely deployed in thermal physics?Moderator Response: [Muoncounter] you raised this identical 'objection' in November, 600 comments up this very thread. The same replies you received then still apply now. Insistence on mere repetition demonstrates that your argument ran its course. -
Kiwiiano at 06:46 AM on 19 March 2011The Scientific Guide to Global Warming Skepticism
I was looking to commit the booklet to paper, but it needs to be done in colour to preserve the graphics, but much of the text will look terrible on paper. Any chance of a printable version?Moderator Response: [DB] Try here. -
scaddenp at 06:36 AM on 19 March 20112nd law of thermodynamics contradicts greenhouse theory
L.J. Ryan - back to the original light box. We agree that the set up does NOT violate 1st law? No where in the system is energy being created. The thing that seems counter-intuitive apparently is that energy-fluxes appears to double. Whoa! energy creation! No. This illustrates that care has be taken in inferring system energy from energy flux, because in this case, with reflection, the same energy gets counted twice. This is no violation of 1st law going on in Tom's example - nor in Trenberth's diagram for same reason. Just an illustration about care in use of energy flux. -
citizenschallenge at 06:34 AM on 19 March 2011Christy's Unconvincing Congressional Testimony
Wasn't Christy's testimony Under Oath? Isn't there any recourse for officially disputing the factuality of his testimony? -
2nd law of thermodynamics contradicts greenhouse theory
Fred Staples - That's a fairly reasonable (if wordy) description of Entropy. You could have just linked to an existing definition and saved much typing. I think I see where you're going - to an argument that the high levels of IR at the surface somehow violate entropy considerations. You might find my comment here relevant in that regard. We aren't dealing with a closed system, but rather a very open one, where the important issues are rate of energy flow, energy differentials, and internal temperatures and energy levels required to maintain a dynamic equilibrium. Not moving a fixed amount of energy around a closed system. Entropy is increasing as sunlight radiates out into the 3K void of space. Local conditions regarding the conversion of that visible light into thermal IR provide a pinch-point, much like the dam in my analogy, one that includes a local collection of energy in order to have an energy differential sufficient to radiate the IR to space. -
Fred Staples at 05:42 AM on 19 March 20112nd law of thermodynamics contradicts greenhouse theory
The energy quality I described in 498 is obviously related to the inverse of entropy, but people struggle with the latter concept. It is easier to see that quality is related to useful energy – that is, energy that can actually do something, such as producing useful work or raising temperature. In any spontaneous transaction involving energy transfer, quality will diminish. What this means is that the energy cannot go backwards, and some of the useful energy will be lost. (I said I would not mention the second law, but that is what it is really about). Incidentally, 499, real life energy losses through friction, etc, make the situation worse. Energy quantity as well as quality is lost to the system Here is another elementary example. An insulated vessel contains gas at a high temperature, and is separated from a vacuum, within the vessel, by a membrane. If the membrane is punctured, the gas flows into the vacuum, and its pressure drops. No work is done, no heat is lost, so the temperature remains the same. The first law says that energy has been conserved. But the gas is obviously able to do less work, starting from the lower pressure. It is also obvious that (Maxwell's demon apart) the gas cannot go back. What has happened is that the quality of the energy has fallen. It turns out (as the pundits say) that it is this elusive characteristic of quality (strictly entropy) that drives all spontaneous transactions – literally everything from chemistry, biology, energy transfer and (fancifully) the tidiness of your desk. It is the quality of energy, not the quantity, that makes something happen. Here are two well known examples. Suppose that a single gas flame operates at a temperature below the melting point of a steel plate. The steel will not melt because the quality of the flame energy is too low. Now apply ten more similar flames. Still the steel will not melt. Another example is Einstein’s experiment to eject electrons (I forget from what) with a beam of incident radiation. Below a certain frequency (energy quality) nothing happened, no matter what the intensity (energy quantity). Above that frequency, electrons were ejected, and quantum mechanics was born. Sadly, however, my definition of quality (available energy) is too simplistic. It is the relative quality that matters. Switching the argument to a power generator, a source with a high temperature can generate work by transferring energy to a sink at a lower temperature. The available energy is high. If the sink is at the same temperature as the source, nothing will happen. There is no available energy. Likewise, if the sink energy can be connected to a second sink with a lower temperature, space heating is possible. Otherwise the waste energy will be ejected to the atmosphere through cooling towers. So, if I have persuaded anyone that the crucial elements of energy transfer are the qualities of the energies concerned, and that energy can’t go backwards without the performance of extraneous work, we can move on to an even more elusive concept. Heat.
Prev 1831 1832 1833 1834 1835 1836 1837 1838 1839 1840 1841 1842 1843 1844 1845 1846 Next


