


 Arguments


Recent Comments
Prev 1848 1849 1850 1851 1852 1853 1854 1855 1856 1857 1858 1859 1860 1861 1862 1863 Next
Comments 92751 to 92800:
-
Camburn at 03:17 AM on 13 March 2011Interactive animation of the climate change impact on agriculture
I don't know what in the world I am doing wrong, but I can't seem to get the fancy direct link working. Anyways, here is another link concerning soybeans and elevated levels of co2: http://www.eurekalert.org/pub_releases/2009-02/uoia-hcb020609.php -
Camburn at 03:15 AM on 13 March 2011The name is Bond...Gerard Bond.
pbjamm: I am not sure that it is all in one direction. The ice core data from Volstock is for Volstock. An isolated area with a small change in actual temperature verses the lower latitudes. Comparing Greenland to Volstock is not a fair comparison, but must be taken into consideration and evaluated further to a more regional perspective and then graduated out to a global perspective. I am more interested in the hydro cycles that accompany a Bond type event. There are large shifts in that cycle that occur when a Bond event happens and they take 100's of years to move back to "normal". -
Camburn at 02:59 AM on 13 March 2011Interactive animation of the climate change impact on agriculture
Back to co2. This research confirms that soybeans respond very positively to higher levels of co2. http://farmtalknewspaper.com/crops/x1327129664/Research-looks-at-crop-response-to-CO2 -
hengistmcstone at 01:30 AM on 13 March 2011Wrong Answers dot com
Hmmmm I just corrected an answer on Answers.com and it took less than 3 hours to be reverted back to it's original. -
les at 00:01 AM on 13 March 2011It cooled mid-century
12: Dikran MarsupialHowever, I suspect this should be discussed further on another thread.
and, indeed, was touched on previously in the Climate Sensitivity: The Skeptic Endgame where Giles didn't understand it either. Someone might do an intro to modeling, simulation, log-likelihoods and MC methods...Moderator Response: (Daniel Bailey) Are you offering...? -
adelady at 23:06 PM on 12 March 2011Wrong Answers dot com
cloa513. A "meaningless unmeasurable quantity with no scientific value"? The same thing could be said about the average weight of 10 year olds or the average family size. No family has 2.3 or 1.8 or 4.5 children. However, scientists (and policy-makers) concerned with =average= =trends= in family size or health of school age children find numbers representing such trends very useful. The fact that they don't represent anything we can see or feel is entirely beside the point. -
adelady at 21:53 PM on 12 March 2011What would a CO2-free atmosphere look like?
Thanks for that Tom. I cannot see how geography is of any interest in climate calculation length periods. It doesn't change - or at least until Australia's 5cm a year northward movement gets us nearer the equator it won't. One degree of latitude is over 100 kilometres. At 200 years per metre, 200,000 years per kilometre, this is not of any relevance, let alone interest, except to seismologists and a very small subset of geologists. And I really cannot understand how seasonal temperature effects are of any more concern than tidal or diurnal effects. They're all just cycles. Climate is about whether future cycles will be the same, temporarily different (ENSO for example) or permanently different as in ice ages or warming. Permanent is a human generations word here not a geological period word.Moderator Response: [muoncounter] TIS has veered off-topic. This is a thread about a CO2-free atmosphere. Discussion of seasonal solar radiation belongs on It's the sun. Comments there can link back here by including an HREF="" with the URL of the originating comment between quotes. -
cloa513 at 21:14 PM on 12 March 2011Wrong Answers dot com
The real scientific answer to has the global mean temperature changed is the global mean temperature is meaningless unmeasureable quantity with no scientific value. You can't just take a massive list of numbers and take and think its a representative number. Those numbers have a physical meaning which can't be averaged. A boulder of rock at 30C has far more energy than a similar size amount of gas. Supposing it did exist by somehow calculating the internal energy of the climate system (a very tough task) and dividing by the mass- there is no way we could reasonably derive before decent array of temperature measuring satellites was available. Before that very large errors getting worse back in time- basically some time in early history could only be able say its hot or cold. -
Tom Curtis at 21:08 PM on 12 March 2011What would a CO2-free atmosphere look like?
Inconvenient Sceptic @22, 37, and 45: First, you plainly do not understand how the greenhouse effect works, as is shown by your comment @22. The GHE is a consequence of the difference between the energy of the IR radiation to space from gases in the atmosphere, and the energy that would have radiated to space from the surface at those same frequencies has those gases not been present. Because it is the energy balance between radiation to space and radiation from the sun, the energy balance for energy transfers between atmosphere and surface is of only minor interest. Certainly increasing those transfers will not increase the greenhouse effect by itself, and nor will changing the form of the energy transfer. The simple fact that should convince you of your error is the fact that energy radiation from a gas is a function of the gases temperature. Therefore, cooling the atmosphere will reduce the energy radiated by green house gases in the atmosphere, and hence increase the difference between that radiation and that from the surface in the same frequencies. In other words, simply warming the atmosphere weakens the greenhouse effect, not increases it as claimed by you at your blog. Finally, the difference between July and January global temperatures is due to the high proportion of land in the NH, whose low heat capacity results in much faster temperature rises for a given forcing, and much faster falls if that forcing is removed. So much is obvious. What is also obvious is that this is irrelevant to your original and false claims. -
Dikran Marsupial at 20:32 PM on 12 March 2011It cooled mid-century
Giles@11: (a) No, the use of multiple models is not "really strage", it is not even unusual. There is uncertainty in the details of the physic is involved and in the parameters, the use of multiple models captures some of that uncertainty. Secondly if different models give similar results, that indicates that the uncertainty in the physics is small and the climate projections are not greatly sensitive to them. That is a good thing from the modelling point of view, not a bad one. If anything it actually means the data do constrain the models relatively tightly as it constrains them all to say the same basic thing. As to scientific validation, you obviously don't understand there is no such thing as scientific validation, only scientific invalidation. You can't prove a theory right, only disprove it. (b) Complaining that bad models are not selected is pretty daft, if the model is inconsistent with reality it means the assumptions underpinning that model are incorrect, so why should we look at it. The CMIP ensemble were not selected in that way, it is an ensemble of models from leading modelling groups, so your objection is incorrect anyway. Complaining that the black line doesn't go out of the corridor is basically saying "the models must be wrong because they give the right answer"! (c) The models should not expect to produce temperatures that precisely match the observations, that comment shows a complete lack of understanding of Monte Carlo simulation methods. We can't predict the chaotic weather, so the model runs will always be different. The model mean won't match the observations either as it is an estimate of only the forced component of climate, not the unforced response - the observed climate has both components so there is no reason to expect that close a match. "That is not, by far, what I would call an accurate fit of data" well possibly that is because you don't understand the effects of the major sources of uncertainty. Given internal climate variability (which models cannot be expected to be able to model), the hindcast is pretty impressive. However, I suspect this should be discussed further on another thread. -
Gilles at 18:53 PM on 12 March 2011It cooled mid-century
I agree , that's the point. And if I look at the comparison between models and data, I'm not convinced again that the agreement during the first half is so good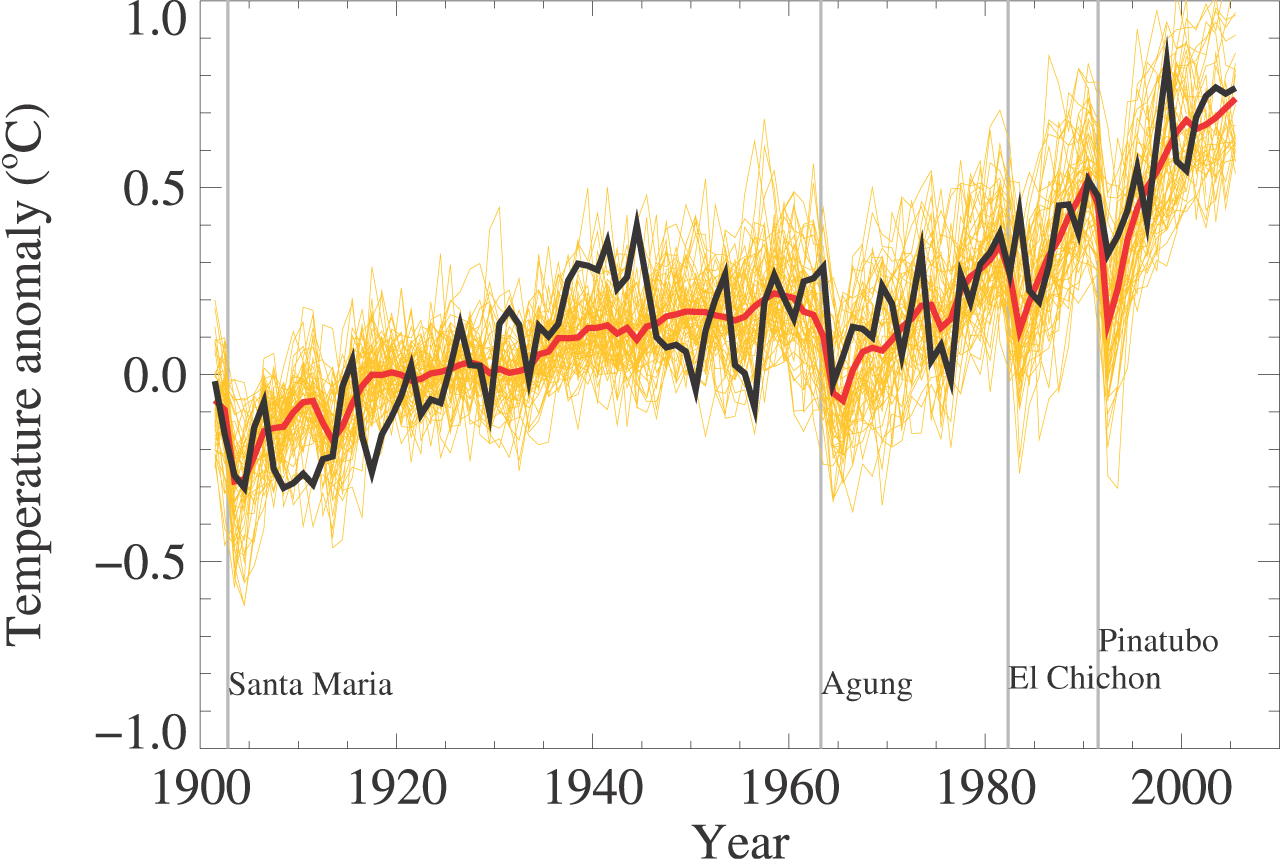 Of course at first glance it seems that the match is almost perfect. But if you look carefully at the first half of the century, and if you look also carefully at the methodology used to produce these curves, you will notice that
a) curves are generated by a variety of different models, which is really strange, since it means that different modelling can produce the same kind of visual output - this really means that observations are only LOOSELY constraining models - which is the opposite of a scientific validation.
b) the models contain parameters , especially for clouds, so there is an obvious selection bias due to the fact that bad models are simply not selected here. In other words, adding a superposition of approximate models with a selection of parameters giving results close to the data, will ALAWAYS produce an interval, a corridor , containing these data - it's almost certain and doesn't prove much. Note how curiously the black observed curve travels throughout the corridor and never crosses the border : is it not surprising that a unbiased set of models just reproduces exactly the range of natural variability, without any "lost space" in the yellow interval or without the black curve goint out of it? this cannot for sure be obtained without a selection of the sample.
c) models produce temperature that are not precisely matching the reality in absolute. What is displayed here is ANOMALIES. Anomalies with respect to which baseline ? you have to read carefully the report to find the answer : with respect to the 1900-1950 period. So the agreement at least on the central point of the first half is automatically insured - no surprise here.
So the real test of the preanthropic period is not the average value, but the details of the shape around this value. Is it well reproduced ? not so much. The break around 1940 is NOT reproduced in models - it just the width of the interval that blurs out the comparison. The only break in the models are in major volcanic eruptions - first Agung in 1963. Note also that volcanic eruptions are NOT so conspicuous in data. Actually if you look only at data, you couldn't say when these eruptions occured, contrary to the models. So it seems that models "play" with eruptions to try to reproduce breaks that are not really at the right place - playing with a whole interval of parameters to blur out the disagreement.
That is not, by far, what I would call an accurate fit of data.
Of course at first glance it seems that the match is almost perfect. But if you look carefully at the first half of the century, and if you look also carefully at the methodology used to produce these curves, you will notice that
a) curves are generated by a variety of different models, which is really strange, since it means that different modelling can produce the same kind of visual output - this really means that observations are only LOOSELY constraining models - which is the opposite of a scientific validation.
b) the models contain parameters , especially for clouds, so there is an obvious selection bias due to the fact that bad models are simply not selected here. In other words, adding a superposition of approximate models with a selection of parameters giving results close to the data, will ALAWAYS produce an interval, a corridor , containing these data - it's almost certain and doesn't prove much. Note how curiously the black observed curve travels throughout the corridor and never crosses the border : is it not surprising that a unbiased set of models just reproduces exactly the range of natural variability, without any "lost space" in the yellow interval or without the black curve goint out of it? this cannot for sure be obtained without a selection of the sample.
c) models produce temperature that are not precisely matching the reality in absolute. What is displayed here is ANOMALIES. Anomalies with respect to which baseline ? you have to read carefully the report to find the answer : with respect to the 1900-1950 period. So the agreement at least on the central point of the first half is automatically insured - no surprise here.
So the real test of the preanthropic period is not the average value, but the details of the shape around this value. Is it well reproduced ? not so much. The break around 1940 is NOT reproduced in models - it just the width of the interval that blurs out the comparison. The only break in the models are in major volcanic eruptions - first Agung in 1963. Note also that volcanic eruptions are NOT so conspicuous in data. Actually if you look only at data, you couldn't say when these eruptions occured, contrary to the models. So it seems that models "play" with eruptions to try to reproduce breaks that are not really at the right place - playing with a whole interval of parameters to blur out the disagreement.
That is not, by far, what I would call an accurate fit of data.
-
angusmac at 18:30 PM on 12 March 2011Climate Emergency: Time to Slam on the Brakes
Albatross @99 the paper I refer to is Hansen (2006) which is not too old. Your diagram @63 from realclimate appears to be quite impressive; however the temperature data does not look quite so impressive when used in context with AR4. Figure 1: IPCC Scenarios A1B, A2 & B1 Compared with Measured HadCRUT3 Temperature Data (after AR4, 2007)
Figure 1 is based on IPCC AR4 Figure TS.26 on to which I have plotted the latest HadCRUT3 data. The black dots in the original diagram appear to be HadCRUT3 data but they are slightly misaligned with actual HadCRUT3 data (my blue dots). Therefore, I offset the HadCRUT3 data by adding 0.018°C to achieve a reasonable fit with the individual data points shown in AR4. The blue line with white dots is the smoothed HadCRUT3 data.
It is evident from Figure 1 that the smoothed HadCRUT3 curve give an excellent fit with observed data presented as the solid black line in AR4. It is also evident that the observed temperature trends are significantly below the "likely" warming/emission scenarios presented in AR4. Indeed, the current trend is similar to the emissions-held-at-year-2000-level scenario.
I would appear that Mother Nature is putting the brakes on for us.
Figure 1: IPCC Scenarios A1B, A2 & B1 Compared with Measured HadCRUT3 Temperature Data (after AR4, 2007)
Figure 1 is based on IPCC AR4 Figure TS.26 on to which I have plotted the latest HadCRUT3 data. The black dots in the original diagram appear to be HadCRUT3 data but they are slightly misaligned with actual HadCRUT3 data (my blue dots). Therefore, I offset the HadCRUT3 data by adding 0.018°C to achieve a reasonable fit with the individual data points shown in AR4. The blue line with white dots is the smoothed HadCRUT3 data.
It is evident from Figure 1 that the smoothed HadCRUT3 curve give an excellent fit with observed data presented as the solid black line in AR4. It is also evident that the observed temperature trends are significantly below the "likely" warming/emission scenarios presented in AR4. Indeed, the current trend is similar to the emissions-held-at-year-2000-level scenario.
I would appear that Mother Nature is putting the brakes on for us.
-
The Inconvenient Skeptic at 17:44 PM on 12 March 2011What would a CO2-free atmosphere look like?
Rob and Alb and Muon, I do understand what global warming is about..... Really. Thanks for linking the NOAA site. I hope people will accept that as not made up. I believe that Jones himself did the study that provided the NOAA the data. Also, the average temperature of the Earth does not change during the day. Half is cooling, half is warming. It stays constant over the course of a day. It does change over the course of the year, by 4C. Here is my question. A serious and legitimate question. Define a forcing mechanism that causes July (lowest solar forcing) to be warmer than January (maximum solar forcing). Forcing doesn't fit. Describe to me a mechanism that causes the minimum energy point to be the warmest time of the year. By CO2 models January should be warmer than July. Please check. In January the Earth gets ~7% more energy than it does in July, but July is also ~4C warmer. Explain the warmer July to me without using geography. It cannot be done, not matter how hard you try. If you don't think that matters, that is fine. But if accurate, it does prove that geography plays a very strong role in global temperature. Convince yourselves that I am either right or wrong on that point. Then we can talk more. -
pbjamm at 15:37 PM on 12 March 2011The name is Bond...Gerard Bond.
Camburn, I think the point is (and I am sure I will be corrected if wrong) that the Bond Event may be a global temperature variation but it is not all in one direction. So the net change is neither positive nor negative, more flat. -
Camburn at 14:50 PM on 12 March 2011The name is Bond...Gerard Bond.
Thank you DB. I tried to convert the link but still have not figured out how to do that. What the paper shows, at least to me, is that there is an obvious link to the hydrological cycle world wide and Bond events. The changing of the thermocline in the Northern Hemisphere that happens during a bonna fide Bond event affects not only the Western NA continent, but also South America. Even tho the temperature may cool in the NH and rise in the SH, the overall affect is a world wide phenomenon.Moderator Response: [DB] If you go here, you find tips on how to do that. For links or documents like pdf's, copy the first indented line of html string (everything between the leftmost-arrow and rightmost-arrow, including the arrows), replacing the text between the double-quotes with your desired source url plus giving some kind of description/name of the linked page/source.For images, look under the section that says IMPORTANT. Copy the html tag string that appears there into your comment box, insert your desired url string for your link source between the double-quote marks and then Bob's-your-uncle (you're ready-to-go).
-
muoncounter at 14:48 PM on 12 March 2011Christy's Unconvincing Congressional Testimony
"The winter weather is weather... " That's just half of NOAA's conclusion; I'll repeat the remainder: ... we can make probabilistic statements about future climate, given a long data record and a good understanding of the state of the forces that drive the system. This is not inconsistent with statements made by Zwiers: ... human influence is now affecting the frequency and intensity of high impact events that put people and their livelihoods at risk. Moreover, studies of two specific events (the European 2003 heat wave, and flooding in the UK in the autumn of 2000) have shown that the odds of those events had been increased substantially relative to the world that would have been in the absence of human induced increases in atmospheric greenhouse gases. Nor is it inconsistent with the statements made here: Weather in a given region occurs in such a complex and unstable environment, driven by such a multitude of factors, that no single weather event can be pinned solely on climate change. In that sense, it's correct to say that the Moscow heat wave was not caused by climate change. However, if one frames the question slightly differently: "Would an event like the Moscow heat wave have occurred if carbon dioxide levels had remained at pre-industrial levels," the answer, Hansen asserts, is clear: "Almost certainly not." The frequency of extreme warm anomalies increases disproportionately as global temperature rises. "Were global temperature not increasing, the chance of an extreme heat wave such as the one Moscow experienced, though not impossible, would be small," Hansen says. -
Camburn at 14:36 PM on 12 March 2011Christy's Unconvincing Congressional Testimony
muoncounter: Thank you for reading the link and commenting on it. The winter weather is weather and not in any way tied to AGW. The only reason I brought this up is that Mr. Zwiers brought it up in his testimony. -
Camburn at 14:33 PM on 12 March 2011Christy's Unconvincing Congressional Testimony
DB@46: I didn't know that the site in question was a skeptic site. The graph came up in another discussion and when I saw that it was NOAA data including the link I deemed it credible. I have not been to the site in question so I can't comment on it one way or the other. The graph only confirmed other research that I have read concerning hydrological cycles in the US. This is something that I am keenly interested in as it directly affects what I do. Thank you for letting me know about that site.Moderator Response: [DB] A kindly word of advice: always seek out the source of any graph or data that interests you on blogs. Even well-meaning persons make honest mistakes. There are those less well-intentioned whose presentations lose fidelity when compared to the sources they claim to cite. The originating source is typically most credible. When even a credible source, such as NOAA, cites a study that interests you, check the original study (where possible) and those that cite it as a basis for further research. The true skeptic follows that route. -
muoncounter at 14:19 PM on 12 March 2011Christy's Unconvincing Congressional Testimony
Camburn, "I posted a link from NOAA concerning the winter of 2009-2010. Has anyone actually read it?" Yep, especially when I got this far: Still, bitter cold temperatures and blizzards of historic proportions prompted the questions: Why were there so many historic snowstorms in the mid-Atlantic region this winter? Are they evidence that global warming isn’t happening? No, the globe is warming. But the real story behind the mid-Atlantic’s winter isn’t about climate change, it’s about climate variability. Climate variability, the term scientists use, explains why record-breaking snowstorms and global warming can coexist. In fact, many of the weather events observed this winter help to confirm our understanding of the climate system, including links between weather and climate. ... predicting any single weather event is inherently difficult and why we don’t base our assessments of climate on any single weather event. And it shows why we can make probabilistic statements about future climate, given a long data record and a good understanding of the state of the forces that drive the system. --emphasis added Once again, the message is that specific weather events have disparate causes; but the overall warming pattern makes what were once infrequent and unlikely events more likely. Whoever first said, 'If you don't like the weather, wait 10 minutes' knew what he was talking about. -
muoncounter at 13:57 PM on 12 March 2011Christy's Unconvincing Congressional Testimony
"Rain is a normal part of them is it not? Is not the destruction caused by the energy of the hurricane? Which is bore out by wind speeds etc? The destruction is caused by the winds. " This discrepancy is discussed on the hurricanes and global warming thread. Large rain events, also very destructive, are not included in the ACE index. -
muoncounter at 13:51 PM on 12 March 2011What would a CO2-free atmosphere look like?
"Where the energy of the sun strikes causes more "feedback" than any of the GHG's. The location of the long term insolation changes matter most, not the magnitude." I find this mystifying. The comment starts with seasonal variation, then morphs to 'long term insolation change.' This is not the first time a 'skeptic' has attempted to interpret seasonal temperature change as an argument against AGW. But it makes no sense: All of that system has been in place for a long, long time. Pardon me for asking, how does that have anything to do with recent warming - or anything else in recent history other than the seasons themselves? -
Camburn at 13:45 PM on 12 March 2011Christy's Unconvincing Congressional Testimony
DB: NOAA, at least to me, is a credible source. The University of Florida is also credible. As far as a disinformation site, you have lost me.Moderator Response: [DB] In your comment in question, your second link was from http://c3headlines.typepad.com, which serves up disinformation. Example: "NOAA February Data Confirms U.S. Has Been Cooling The Last 15 Years: -1.9°F/Century Trend" = Hokum. I applaud using credible sources such as NOAA or Florida State University, but to put those fine institutions on a par with the like of c3headlines is to de-value the contribution of your entire comment. You can do better (and you have indeed done so in other comments). -
Interactive animation of the climate change impact on agriculture
johnd - I agree that local and regional weather and longer term climate will be vital to the impact and response of climate change on everyone. But you have not, as we were discussing, made the case that the 30 year averaging of variability to identify statistically significant trends is invalid. -
Camburn at 12:26 PM on 12 March 2011Christy's Unconvincing Congressional Testimony
I am curious. I posted a link from NOAA concerning the winter of 2009-2010. Has anyone actually read it? It disputes Mr. Zwiers assertion that the recent winters are tied to AGW in the US. As far as hurricanes/cyclones. Rain is a normal part of them is it not? Is not the destruction caused by the energy of the hurricane? Which is bore out by wind speeds etc? The destruction is caused by the winds. Florida State University has a site that shows intensity and numbers.Moderator Response: [DB] That comment also contained material taken from a denialist disinformation site, so I personally stopped reading at that point. Material taken from original, peer-reviewed sources is best for building a credible, science-based argument here. -
Marcus at 12:20 PM on 12 March 2011Interactive animation of the climate change impact on agriculture
John D, if you *honestly* think that I'm going to risk exposing myself to abuse & intimidation by your "skeptic" friends, by revealing more about myself than I already have, then you're sadly mistaken-especially as you still remain unwilling to do so yourself.. The only reason I said as much as I did was to disabuse Camburn of any illusions that I don't have working knowledge of current day agricultural practices (heck, my Mum & Step-Dad own a farm, for Pete's sake). Still, the fact that you've chosen to cast aspersions on my credentials reveals how weak the arguments you & Camburn have presented *really* are. Though its not my actual field of expertise, I have taken the time to read up on the literature regarding enhanced CO2 levels on crop plants, & they simply do *not* paint the incredibly rosy picture that you & Camburn try to do-even when the studies ignore all the other negative impacts that will be associated with CO2 induced climate change. I also have to love how you place so much *faith* in untested hypotheses, when you think they might support your AGW skepticism, yet you still show an unwillingness to accept more than 100 years of accepted science regarding the impacts of increased CO2 in our atmosphere. I guess your "skepticism" is very selective. -
adelady at 11:50 AM on 12 March 2011Human CO2 is a tiny % of CO2 emissions
This item at Tamino's gives a very nice analogy for the "it's not very much" line of thinking. At least I like it. -
NewYorkJ at 11:42 AM on 12 March 2011Examining Hansen's prediction about the West Side Highway
Chrisd3, I haven't lived in NYC since the 1980's, so I'm not sure what changes have been made. Persistent flooding would seem to depend on a number of factors, including elevation and regional sea level rise (the global rise isn't distributed evenly). HR: "But what's more important speculation by an influential climate scientist who's helping to shape the IPCCs position or a blogger?" Watts is not shaping the IPCC position or the science. I think the blogger would argue that he's helping to shape public opinion, perhaps more so than the IPCC. He and others certainly want to be seen as credible sources, taken as seriously as the scientists. It would be nice if the public (and politicians for that matter) could distinguish between objective science and his brand. -
Camburn at 11:11 AM on 12 March 2011The name is Bond...Gerard Bond.
This paper shows a correlation between Bond Events and precip in Peru/Bolivia http://eas.unl.edu/~sfritz/pubs/BakerJQS05.pdfModerator Response: [DB] (Converted URL to Link) Personally I think it's great that you're referencing primary source literature. But your description of it lacks an evaluation of whether you think it supports the topic of this post or serves to undermine it. Perhaps if you could add some further characterization of the study you reference it would serve to better enhance the discussion here. Thanks! -
johnd at 10:23 AM on 12 March 2011Interactive animation of the climate change impact on agriculture
KR at 09:26 AM, collectively, regional weather is our both our means of being able to quantify global climate, and being able understand how it manifests itself at any point in time, past, present or future. Ocean heat content is central to global climate and thus anything that plays into that by altering the conditions that drive the heat flux at the surface is most relevant. Systems such as the IOD have both a "front" and a "back" and given the physical world is neither uniform nor symmetrical across it's surfaces, the frequency of the oscillations and the time spent in each phase does not necessarily mean that everything balances out once a complete cycle has occurred. As you noted the IOD is very relevant to Australia, and it is only since being identified that it has become realised that some of what had previously been attributed to ENSO was in fact due to the IOD. I believe that some studies have, or are being carried out, taking the IOD into account may mean the influence of ENSO is not as great as presently thought. Even without such studies we now know that to be the case for Australia, especially where droughts are concerned, and perhaps floods as well. Time will tell. -
Albatross at 10:21 AM on 12 March 2011What would a CO2-free atmosphere look like?
Rob @40, He is probably referring to the range in mean global UAH lower tropospheric temperature as shown on Christy's site, which by my reckoning has an amplitude of 3 K, not 4 K. I would like to see what RSS shows though. BUT, again, given the attempts of TIS to obfuscate, I can only conclude that he agrees with Lindzen's erroneous number, because he certainly has not said nothing to have us believe otherwise-- in fact he seems to suggest a lower number (unless lindzen was referring to Fahrenheit and not Kelvin). So instead, he ties to detract from Lindzen being out by an order of magnitude. The physics and science simply do not support Lindzen's number. Anyone, who argues differently must be arguing from a belief system or ideology, and not science, or worse yet, distorting/mangling the science the fit their belief system. And I look forward to TIS submitting a paper to science to refute Lacis et al......... These are desperate days for "skeptics" and contrarians and is showing in the quality of their posts, and their desperate attempts to detract from the failings of their "heros". In recent months Lindzen, Spencer, Michaels, Carter and Christy have been (for the umpteenth time) exposed for what they are-- disinformers and obfuscators intent on confusing the public, who are seemingly driven by ideology and not science. The really scary thing is that, given their training, they must know better-- it is hard to believe that they are innumerate (to borrow a term used by Gareth Renowden in a similar situation) given their training. As you can tell my patience with these disingenuous abusers of science and people who talk though their hats has long run out. I hope readers following SkepticalScience not the vacuity of physics and science in arguments used by "skeptics". I suggest TIS submits a paper to science trying to refute Lacis et al. (2010). -
Rob Honeycutt at 10:19 AM on 12 March 2011What would a CO2-free atmosphere look like?
I actually found the data TIS is referring to here at NOAA. But TIS is still missing the very basic point of what global warming actually is. -
dana1981 at 10:13 AM on 12 March 2011Wrong Answers dot com
wingding - I agree, the site certainly isn't set up to provide accurate answers to scientific questions. However, it's important to make people aware of that fact. As long as they're going to attempt to answer scientific questions, people should be aware that the quality of those answers is poor. -
wingding at 09:59 AM on 12 March 2011Wrong Answers dot com
You are wasting your time trying to correct it. My guess is answers.com was created to provide answers to trite general knowledge questions like "which band sung XYZ" etc. Not scientific questions. Q. Co2 produce by human? A. Humans make a bunch of Co2, no seriously: http://wiki.answers.com/Q/Co2_produce_by_human -
RickG at 09:56 AM on 12 March 2011What would a CO2-free atmosphere look like?
# 37 ICS, Could you please post a source for that 4C range? I would like to see the arithmetic. -
Interactive animation of the climate change impact on agriculture
johnd - I spent some time looking into the IOD; it's not something I was familiar with. You're quite right, the IOD has been mostly positive for years now, and may be exiting the "quasi-periodic oscillation" category for a more persistent pattern. But quite frankly, the IOD is regional weather, not global climate. Wind patterns move warm water to the west, with resulting colder upwelling near Sumatra. The overall effect is a redistribution of warmth, but not a global trend - an increase or decrease in energy retained. The shift to a more persistent pattern appears to be an example of regional climate change, like the northern movement of the equatorial rain belt, which will probably begin to raise coffee prices in coming years as Central American (among others) precipitation shifts and the southern US dries out. The IOD appears to be more persistent due to climate driven wind changes. The IOD is a huge influence on Australian weather - but does it affect long term global temperature averages??? Perhaps it will result in a 'step change' if it stops varying, although I can only see that if the long term shift changes absorption of solar energy, rather than redistribution. But if it stops varying due to long term wind shifts, it's certainly will affect temperature variance even less than it does now. The 30 year running average may have a change like the one around 1945 or 1975. But the time required to extract a statistically significant trend from varying data will actually reduce if the IOD ceases to vary. -
WheelsOC at 09:25 AM on 12 March 2011The name is Bond...Gerard Bond.
Thank you, I've been looking for more information about the "Roman Warming." Usually data presented is only from the northern hemisphere, but it's used to allegedly put the current global climate "in perspective." -
Rob Honeycutt at 09:24 AM on 12 March 2011What would a CO2-free atmosphere look like?
TIS... I have to say, I'm having a hard time finding this signal of 4C global average temperature swings in the data. -
sidd at 09:22 AM on 12 March 2011What would a CO2-free atmosphere look like?
The second graf in the article and the one posted by Mr. Colose remind me of the PV curves with the van der Waals correction and the Maxwell construction. -
Phil at 09:20 AM on 12 March 2011The Earth's Sixth Mass Extinction May Be Underway
Dana's main article says: "The authors' second conclusion is that if we continue on our present course, we could be headed towards a mass extinction event within a timeframe of just a few centuries. Therefore, it's very urgent that we steer away from our mass extinction course immediately." (My italics) LandyJim #46 complains saying that "extinctions of the overwhelming majority of species in the last 400 years is nothing to do with climate change" (my italics) I find that it's always worth reading the article before commenting on it. -
Rob Honeycutt at 09:15 AM on 12 March 2011What would a CO2-free atmosphere look like?
TIS... What you seem to be missing is this is not about absolute temperatures. In a given day the temperature rises and falls vastly more than the most dire global warming predictions. This issue is that we are nudging the distribution curve out one direction producing warmer average temperatures and greater extremes. -
The Inconvenient Skeptic at 08:33 AM on 12 March 2011What would a CO2-free atmosphere look like?
To those that continue to argue solar forcing.... Between January and July of each year the average temperature of the Earth increases ~4C. Between July and January the average temperature of the Earth drops ~4C. The maximum energy from the sun is opposite of that cycle. The Earth receives maximum energy in January and minimum in July. The factor that causes that behavior is the differing geography of the two hemispheres. If they had equal geography then Jan-Feb would be warmest and Jul-Aug the coolest. The geography of the Earth causes more of a temperature change each year than even the IPCC's most dire predictions. Where the energy of the sun strikes causes more "feedback" than any of the GHG's. The location of the long term insolation changes matter most, not the magnitude. That is why the "arithmetic" is not believed. It does not explain the annual temperature cycle. -
johnd at 08:19 AM on 12 March 2011Interactive animation of the climate change impact on agriculture
KR at 07:41 AM, you are looking at it more from a weather perspective by ignoring how ocean heat content becomes a function of these longer term cycles. With regards to the IOD, you've also overlooked the most recent history where it remained in a positive or neutral phase from 1992 until it's present negative phase, which was the longest period of it's kind since records began in the late 1800's. However, from an Australian perspective, and by extension all other regions on the ocean's rim, it's the fact that it oscillates differently to adjoining systems. This current situation of a -ve IOD coinciding with a La-Nina last occurred in 1975 bring a similar extended wet period to Australia and no doubt having a similar effect on the ocean heat flux. Other years where they have also coincided could include 1942, 1933, 1917, 1916, 1909 and 1906, however that depends on how different agencies classify the occurrence. Apart from the most recent coincidence, 1975 is the only other year that is common to all. -
scaddenp at 08:15 AM on 12 March 2011What would a CO2-free atmosphere look like?
" If you compare those figures I believe you're going to see that an enhanced greenhouse effect is going to overwhelm any orbitally forced cooling." This has been pointed out to TIS before but so far as I can see he doesnt believe arithmetic. -
dana1981 at 07:56 AM on 12 March 2011The Earth's Sixth Mass Extinction May Be Underway
LandyJim #46 - you're free to think whatever you like. I merely reported on a study in which the scientific experts disagree with your beliefs on the subject. Agnostic #47 - good summary. As you say, there are clear signs (the rapidly accelerating extinction rate) that we're on a very dangerous path.
-
From Peru at 07:55 AM on 12 March 2011What would a CO2-free atmosphere look like?
During the exit from a snowball event, one essentially goes from a completelely ice covered planet to an iceless planet as the CO2 content of the atmosphere reach 10%. The temperature in the snowball aftermath reaches between 40ºC and 50ºC. Oxygen isotopes of cherts 3.5–3.2 Gyr (Archean Eon) indicate temperatures of 70 +/- 15 ºC, indicating that temperatures then may have been even higher in earlier times. My question is: in the Ancient Earth, during periods when temperatures where between 40ºC and 70ºC, what would the atmosphere be like? In particular, given the enormous atmospheric water vapor content due to the high temperature, would the planet be completely covered by clouds, like today is the planet Venus? (I mean clouds made of water droplets of course, unlike the Venusian clouds that are made of H2SO4 droplets) And what net radiative effect can have a 100% cloud cover, that is, what dominates, the reflection of shortwave radiation (the cooling effect of clouds) or the cloud greenhouse effect on longwave radiation (the warming effect of clouds)? -
Interactive animation of the climate change impact on agriculture
johnd - You're quite correct, our understanding of things like the ENSO have improved tremendously over the last century. That means we can now account for them in normalizing temperature records, as Tamino has done. And that therefore there is justification for using shorter time periods to detect trends with such variations removed. Not justification for longer periods. The Indian Ocean Dipole (IOD, which you had not clarified) cycles about four times every thirty years, similar in period to the ENSO. And hence the 30 year averaging should encompass the IOD as well. The initial 30 year average came out of looking at long term temperature records, variation and noise, and numerically looking at how long a period was required to detect a statistically significant trend against that variation. The statistics haven't changed - 30 years is still the right time period, although if we back the ENSO and other detectable variances out we have a chance to identify trends with shorter periods. Unless you have identified a 15-40 year or greater cycle that isn't being accounted for? You might then want to look at Tamino's recent post on identifying unknown cycles and relationships. I'm still not hearing a justification for a longer time period for climate estimation - but rather a shorter one if properly calculated. -
johnd at 07:32 AM on 12 March 2011Interactive animation of the climate change impact on agriculture
JMurphy at 01:40 AM, given your anxiety about this matter and subsequent urging that "perhaps we should leave it to the particular experts in that particular field", let me assure you that it is unlikely that such changes will be implemented in this thread, at least not today, and certainly not without your consent. Perhaps the moderators can suggest a more suitable thread where it can be implemented. -
johnd at 07:18 AM on 12 March 2011Interactive animation of the climate change impact on agriculture
KR at 01:49 AM, it was with such as the ENSO in mind that has long had me considering this question. Our understanding of weather and climate has undoubtedly expanded somewhat since this "standard" was adopted, tracking our ability to measure all the parameters. Identifying ENSO, let alone understanding it was still yet to come, so ENSO could not have been in their minds at the time of the adoption. The various indexes that track the phases of the atmosphere/ocean systems are all recent advances, the IOD only about a decade ago. They all have become most relevant to our understanding, yet we still are yet to understand how they interact fully. Identifying the IOD was of particular relevance to Australia allowing some order to be bought to the cycles of drought and flooding rains. Therefore confining ourselves to averaging over a couple of ENSO events is akin to averaging the weather over a couple of day night cycles as opposed to averaging it over a couple of annual cycles. My thoughts are that whatever period is used should as a minimum cover a couple of complete cycles of those oscillations that have so far been identified and thus able to be measured, because ultimately it is not about simply measuring temperature fluctuations, but about accurately tracking heat in and out of the oceans which is where the length and frequency of such cycles becomes most relevant. Some paranoia seems to exist about making any changes, as it always has done so. In this case it seems the fear is that by extending such periods the graphs will have to extend from paper edge to paper edge which could lead to one falling off the edge of the paper whilst trying to explore the extremities. sigh-- some things never change. -
dana1981 at 07:13 AM on 12 March 2011Wrong Answers dot com
Good point perseus. The original model of Answers.com was useful. Once they started relying heavily on WikiAnswers though, that seems to be when it started going downhill. And yes, the site's treatment of all opinions as equally valid on a scientific issue is simply inexcusable. I doubt they would approve of Creationists answering evolution questions with their opinions. -
RickG at 07:10 AM on 12 March 2011What would a CO2-free atmosphere look like?
RSVP: The job of a teacher is to teach people how to think, not "having things explained". No, it involves both.
Prev 1848 1849 1850 1851 1852 1853 1854 1855 1856 1857 1858 1859 1860 1861 1862 1863 Next


