


 Arguments


Recent Comments
Prev 1850 1851 1852 1853 1854 1855 1856 1857 1858 1859 1860 1861 1862 1863 1864 1865 Next
Comments 92851 to 92900:
-
Arkadiusz Semczyszak at 20:23 PM on 11 March 2011What would a CO2-free atmosphere look like?
Lindzen, once again draws attention mainly to the complex issue of feedback, knowledge of which (even the major) is still small (especially negative). Very interesting - the easy way (understandable for all of them) - it is a "phenomenon" described here: Temperature and CO2 feedback 'weaker than thought', BBC 2010 It is noteworthy example of this great area of uncertainty: Effect of soil moisture and CO2 feedbacks on terrestrial NPP estimates, shows that both reduce to zero (CO2-free) - and the doubling of our CO2 emissions - can be far less important - than previously thought (though I must admit that, and fourth IPCC report gives a very wide limits for response to a doubling of CO2). “Often, despite dramatic leaf level impacts due to climate changes, the natural ecosystem tends to buffer and does not show a dramatic response. Our analysis suggests that the interactions between the biotic and abiotic changes tend to have a compensatory /antagonistic response. This reduces the effect of the variable change on the overall system response. Our results indicate that the effect of soil moisture availability (and drought) is an important modulator of the terrestrial carbon cycle, and its impact for both present day as well as climatological feedback (under doubling of CO2 or ENSO like events) needs to be investigated.” And climate change has never simply failed to associate with the Sun. Climate change and solar variability: What's new under the sun?, Bard and Frank, 2006.: “Overall, the role of solar activity in climate changes — such as the Quaternary glaciations or the present global warming — remains unproven and most probably represents a second-order effect.” -
RSVP at 20:19 PM on 11 March 2011What would a CO2-free atmosphere look like?
CO2 emits IR as much as it absorbs it. (If this were not the case, CO2 molecules would be trapping energy indefinitely.) So in having more CO2 in the atmosphere, while more IR is absorbed, you also have a greater channel for outward cooling. This tendency balances itself out for any latitude throughout the year, but what of the polar regions where the sun doesnt shine for over three months of the year? With more CO2, shouldnt these regions now be cooler in the winter? Yet if polar winter temperatures are observed to be generally warmer now, it could only be due to other sources of latent heat,... which of course, could not be from extra mid-latitude warming, since this would cause cooling in these areas, and they are supposedly warmer now. -
Dikran Marsupial at 20:09 PM on 11 March 2011Christy's Unconvincing Congressional Testimony
Albatross@25 Troubling indeed. The statistical error in the Douglass et al. paper is pretty fundamental, it is rather surprising that the paper made it through the peer review process. The statistical error was a bit like rolling a die 100 times and getting a mean of 3.91 with a standard error of the mean of 0.1634, and then claiming that this is statistically inconsistent with the next roll of the die that gave a two. Yes, the statistical error was that bad! -
JMurphy at 20:04 PM on 11 March 2011Interactive animation of the climate change impact on agriculture
johnd wrote : "With regards to the 30 year period you mentioned, which is generally taken to be the length of time that will represent a climate cycle rather than weather cycles. I think it is about time that this is re-evaluated as to whether it is still appropriate or not. When it was adopted about 100 years ago, the knowledge of weather and climate, both of then and past, was somewhat limited compared to today, as was the ability to measure and quantify all the relevant parameters." Ah, do we have the next tactic from the so-called skeptics ? Previously, with regard to temperature, the claim was that the satellite readings were better than those on the ground....until the satellites became inconvenient - now, satellite readings are suspect too. So, because those in denial can't rationally argue against the Weather/Climate difference, they now have to try to undermine the 30 year definition of climate. Why ? Because they need longer time-periods to try to argue their 'What if/Maybe' beliefs - time periods measured in hundreds, thousands, even millions of years if necessary. And the 30 years concept was adopted in 1935. To anyone who deals in generalities, that is indeed "about 100 years ago". -
Dikran Marsupial at 20:00 PM on 11 March 2011It's too hard
Giles@8 It may (or may not) be true that "temperature has no effect on the standard of living", but either way it misses the point that the major problem with climate change is the change. Our civilizations, and especially our agricultural practices, are optimised to the particular climate in which they have developed. Any change in our way of life and especially our agricultural practices, will involve adaption, which has a cost. Us in the first world (that are primarily responsible for the problem) can cope with this adaption without great suffering as we have the resources; the same is not the case for the third world, where they don't have the resources to adapt, and where argriculture is often quite marginal to begin with. The relationship between temperature and standard of living is a red herring. -
From Peru at 18:25 PM on 11 March 2011What would a CO2-free atmosphere look like?
What is the radiative budget, both shortwave(cooling) and longwave(warming) for clouds, measured in W/m^2 ? In particular for: -Low altitude clouds -High altitude clouds -Total cloud cover Does anyone has the data? -
Gilles at 18:23 PM on 11 March 2011It's too hard
Mucounter : if you want data, you can go to the excellent site gapminder http://www.gapminder.org/world/ now you can choose for x-axis : CO2 production per capita (log scale) and for y-axis : any wealth indicator you want (GDP, life expectancy, literacy, and so on...) unfortunately they don't have "average temperature" in their data - so I can't check the influence of average temperature on the living standard. -
Gilles at 18:16 PM on 11 March 2011It's too hard
"Gilles: According to this Wiki page almost all European countries and Hong Kong produce about 25% of the CO2 per capita as the USA. My observation is that their living standards are about the same as the USA" according to meteorological data people in Hong Kong live in a average temperature of 23 °C ( 73 °F) but in New York city, it's only 12 °C (55°F). So I conclude that temperature has also no effect on the standard of living. Please use the SAME methodology to compare the influence of FF and the influence of GW - the discussion will be more scientific. bern : "It's a bit of misdirection at work.What makes for a high standard of living is not ready access to fossil fuels. It's ready access to energy." no, it is access to cheap and convenient energy and all energies are not equivalent. Carbon is used to reduce chemically oxides, for instance, much cheaper than electricity. oil is a liquid - much more convenient for transportation. the other point of my argumentation is persistently ignored : even if you raise the EFFICIENCY of the use of FF (diminish the energy intensity), there is no way to prevent people from offsetting this efficiency by an INCREASE in the numbers of goods - for instance more EV would produce MORE CO2 than few thermal engines - and yes, there is plenty of potential demand for a western life of style - just 5 billions of people are more or less excluded from this way of life, and they will be 8 or 9 in 50 years. And there is no moral justification - or even practical possibility to let them eventually use all FF we have spared - for CO2, it won't matter WHO has produced it ! -
logicman at 17:59 PM on 11 March 2011Wrong Answers dot com
"Now that we know that the Arctic ice is recovering ..." Now that you have stopped beating your wife ... Answers.yahoo.com gives you slightly better answers about climate than you might get from consulting chicken entrails. http://answers.yahoo.com/question/index?qid=20100604092516AACQcj6Moderator Response: (DB) Fixed link -
actually thoughtful at 17:25 PM on 11 March 2011Christy's Unconvincing Congressional Testimony
This appears to be political theater. We are LONG past the time when the physical evidence doesn't carry the water for AGW. You need only look around and you see the models and climate science predictions confirmed. -
Albatross at 17:07 PM on 11 March 2011Christy's Unconvincing Congressional Testimony
Dana, You have probably seen this message Dr. Santer has posted regarding Christy's misleading testimony: "I have had a quick look at John Christy's recent Congressional testimony. Many aspects of it are deeply troubling. From my own personal perspective, one of the most troubling aspects is that Christy cites a paper by David Douglass, John Christy, Benjamin Pearson, and S. Fred Singer. The Douglass et al. paper appeared in the online edition of the International Journal of Climatology (a publication of the Royal Meteorological Society) in December 2007. Shortly after its publication, it became apparent that the authors of the Douglass et al. paper had applied a flawed statistical significance test. Application of this flawed test led them to reach incorrect scientific conclusions. Together with a number of colleagues (including Gavin), I prepared a response to the Douglass et al. paper. Our response was published by the International Journal of Climatology in October 2008. (DOI: 10.1002/joc.1756) I am also appending a "fact sheet" providing some of the scientific context for both the Douglass et al. and Santer et al. International Journal of Climatology papers.) To my knowledge, the Douglass et al. International Journal of Climatology paper has never been retracted. Nor have the authors acknowledged the existence of any statistical errors in their work. The fact that John Christy has now cited a demonstrably-flawed scientific paper in his Congressional testimony - without any mention of errors in the Douglass et al. paper - is deeply disturbing. It is my opinion - and the opinion of many of my scientific colleagues - that the Douglass et al. International Journal of Climatology paper represents an egregious misuse of statistics. It is of great concern that this statistically-flawed paper has been used (and is still being used) as crucial "evidence of absence" of human effects on climate. " [Source: here] What Dr. Santer demonstrates above is incredibly troubling with regards to Christy's actions and his testimony. -
dana1981 at 16:48 PM on 11 March 2011Christy's Unconvincing Congressional Testimony
Camburn, please try to get on topic. We're talking about Christy's testimony, and whether GHGs pose a threat to public health would also be a relevant topic. Random criticisms of the EPA are not on topic. Nobody has proposed a carbon tax in the USA. EPA regulations are not a tax. A cap and trade system is not a tax. Also, nobody accused Christy of "fiddling with the data". -
johnd at 16:31 PM on 11 March 2011Interactive animation of the climate change impact on agriculture
Camburn at 14:54 PM, most people with any understanding of the Australian climate will agree with you entirely. Whilst official records only go back to the late 1800's making it difficult to appreciate longer term variations, there has been a wealth of unofficial records and anecdotal accounts they go back to first settlement. A project has been underway for the last couple of years that is compiling all such relevant information from journals, newspapers etc that will be used to reconstruct the conditions between first settlement, and even further back, and the beginning of official records. It is called the SEARCH project and all information is being fed into the OzDocs volunteer database. Most kids did early Australian history at school and should generally be well aware of the conditions that prevailed in those early days through what was taught of the early explorers and pioneers who opened up the country. This SEARCH project will help legitimise such anecdotal evidence and has already revealed much that had previously lay hidden, only known through stories. -
Camburn at 16:28 PM on 11 March 2011Christy's Unconvincing Congressional Testimony
Albatross: I gave a link to world wide cyclones/hurricane strength, number etc. The link of extremes in the USA are all within climatic norms for our country. UAH and RSS are both well within error bars of each other. The idea that Dr. Christy is fiddling with the data is unsupported. When there was an error detected he was very open about it and corrected it. This post was about US testimony. I am trying to show why AGW is not a concern in the USA. In reality, we have not been affected for some reason.Moderator Response: [DB] In reality, people who have taken the time to read and understand the science and the primary literature in the field disagree with you most severely. -
angusmac at 16:24 PM on 11 March 2011Climate Emergency: Time to Slam on the Brakes
Albatross @67
I am not aware of any misinformation in my post. All of the data presented by me is in the public domain and is available from the links in my post. Please point out where I am "perpetuating misinformation" and I will make appropriate corrections, otherwise a retraction from you would appear to be appropriate.
-
Albatross at 16:18 PM on 11 March 2011Christy's Unconvincing Congressional Testimony
Camburn can you please specifically address Christy's testimony, and if you think what Dana (and others) have noted, then please address those specific points. Quite frankly your posts thus far have been off topic and I'm surprised that they have not been deleted. FWIW, those interested in seeing for themselves the trends in extremes are doing for the USA, go here. -
johnd at 15:55 PM on 11 March 2011Interactive animation of the climate change impact on agriculture
Tom Curtis at 14:53 PM, again go back and read the exchange between Marcus and myself. Clearly the trend maps are totally relevant for the point being made. -
dana1981 at 15:54 PM on 11 March 2011Wrong Answers dot com
By the way, I think the Yahoo Answers system is much better (though full disclosure, I'm the top answerer in the global warming section on that site). On Yahoo Answers, anyone can answer any question, but all answers are posted, whereas on Answers.com, you simply edit or replace an existing answer (if there is one). With Yahoo Answers, you get a lot of really bad answers, but you also get a lot of really good ones. With Answers.com it's really a crap shoot whether the answer provided to any given question is accurate. You only have one to choose from. The layout of Yahoo Answers is much better too. Questions are listed chronologically, so virtually every question gets multiple answers. -
Albatross at 15:54 PM on 11 March 2011Interactive animation of the climate change impact on agriculture
Camburn, In contrast to my previous statement to Tom Curtis, you (like your fellow "skeptics") do not impress. Why? Tom presents facts, links and data...you on the other hand present unsubstantiated opinions. Even though plant physiology is not my field of expertise, my latest research has required that I read quite a bit about it, and the two papers that I cited @51 were from 2010, and were based on real-world data (surface-based and satellite based). Now, if you are willing to make the effort to provide some credible peer-reviewed literature to back up your assertions we can go from there. And Marcus @56 makes some very valid points which you apparently choose to ignore. -
johnd at 15:53 PM on 11 March 2011Interactive animation of the climate change impact on agriculture
Tom Curtis at 14:59 PM, as you apparently have not been following this discussion, go back and read my post-johnd at 21:21 PM and subsequent ones. Most recently, the deliberate usage of the phrase "variable climate" by the outgoing President, and the general thrust of the new President in wanting to see more evidence is a definite shift from their earlier stated position of climate change being the greatest challenge facing farmers over the next century. Perhaps they might revert if sufficient evidence is forthcoming, but apparently what there is so far is not considered clear cut enough. My impression from listening to Jock Laurie is that they should stop and look carefully at all the evidence before rushing in and implementing any new measures as the government is want to do in various ways. It is not unknown for people or organisations to reconsider earlier positions as knowledge and events evolve. -
dana1981 at 15:48 PM on 11 March 2011Wrong Answers dot com
Chemware #1 - as rocco (#3) says, Wikipedia has a good editorial system. Answers.com does not. Anyone can go in and edit any answer in any manner they want on Answers.com, unless a Supervisor has locked the answer. It's just a bad system. rocco #3 - I don't think there's much that we can do, other than expose the flaws of the site and encourage others not to use it unless they're fixed. Several of us have appealed to the higher levels at Answers.com to no avail. It's a matter of choosing our battles, and we felt that the most effective way to respond to the misinformation at Answers.com was simply to expose it in a blog post. MattJ #4 - thanks. I had help from other Skeptical Science authors in compiling the examples of horrible Answers.com answers, although they're sadly not hard to come by. I agree, if you're going to call your site Answers.com, you'd better be able to provide accurate answers. -
The Inconvenient Skeptic at 15:42 PM on 11 March 2011What would a CO2-free atmosphere look like?
I disagree with the aspects of trying to include feebacks to determine the answer to what would the temperature be if the Earth was the same and stable EXCEPT for CO2. Same insolation, same cloud, albedo, the works. What would the greenhouse effect be in that situation? A net energy transfer to the atmosphere is one method that could be used. If one analyzes total energy transfers to the atmosphere by the different components the following table is arrived at: Latent Heat: 80 W/m2 LW Absorption: 23 W/m2 Convection: 17 W/m2 If I use Gavin's paper and the CO2 contribution of 20% to the LW absorption which contributes to 19% of the total energy transfer to the atmosphere from the surface, then CO2 contributes 1.3C of the total GHE. Total energy transfer causes the total GHE. Trying to assume that only the energy transferred by LW absorption causes the GHE is a poor simplification. One could also consider the SW absorption to the total, but much of that takes place in the ozone layer which is independent of the troposphere. So I leave that out of this comment, but I have more here. -
Albatross at 15:27 PM on 11 March 2011Interactive animation of the climate change impact on agriculture
Tom @62, You continue to impress :) The maps that johnd showed are really quite meaningless for the point he is trying to make, although his point is not that clear either. -
MattJ at 15:26 PM on 11 March 2011Wrong Answers dot com
I noticed before on other topics, now poor the quality control is on Answers. com. But I never noticed that it was THAT bad! But I am glad that dana1981 has put so much effort into exposing them for their incompetence and really, dishonesty. For yes, claiming that the way to handle 'controversial' topics by giving equal time to "multiple viewpoints and opinions" really is dishonest. Especially for a site whose very name makes the presumptuous claim to have "The answer". -
rocco at 15:18 PM on 11 March 2011Wrong Answers dot com
Chemware: The main difference is that Wikipedia actually has at least some level of editorial control, which is something that most "citizen scientists" avoid like plague. dana1981: The obvious question: what do? The problems you describe are symptomatic for the entire "debate". We can't possibly be there every time somebody propagates misinformation. -
calyptorhynchus at 15:16 PM on 11 March 2011Wrong Answers dot com
Answers.com is just not a very good site and never has been. Don't bother to try to reform it, just put about the information that it should be avoided. -
Camburn at 15:12 PM on 11 March 2011Christy's Unconvincing Congressional Testimony
It would seem that North America is exempt from weather extremes caused by AGW: http://www.climatewatch.noaa.gov/2010/articles/forensic-meteorology-solves-the-mystery-of-record-snows/1 http://c3headlines.typepad.com/.a/6a010536b58035970c0147e2e84bbd970b-pi Note, the above link is from NOAA And of course, we have the tropical storms. http://www.coaps.fsu.edu/~maue/tropical/ It would seem that the testimony given by the AGW proponent is slightly scewed. -
Chemware at 15:05 PM on 11 March 2011Wrong Answers dot com
Curiously, Wikipedia does not suffer from the same problems to anywhere near the same extent. Perhaps the private sector has a vested interest ? -
Tom Curtis at 14:59 PM on 11 March 2011Interactive animation of the climate change impact on agriculture
Climate change threat must be tackled ‘head on’ 5 February 2007 “THE threat of global climate change is potentially the biggest issue Australian agriculture has ever faced with reports of increasing seasonal variability and more extreme weather events,” National Farmers’ Federation (NFF) President David Crombie declared today in the wake of the Intergovernmental Panel on Climate Change (IPCC) Report, released over the weekend. “The Australian farming sector is utterly dependent on weather conditions and any prolonged change in climatic patterns has the potential to plunge farmers, and the majority of Australia, into the realm of the unknown. Rather than throw our hands up in despair, the NFF is advocating direct and deliberate national engagement on the issue to dispel the myths, measure the realities and identify solutions. “What is already apparent is the need to better position agriculture to manage resources in the context of a changing climate. On this, we cannot, and must not, wait. A vastly increased research effort is needed – sooner, rather than later – to enable all primary industries to plan, adapt and respond to greenhouse and climate change challenges… those of today and those predicted.
From the National Farmer's Federations -
Camburn at 14:54 PM on 11 March 2011Interactive animation of the climate change impact on agriculture
johnd: Go back further in time for your continent. The climate extremes are extreme, and ever changing. North America also has extremes in paloe climate. A little longer timescale than Australia tho it seems. -
Tom Curtis at 14:53 PM on 11 March 2011Interactive animation of the climate change impact on agriculture
johnd @ 58, I cannot help but notice that half the difference in trends between those two maps is just a consequence of the different time periods. If the trend over 80 years is -10.00 per decade, and over 40 years it is -20.00 per decade, then the starting rainfalls are effectively identical, and the greatest similarity is between 1930 and 1970, rather than between either and 2010. Looking at the time series shows that the 1970's was an extrordinarilly wet decade, and that the period since the 1970s is unusual compared to that before the 1970s. Of course, that hides large regional differences. Comparing trends originating with the 1950s and 1910s shows a much smaller difference than does your choice of comparators, with a large portion of the difference arising solely from the longer period since 1910. Your claim that current conditions are more like those of our grand parents than those of our parents appears to be on very shaky ground.


-
Camburn at 14:51 PM on 11 March 2011Interactive animation of the climate change impact on agriculture
Marcus: I will continue to cling to that meme. Also, as far as acclimateing to higher co2, ahhhh.......forget it. ( -snip- )Moderator Response: [DB] Please refrain from being insulting to others if you want your comments to not be deleted. Posting on this site is a privilege, not a right. -
johnd at 14:21 PM on 11 March 2011Interactive animation of the climate change impact on agriculture
Marcus at 13:54 PM, these rainfall trend maps illustrate how conditions, for the present generation of farmers, in this example rainfall, are closer to that experienced by their grandparents, and quite different to that experienced by their parents. As for the present day policy of the NFF, please provide some evidence.

-
Marcus at 14:05 PM on 11 March 2011Interactive animation of the climate change impact on agriculture
"I will stand with real world research from fields showing that additional co2 results in higher bio mass and crop yields." ....and which field trials are you referring to? All the FACE trials I've read about suggest that the benefits of extra CO2 have been massively overstated, & usually come at significant cost (as I've highlighted above)-& are ultimately short lived anyway. Still, you go on clinging to that meme if it makes you feel better. -
Tom Curtis at 14:03 PM on 11 March 2011What would a CO2-free atmosphere look like?
From Peru @19, clouds form when water vapour condense from the atmosphere as the surrounding gas cools. With a drier atmosphere, you will also get a greater change in temperature with altitude, and hence a greater relative rate of condensation. So there is at least one solid reason to think cloud cover will not just track water vapour levels unambiguously. -
Marcus at 14:02 PM on 11 March 2011Interactive animation of the climate change impact on agriculture
What you keep forgetting Camburn, is several key things: (1) warmer weather increases the rate of senescence (aging) in plants, meaning that seed ripening tends to occur *before* they have a chance to reach maximum size. (2) most plants tend to be biased towards increasing vegetative biomass over seed biomass. (3) plants exposed to higher CO2, prior to acclimation, require much more nitrogen as they need to produce more of the enzymes needed to utilize the extra CO2 in their bio-synthetic pathways. (4) these plants also require greater energy to build & maintain the enzymes necessary to utilize the extra CO2. (5) over time, these plants become acclimatized, & actually switch off the production of the extra enzyme, meaning biomass increases from extra CO2 usually only last about 2-3 years at most-shorter if the plants lack access to sufficient quantities of nitrogen, water & trace elements-the *real* rate-limiting factors in determining long-term plant growth. (6) several plant types (rice in particular) actually reduce their take up of certain trace elements (such as Zinc) when exposed to above normal levels of CO2. -
Marcus at 13:54 PM on 11 March 2011Interactive animation of the climate change impact on agriculture
"It is interesting that some of those present day farmers whose family holdings extends beyond two generations, are finding that some of the conditions they have experienced were similar instead to what confronted their grandparents." You want to back that up with some *evidence* John? Man, your ability to keep repeating the same falsehoods as though they're indisputable facts is getting somewhat tiresome. Your claims of some magic 30-year cycle is simply not backed up by the wealth of scientific data, nor is your claim that the NFF genuinely reflects the opinions of ordinary farmers backed up by the evidence I've seen & heard with my own senses. So unless you want to start backing up your claims with something approaching *real* evidence, then I simply don't see any point in arguing the case with you. According to PIRSA, btw, the science behind AGW is supported by both the SA Farmers Federation & the National Farmers Federation-so seems like your earlier claim isn't backed by the facts either. -
Tom Curtis at 13:54 PM on 11 March 2011Christy's Unconvincing Congressional Testimony
Rovinpiper @18 & 19, I tend to agree with your political analysis, but disagree with your suggestion on tactics. Expert witnesses called in support of action on climate change should not step outside of their expertise while giving testimony. It is not their role to do so, and it is unethical for them to do so. Further, it would be tactically disadvantageous because when they make mistakes (as they inevitably will speaking outside of their area of expertise), the mistakes will be seized upon and trumpeted through out the blog-0-sphere as a means of discrediting their expertise even in those areas where they are in fact expert. Rather, the tactic that should be adopted is some actual skill in questioning by the Democrats and rational Republicans on the committee. If Christy makes comments about economics, he should be pointedly asked what his claim to expertise in economics is. Given his publication record, his expertise on climate science should be actively challenged by trolling through the example after example of egregious error. I'm sure suitable comments on using the wrong sign for how many years was it? could be judiciously used to make him look a buffoon. The deniers have been playing hard ball on this issue for years, and more rational politicians have been soft on the issue for fear of losing votes. Its about time they toughened up and started pointing out that the emperor of the deniers has no clothes. -
Camburn at 13:53 PM on 11 March 2011Interactive animation of the climate change impact on agriculture
Albatross: I would caution you to use a grain of salt on relying on articles by Dr. Reich. I will stand with real world research from fields showing that additional co2 results in higher bio mass and crop yields. Also, Dr. Reich is wrong on higher co2 effects on corn. The root structure of co2 enhanced corn in unbelievable compared to normal levels of co2. I can only suggest that if you are going to comment on articles such as this that you do a lot more reading and stay abreast of the current research being done. The resutls that you are alluding to are not the results of real world experiments. -
Chris Colose at 13:41 PM on 11 March 2011What would a CO2-free atmosphere look like?
Peru, Keep in mind that clouds make up an extremely small amount of water in the actual atmosphere. From Trenberth and Smith (2005), there's generally about 250 times more water vapor (in mass per unit area) than liquid or ice in the air. I don't know how realistic the cloud feedbacks are in the Lacis paper (that would be a good question to ask the people in the study), but there's a lot of wiggle room to change the water vapor without changing clouds much. It's not the total water in the atmosphere that matters, but how you reach saturation, and lowering the temperature makes condensation easier. As for the albedo effect, the reason clouds are such a problem in the modern atmosphere is because they have two big terms (a longwave and a shortwave term) and constraining climate sensitivity amounts to figuring out the the very small difference between the two competing effects. In the snowball case though, the albedo effect of clouds isn't very important over bright surfaces, so they have an unambiguous warming effect on the snowball climate (as noted in Pierrehumbert 2002, as well as the coming review article). So your argument wouldn't really hold in this case. -
Rovinpiper at 13:29 PM on 11 March 2011Christy's Unconvincing Congressional Testimony
Notice also that other scientists were unwilling to go outside of their expertise but Christy didn't mind jumping right into economics. Trying to take the high road and stay within your expertise will win you no points in this sort of exercise. -
Rovinpiper at 13:28 PM on 11 March 2011Christy's Unconvincing Congressional Testimony
This was a win for the Republicans. All they need to show is controversy about the science and negative economic consequences of regulation. No one challenged Christy on his statements about day vs. night-time temperatures. No one pushed him to explain changes in outgoing and downward IR or stratospheric cooling. No one contested statements by Republican representatives or the skeptics about the negative impacts of regulation. They presented predictions of negative impacts from an increase in the price of energy. This is introductory level economics. People need to be reminded that economics is a model. We all now that model predictions should be validated against empirical data. We have some data now because of carbon emissions controls in the European Union and in part of the Northeast United States of America in the Regional Greenhouse Gas Initiative. These programs have not made those states into third world areas as Rep. Griffith assumes GHG regulation would do to the United States. -
Phila at 13:12 PM on 11 March 2011Examining Hansen's prediction about the West Side Highway
As a PS, Tom Curtis @54 has done a much better job than I of clarifying the difference between legitimate scrutiny and ideologically motivated ankle-biting. -
From Peru at 13:09 PM on 11 March 2011What would a CO2-free atmosphere look like?
In the Lacis et al (2010) paper "Atmospheric CO2: Principal Control Knob Governing Earth’s Temperature" it is shown (figure 1 in this post) that cloud cover remains roughly the same while the Earth cools (it even grows a bit at first before stabilizing at a constant value). How could this be possible, while the water vapor content of the atmosphere drops by 90%? Since clouds are formed by condensed water vapor, should not cloud cover decrease proportionally to the moisture decrease in the air, because there is less water vapor to make clouds? This is a very important point, because if the cloud cover drops while the sea ice cover grow, it is not clear if the total albedo of the planet would grow (due to more ice) or drop (due to less clouds). A cloud-induced drop in albedo would be a negative feedback that may prevent the Earth into entering a snowball state, if it is strong enough to compensate the loss of the greenhouse effect. -
Phila at 13:03 PM on 11 March 2011Examining Hansen's prediction about the West Side Highway
HR: There is nothing I can do if you feel the climate science establishment shouldn't be held to scutiny. This is yet another strawman. I didn't say or imply this, and I don't believe it. Frankly, I don't think you're helping your credibility with this comment. Two other points come to mind. First, AGW has been under incredible scrutiny, as you know perfectly well. I've been following this issue pretty carefully since 1990 or so, so I know that there are few major claims from the consensus side that haven't been challenged, questioned, parsed, anatomized, checked and rechecked repeatedly. That process continues today -- despite efforts to defund or slander the relevant agencies -- and I'm pretty confident that when important adjustments are made to AGW, or its predicted outcomes, they'll come from competent scientists, rather than a flock of willfully ignorant ideologues. Second, "scrutiny" of a scientific theory is valuable laregly to the extent that it comes from informed, intelligent, honest people who are not simply parroting frivolous criticisms they heard on a site like WUWT. We probably don't agree on much, but I hope we can agree on that. -
Tom Curtis at 12:44 PM on 11 March 2011Christy's Unconvincing Congressional Testimony
johnd @16, I find the suggestion that piers would dam the river more than mangroves (the natural river bank vegetation in Brisbane) interesting, but hardly credible. However, the suggestion that changes in geography between 1893 and 2011 rather than, say the 300 mm's (370 at Savages Crossing) rain in three hours dumped onto an already flooded river system are the major oontributor to Brisbane's flood is simply laughable. Below are the rainfall intensity graphs for Helidon (in the Lockyer Valley) and Lowood (just below the Wivenhoe dam wall) to give you some idea of the intensity of the rain involved. The primary flooding in Helidon is associated with the flash flooding in the Lockyer Valley on Monday 10th (google Grantham if you are unfamiliar with it); the peak at Lowood is associated with the second peak that fell mostly on the dam and surrounds. At the same time, Savage's Crossing (just east) received 370 mm in three hours. Note that the white dashed line on the graphs represents the expected intensity of a 1 in 2000 year event.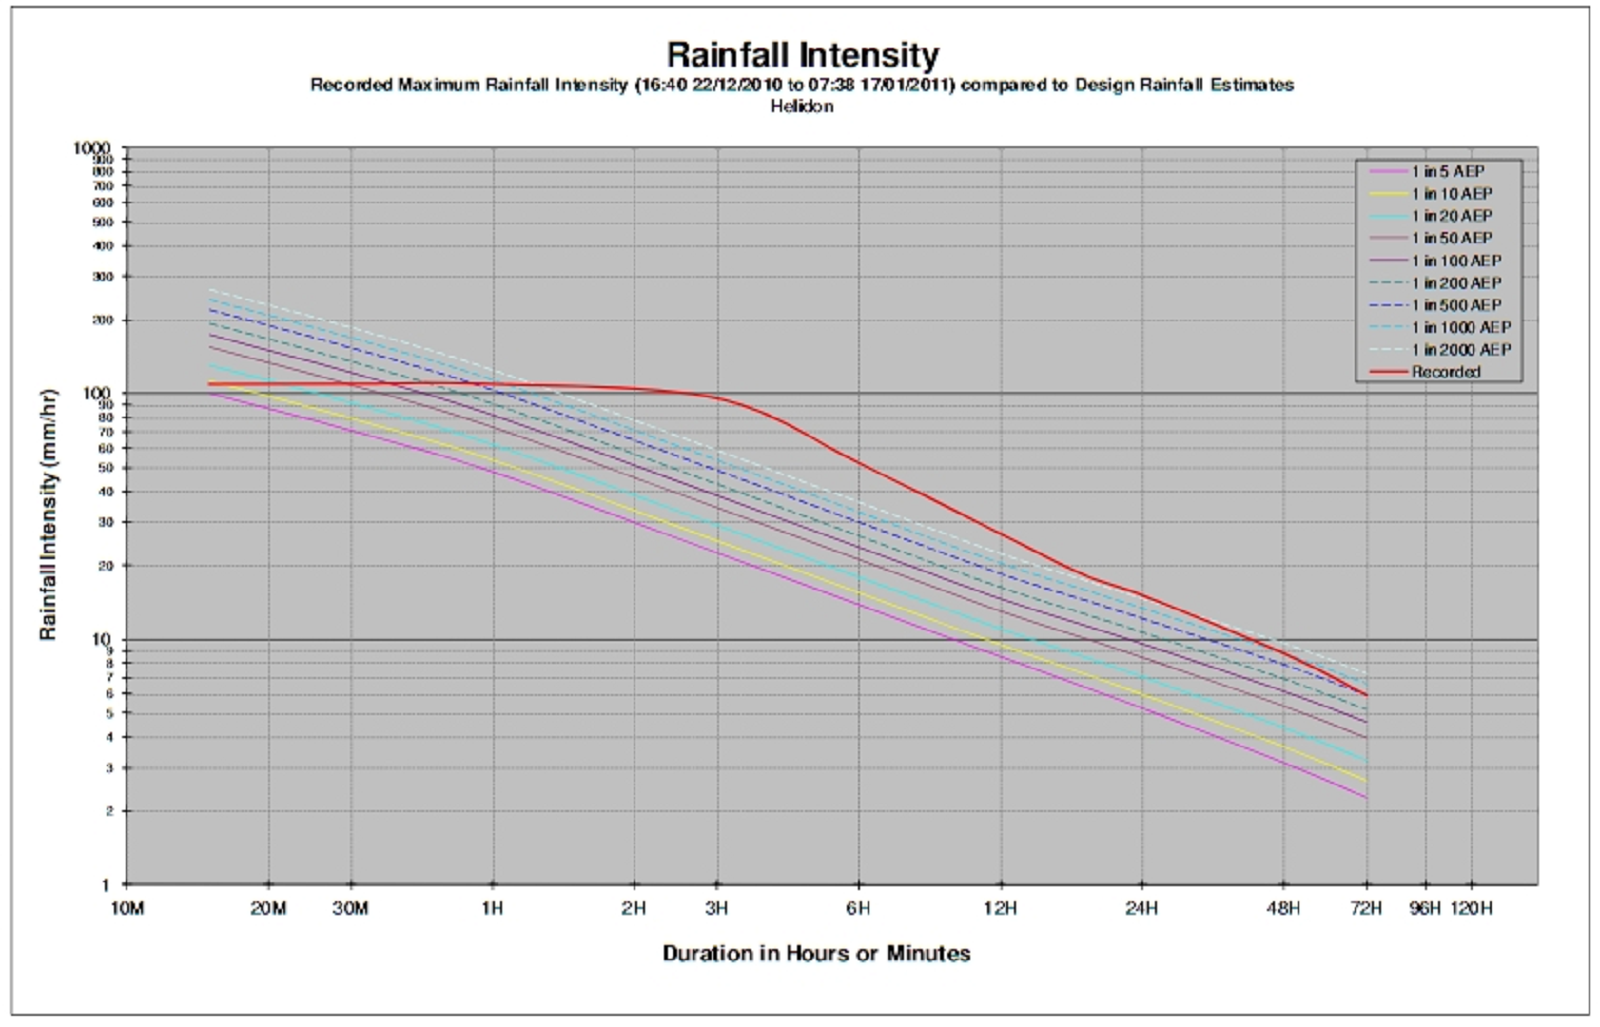

 The Helidon peak is associated with the first peak of inflows into Wivenhoe dam (dark blue line), the one at Lowood with the second peak. The dark red line indicates the peak flow at that location in 1974.
Note, some areas of the catchment did not experience so intense rainfall, so that overall the intensity of the event over the period is about 1 in 200, but it is the peak falls over the Lockyer on the 10th that destroyed the Lockyer valley, and caused most of the flooding; and directly onto the dam and surrounds on the 11th, that necessitated the massive releases from the dam. And those events had probabilities of significantly less than 1 in 2000 per annum.
The Helidon peak is associated with the first peak of inflows into Wivenhoe dam (dark blue line), the one at Lowood with the second peak. The dark red line indicates the peak flow at that location in 1974.
Note, some areas of the catchment did not experience so intense rainfall, so that overall the intensity of the event over the period is about 1 in 200, but it is the peak falls over the Lockyer on the 10th that destroyed the Lockyer valley, and caused most of the flooding; and directly onto the dam and surrounds on the 11th, that necessitated the massive releases from the dam. And those events had probabilities of significantly less than 1 in 2000 per annum.
-
Chris Colose at 12:43 PM on 11 March 2011What would a CO2-free atmosphere look like?
HumanityRules, I largely agree with you, but non-linearity in sensitivity is rather small over the ranges of climate of interest to us right now (e.g. http://www.nonlin-processes-geophys.net/18/125/2011/npg-18-125-2011.pdf ). Certainly you don't want to compare snowball Earths to say, the PETM directly, but I haven't seen anything suggesting it's a big deal for evaluating modern global warming. The effect isn't absolutely zero. Colman and McAvaney (2009) did this type of experiment from 1/16th to 32x modern CO2 and found a weaker sensitivity in the warm climate than in the cold cases, but it's not a large effect over a few degrees about the modern climate, so you don't really lose much by using the past as a guide to the future. The albedo feedback does get weaker in the warm simulations, but the water vapor grows in strength in warmer climates as well. The Colman and McAvaney paper have the lapse rate feedback increasing in strength too, essentially offsetting the water vapor feedback over most of the range (So the WV+LR feedback is positive the whole time, but not acceleratingly so), but I'm pretty skeptical of that. Eventually the water vapor feedback makes the sensitivity much higher, eventually getting you to a point where a runaway greenhouse is possible if your solar insolation is high enough. There's some other papers on this (e.g., Crucifix 2006, looking at the LGM vs. present) but the non-linearity is pretty small. -
michael sweet at 12:17 PM on 11 March 2011Examining Hansen's prediction about the West Side Highway
Tomurray: Do you hold Lindzen and Spencer to the same standard you hold Hansen? Remember that in 1988 Lindzen was predicting it would get colder in the next decade. Why are you still listening to him? -
Albatross at 12:12 PM on 11 March 2011What would a CO2-free atmosphere look like?
Well done Chris, you have got Lindzen there. That is just one of several misleading and/or false statements he made that day. -
bibasir at 12:03 PM on 11 March 2011What would a CO2-free atmosphere look like?
Really good article and discussion. It is a shame that someone did not answer Lindzens "guess" with some facts. Now the republicans and deniers go away thinking that CO2 is no big deal up or down.
Prev 1850 1851 1852 1853 1854 1855 1856 1857 1858 1859 1860 1861 1862 1863 1864 1865 Next


