


 Arguments


Recent Comments
Prev 1890 1891 1892 1893 1894 1895 1896 1897 1898 1899 1900 1901 1902 1903 1904 1905 Next
Comments 94851 to 94900:
-
Camburn at 14:05 PM on 8 March 2011Interactive animation of the climate change impact on agriculture
Ok....I was too low. This from an article in a farm magazine. I will have to dig to find the experiments done. "•Cereal grains including rice, wheat, barley, oats and rye average between 25 and 64 percent higher yields under elevated CO2 levels." -
HumanityRules at 14:02 PM on 8 March 2011Blaming the Pacific Decadal Oscillation
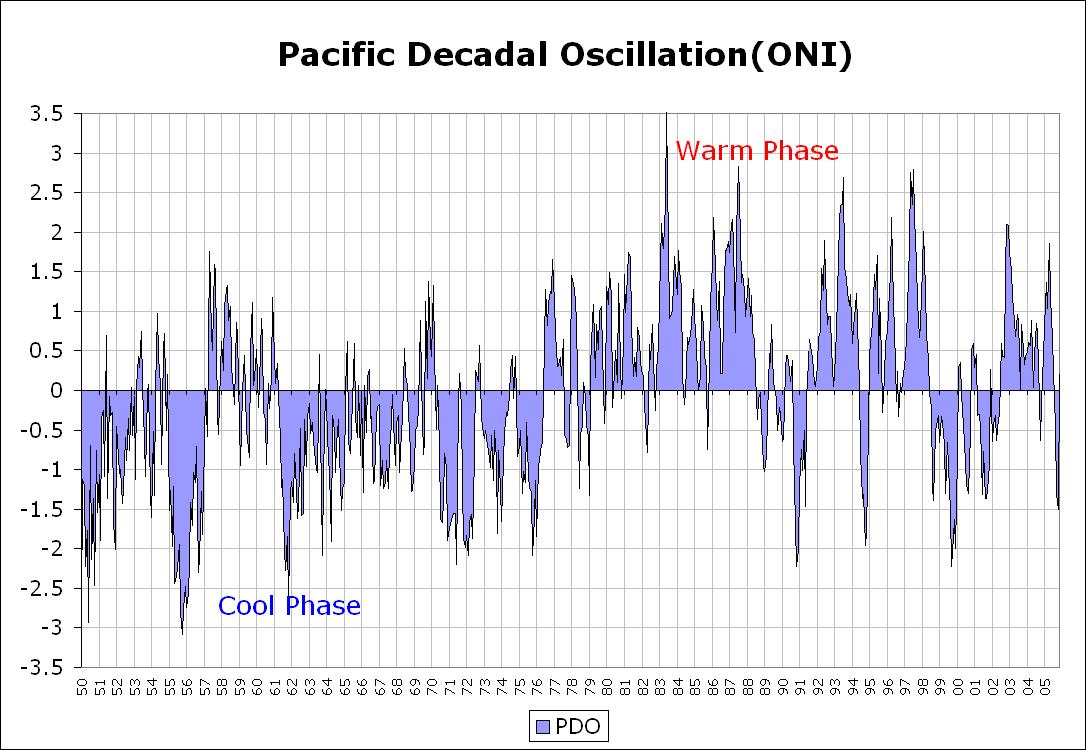
 I wonder if you could go into the relationship between PDO and ENSO a little more?
It appears that to a large extent PDO may just be a measurement of one of the impacts of ENSO in an appear outside of the 'tradional' ENSO region. Is this what you mean?
I wonder if you could go into the relationship between PDO and ENSO a little more?
It appears that to a large extent PDO may just be a measurement of one of the impacts of ENSO in an appear outside of the 'tradional' ENSO region. Is this what you mean?
-
michael sweet at 13:56 PM on 8 March 2011Interactive animation of the climate change impact on agriculture
Camburn: "If memory serves me" is not a reference. Please give a link that supports your unusual claim. Peer reviewed papers are convincing. "memory" is not. -
HumanityRules at 13:56 PM on 8 March 2011Blaming the Pacific Decadal Oscillation
Riccardo, "Thus, the PDO is a response to something else; treating it as a forcing must be taken with caution." I'm not sure the point you're trying to make with this? You think that because PDO maybe a feature or related to ENSO that this undermines it's possible role in forcing climate? I can see if we knew the whole truth about PDO that would help in understanding it's role but I don't get why we should specifically treat it with caution because it is related to ENSO? -
HumanityRules at 13:43 PM on 8 March 2011Blaming the Pacific Decadal Oscillation
"The question is, then, how to reproduce Spencer's result." Did you consider e-mailling him and asking him what he did? -
Camburn at 13:31 PM on 8 March 2011A Real-World Example of Carbon Pricing Benefits Outweighing Costs
There is an answer to building a mostly non carbon energy system. It is available, and has been tested. It is called nuclear. -
Camburn at 13:23 PM on 8 March 2011Interactive animation of the climate change impact on agriculture
muoncounter: I agree, water vapor is by far the most powerful greenhouse gas. Everything else pales against it. What research has shown is that the plants require substantially less moisture with higher co2 levels to produce the same yield. The hope is that if moisture stays somewhat constant that yields will increase by 18-22% if memory serves me.Moderator Response: [DB] Actually, CO2 is the Star Actor (the principal control knob) on the planetary thermostat stage; water vapor plays a supporting role in warming the atmosphere. If one removes the CO2 from the atmosphere, global temperatures plunge by more than 30°C in the first 10 years alone (and the resulting increase in global ice turns the planetary albedo a whiter shade of pale):
Lacis et al 2010 -
Camburn at 13:20 PM on 8 March 2011Interactive animation of the climate change impact on agriculture
But now we have drifted into agonomy rather than this application. -
muoncounter at 13:20 PM on 8 March 2011Interactive animation of the climate change impact on agriculture
adrian s, "My understanding about rising c02 levels and precipitation ... the two will largely mitigate each other" Your understanding appears to be incomplete. See the thread Water vapor is the most powerful greenhouse gas, where you will find that water vapor amplifies CO2-driven warming in a process known as 'feedback.' This is the water vapor that is the precursor to what you hope for in terms of relief from rainfall. -
Camburn at 13:19 PM on 8 March 2011Interactive animation of the climate change impact on agriculture
adrian: That is what current research shows. The higher levels of co2 result in fewer stoma which results in less transpiration. There are wild wheat grasses that have this gene that show this effect presently. Wheat and corn breeders have been trying to incorporate this gene for some years now into new hybrids. The thinking is that there should be an impressive yield response to this. -
Mike1637 at 13:17 PM on 8 March 2011The Climate Show Episode 8: Kevin Trenberth
@14. What's your point stevee? I don't think it ultimately matters if they were hacked or leaked, though hacking seems far more probable as it is known that they were downloaded from a backup server - hardly the way your average "leaker" would obtain them. In any case, none of it changes the fact that the explanation for the "hide the decline" email has not even a whiff of conspiracy about it (other than to the woefully misinformed). Nor that the "decline" is not, and never has been, a scientific secret to anyone. -
muoncounter at 13:06 PM on 8 March 2011A Real-World Example of Carbon Pricing Benefits Outweighing Costs
daisysm, "perhaps you are missing the point." That is one way to look at it. Perhaps the points made here differ in substance from the ones you are trying to make. You might consider doing some reading on warming issues. Start with the Newcomers guide then move on to Most used skeptic arguments. "what’s the thrust of the Federal response to this dire situation? …To make electricity only when the wind blows and the sun shines" Are there no renewable electric projects funded by corporate interests? Ever hear of T. Boone Pickens? "Let’s not forget that Californians are not paying the full cost for renewable energy, thanks to massive Federal subsidies." Hardly anyone in the US pays the full cost of energy. Know about massive Federal subsidies (aka tax breaks) to the oil industry? "I wondered if the threat to humanity posed by reliance on carbon fuels was real, since Government wasn’t looking for a new, full time, 24/7 energy source" I have to admit, that's a unique point of view. Because govt isn't doing something (in your view), it isn't a real problem? How about this for a reason that govt's search for replacement fuel is so slow: There is a massively funded industry lobby against that initiative! "I still insist that the “threat to humanity” is an overblown alarmist cry." Mere insistence on something doesn't qualify as evidence, scientific or otherwise. See the threads Its not bad for some examples of what 'alarmism' is trying to say. -
adrian smits at 12:30 PM on 8 March 2011Interactive animation of the climate change impact on agriculture
My understanding about rising c02 levels and precipitation is that the two will largely mitigate each other.If there is a reduction in rainfall that should be compensated for somewhat by crops that are more drought resistant because of higher c02 levels. -
RW1 at 12:20 PM on 8 March 2011Blaming the Pacific Decadal Oscillation
scaddenp (RE: 73), "Perhaps we should takes this "CO2 lags temperature" if wish to continue to argue that GHGs are unimportant for glacial/interglacial cycle." Yes, I'm arguing the evidence doesn't support that GHGs (i.e. CO2 levels) are a significant factor in the glacial/interglacial cycle. Do you wish to discuss this further over there?Moderator Response: Definitely not here. -
adrian smits at 12:13 PM on 8 March 2011Interactive animation of the climate change impact on agriculture
The problem with this graph is that it models local temperatures.However the models indicate almost no warming at lower latitudes with increased warming at higher latitudes where millions of acres of land will suddenly become arable because of increases in temperature.A careful study of the graph would seem to indicate a huge net gain in food production for the planet in a warming world.As a farmer I know that you need heat units to grow crops and the corn belt in north America has been moving north for years.We consider this a blessing that allows us to grow crops with higher yield and it gives us a greater choice as to what we can grow. -
Alexandre at 11:27 AM on 8 March 2011The Climate Show Episode 8: Kevin Trenberth
ClimateWatcher #15 said How about asking him about certainty of AGW when the measurements of solar, albedo, and output LW are all greater than CO2 forcing? Excuse me?
-
Tom Dayton at 11:04 AM on 8 March 2011Renewables can't provide baseload power
One place where baseload power can be provided by wind, is a chain of wind turbines running along the Atlantic coast of the northern U.S. The Atlantic Wind Connection project will take advantage of wind patterns that blow sufficiently at least somewhere along that chain at all times. -
Rob Honeycutt at 11:00 AM on 8 March 2011The Climate Show Episode 8: Kevin Trenberth
stevee @ 11... Do you understand how small the CRU is? -
Rob Honeycutt at 10:57 AM on 8 March 2011The Climate Show Episode 8: Kevin Trenberth
ClimateWatcher... Trenberth meant that it's a travesty that we can't adequately track the heat energy in the climate system. We need better systems for understanding and tracking where the heat energy moves around the planet. That's very clear if you actually read his emails and his research. The "travesty" is clearly spelled out in his papers. Difference between 1997 and 2009? How about 12 additional years of intensive research. Science advances to create better understanding. In this interview he clearly says the IPCC states that the anthropogenic nature of warming is "unequivocal." He is obviously in agreement with this statement. Do you understand what he's saying about "turning around the null hypothesis?" He means it is clearly shown by the research that we are warming the planet. The evidence is overwhelming. It is up to the skeptics now to prove otherwise. -
daisym at 10:34 AM on 8 March 2011A Real-World Example of Carbon Pricing Benefits Outweighing Costs
#69 dana1981: Thanks for the response to my comments @ #68. My position needs some clarification: I prefaced my comments by saying, “I think everyone is missing the point.” Your response shows me that perhaps you are missing the point. 1. I commented that we must find a NEW, full time, 24/7 energy source that could replace carbon fuels. You disagreed, saying that wind and solar (and a few other, lesser technologies) fit the bill. This isn’t factual. These are neither new, nor scalable, nor reliable sources of full time, 24/7 energy. The USA isn’t looking for such an energy source. I reiterate: Why aren’t we looking? The Federal government spent $100 billion for scientific research that blames carbon fuels as a threat to humanity. So what’s the thrust of the Federal response to this dire situation? …To make electricity only when the wind blows and the sun shines, and keep on burning carbon fuels! How will this end the threat to humanity? Why aren’t we spending another $100 billion on R&D to find a full time, 24/7 replacement for carbon energy? Wind, solar, etc. won’t do the job. You missed the point! 2. I commented that investments in energy-saving things had little economic benefit, except for the early investors. Reduced purchases of postage stamps forced the Postal Service to raise the price of stamps. Water consumption in Colorado has gone down, while consumer bills have gone up (not down). These are dynamics of the market system. If as you say, California rates have increased as per capita consumption has decreased, you and I implicitly agree on these very dynamics. Let’s not forget that Californians are not paying the full cost for renewable energy, thanks to massive Federal subsidies. Without subsidies to reduce the cost of manufacture, these rates would be much higher! 3. You also had problems with my closing comment, where I wondered if the threat to humanity posed by reliance on carbon fuels was real, since Government wasn’t looking for a new, full time, 24/7 energy source to replace carbon fuels. You claimed that the RGGI States spent 11% of their carbon funds on renewable energy. But was this for R&D to find the “holy grail” of energy sources (to replace carbon fuels)? Of course not. Not mentioned was that these same States spent 17.4% of their carbon funds to prop up their operating budgets. Given no interest at the Federal or State level to find such a replacement for carbon fuels, given interest only in reducing (not eliminating) use of carbon fuels with part time wind and solar energy, and given the proclivity to use energy revenues for non-energy purposes, I still insist that the “threat to humanity” is an overblown alarmist cry.Moderator Response: It is not necessary to have a single technology provide 24/7 energy. See "Renewables can’t provide baseload power." -
Glenn Tamblyn at 10:29 AM on 8 March 2011Interactive animation of the climate change impact on agriculture
Sphaerica's comment about precipitation is critical, and it is unclear wheter this model includes that. It is relevent that the crop that does best at high temps is rice, which is the highest water user. -
Marcus at 09:52 AM on 8 March 2011A Real-World Example of Carbon Pricing Benefits Outweighing Costs
...oh, & actually thoughtful is dead right. Seems you-like most denialists-want to have your cake & eat it too. You're usually first in line to tell us that global warming isn't real-or isn't the result of burning fossil fuels (oh no, its all the fault of that relatively tiny waste heat effect). Yet here you're claiming the opposite. So which is it? -
ClimateWatcher at 09:30 AM on 8 March 2011The Climate Show Episode 8: Kevin Trenberth
This is polemic not science. How about actually asking Trenberth what he meant by the 'Travesty'? How about asking him why there is so much difference from Trenberth 97 to Trenberth 2009 energy budget? How about asking him about certainty of AGW when the measurements of solar, albedo, and output LW are all greater than CO2 forcing? These are science questions but not asked here. And "Turn around the null hypothesis?" Great advancement for science. -
Paul D at 09:27 AM on 8 March 2011Interactive animation of the climate change impact on agriculture
Generally, agriculture is an 'artificial' system that can be manipulated to a certain extent by humanity to mitigate climate change, largely by planting different crops as climate changes, or 'engineering' new varieties. A bigger problem is crop migration to the point where some areas may not be suitable any more for any agriculture. SO it isn't a case of less productivity from a crop, but elimination of some land from the agriculture 'bank'. This has nothing to do with traditional agriculture cycles and seasons, posed by Camburn. It is more to do with a complete break down of such cycles in certain areas of the world. Another big problem is the capacity of wild/natural species to adapt. People do not depend solely on agriculture, we are dependent on a wide bio-diverse environment. As that bio-diversity reduces, as one species is lost, it knocks out a whole chain of other species. Alternatively, you can get a massive destructive increase in a species if it's 'predator' is eliminated. Effectively warming is one massive hard to predict experiment, with many risks. -
actually thoughtful at 09:00 AM on 8 March 2011A Real-World Example of Carbon Pricing Benefits Outweighing Costs
Gilles, I have seen you make the same point on a few blogs - that our actions to reduce fuel use will only hasten the 3rd worlds use of fuel (by lowering the price, and making it affordable). And you analysis is OK, as far as it goes. Which is not far enough. Your analysis misses the key point - that fossil fuels are NOT the only way to improve your lot in life. For example, my customers lower their bills and their carbon footprint by investing in renewable energy. Now will their unused fuel be used by citizens of 3rd world countries? I suggest you look at telephones. It used to be, in Guatemala, that each town would have one phone and people would line up to use it. In more remote sections, the people would walk over to the next town. The problem was the fixed cost of running telephone lines. Now these communities are served by multiple cell phones. It turns out it is cheaper to throw up cell towers than it is to run thousands of miles of copper wire. That is a better analogy, and what the right wing in the US doesn't understand. We can create solutions that are BETTER than fossil fuel. We can lead the world and make serious money, or we can sit on our hands and say "well if we don't use it someone else will." It is a logical fallacy, pure and simple. -
actually thoughtful at 08:53 AM on 8 March 2011A Real-World Example of Carbon Pricing Benefits Outweighing Costs
RSVP - you seem to be a good candidate for solar space heating. That would minimize your costs & minimize your CO2 footprint. Don't you sometimes argue that winters are getting worse? But here you say you are paying more for less fuel, meaning that winters are less severe? (Or did you invest heavily in conservation?) -
actually thoughtful at 08:50 AM on 8 March 2011A Real-World Example of Carbon Pricing Benefits Outweighing Costs
Dana - I said "over 60%" You said "90%" both are correct. My point stands, that the majority of us could, in fact, power our transportation needs with a Nissan Leaf (or equivalent) and 8 solar PV panels. -
RSVP at 07:27 AM on 8 March 2011A Real-World Example of Carbon Pricing Benefits Outweighing Costs
Marcus #79 "Also, try living here in Australia where every Summer we're getting increasing number of nights that are *above* 20 degrees C-thus forcing us to consume more electricity to keep our homes cool at night." The more people use air conditioners, the warmer it gets. You are in fact saying that more and more energy is going into "cooling", when in reality it is going into heating the ambient temperature (i.e., urban heat island, waste heat problem, etc.)Moderator Response: [muoncounter] As you will no doubt recall, we have a waste heat thread and UHI threads here and here. -
Timothy Chase at 07:05 AM on 8 March 2011Blaming the Pacific Decadal Oscillation
When quoting (82) from the webpage that nofreewind (76) had referred us to:However, the Hadley Centre's real-world plot of radiosonde temperature observations shown below does not show the projected CO2 induced global warming hot-spot at all. The predicted hot-spot is entirely absent from the observational record. http://www.friendsofscience.org/assets/documents/The_Saturated_Greenhouse_Effect.htm
... I pointed out that the Friends of Science claim that "the predicted hot-spot is entirely absent from the observational record" is at best cherry-picking the studies, and gave two examples of studies that claim to have found the "hot-spot" where the warming trend is higher in the mid-troposphere than on the ground. However, I appear to have missed the bit where they referred to the hot-spot as being the "projected CO2 induced" global warming hot-spot. Such words are strongly suggestive of the often-repeated claim that the hot spot is a signature of CO2 induced warming -- and if the temperature profile don't fit you must acquit. Chris Colose reminds us that the hot spot is actually the signature of any global warming, whatever the forcing. Please see:Tropospheric warming in the tropics is a signature of greenhouse warming, but it is more accurate to say that it is not a unique signature (i.e., you get this "hotspot" with all types of forcings). The 'hotspot' arises due to the moist adiabat. In the extra-tropics you do not don't expect the lapse rate changes to be so dominated by moist convective effects. Skeptics/Denialists Part 2: Hotspots and Repetition Posted on December 20, 2008 http://chriscolose.wordpress.com/2008/12/20/skepticsdenialists-part-2-hotspots-and-repetition
He also points out that it is part of a negative feedback, and if the "hot spot" isn't there then global warming will actually be somewhat stronger than we expect. More evidence that Friends of Science should not be regarded as a trusted source of science news... In any case my apologies for not getting this in the first time around.Moderator Response: Also see the Skeptical Science Argument "There’s no tropospheric hot spot." -
stevee3906 at 06:33 AM on 8 March 2011The Climate Show Episode 8: Kevin Trenberth
It sounds like the science is "Mixed" on hacking or leaking....so are those that insist on hacking then "deniers" ? If they were leaked then that would be a team member who for whatever reason didn't like what was going on. The topic is HidetheDecline, thus the source is part of the topic.Moderator Response: [muoncounter] Perhaps you should listen to the show; there are many topics. The flap over "ClimateGate" has a number of existing threads. -
angusmac at 06:32 AM on 8 March 2011Icing the Medieval Warm Period
Moderator @#22, "For posterity and context, current northern hemisphere temps greatly exceed those of the MWP." I suggest you can only come to that conclusion by using current instrumental temperatures and then comparing them with 1000-year old proxies. This methodology can be incorrect. The correct methodology should be to compare current proxies with past proxies. Let me explain further by utilising Ljungqvist's (2010) reconstruction which is shown in Figure 1 below.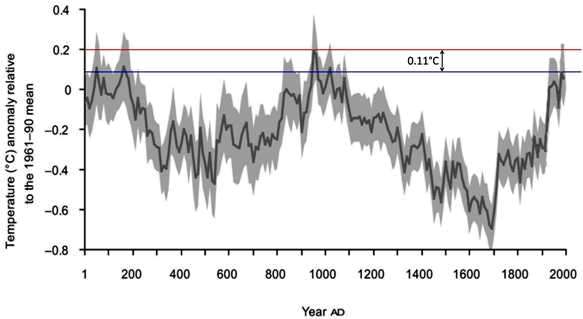 Figure 1: 2000-Year NH Temperature Reconstruction (after Ljungqvist, 2010)
I have plotted the MWP peak temperature as the red line and the modern proxy peak as the blue line on the reconstruction in Figure 1. The instrumental data are deleted for clarity. It is evident from Figure 1 that the MWP peak is 0.11 °C warmer than the modern proxy peak decadal mean (1980-1989).
However, Tom Curtis in #136 @ SkS Hockey Stick Own Goal pointed out that the GISS data show that 2000-2009 mean temperature to be 0.18°C higher than 1990-1999 decadal mean. Therefore, I show Ljungqvist's data in greater detail for the modern instrumental period in Figure 2. The data for Figures 1 and 2 is available from NOAA (here).
Figure 1: 2000-Year NH Temperature Reconstruction (after Ljungqvist, 2010)
I have plotted the MWP peak temperature as the red line and the modern proxy peak as the blue line on the reconstruction in Figure 1. The instrumental data are deleted for clarity. It is evident from Figure 1 that the MWP peak is 0.11 °C warmer than the modern proxy peak decadal mean (1980-1989).
However, Tom Curtis in #136 @ SkS Hockey Stick Own Goal pointed out that the GISS data show that 2000-2009 mean temperature to be 0.18°C higher than 1990-1999 decadal mean. Therefore, I show Ljungqvist's data in greater detail for the modern instrumental period in Figure 2. The data for Figures 1 and 2 is available from NOAA (here).
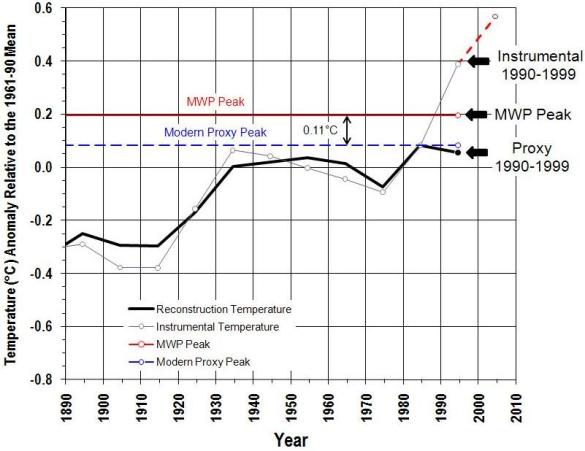 Figure 2: Modern NH Temperature Reconstruction 1860-1999 (after Ljungqvist, 2010)
I have restored Ljungqvist's instrumental data in Figure 2. I have also added 0.18°C as an estimate of the 2000-2009 instrumental decadal mean. This is shown as the dashed red line. Several features are evident from Figure 2, the most important of which are as follows:
Figure 2: Modern NH Temperature Reconstruction 1860-1999 (after Ljungqvist, 2010)
I have restored Ljungqvist's instrumental data in Figure 2. I have also added 0.18°C as an estimate of the 2000-2009 instrumental decadal mean. This is shown as the dashed red line. Several features are evident from Figure 2, the most important of which are as follows:
- There is a very good correlation between Ljungqvist's proxy temperatures and the whole of the pre-1990 instrumental data. Thereafter, they diverge. This is a good illustration of the aptly-named "divergence problem."
- The MWP is approximately 0.11°C warmer than the modern-day proxy temperatures, including the 1980-1989 decadal peak.
- The modern instrumental data for 1990-1999 of 0.39°C and 2000-2009 of 0.57°C exceed the MWP proxy peak temperature by 0.19°C and 0.37°C respectively.
- Notwithstanding item (3), the MWP peak is 0.14 °C higher than the 1990-1999 proxy temperature. Therefore, it is possible to infer that an "instrumental" MWP peak would be approximately 0.14°C higher than the 1990-1999 instrumental temperature, if there were a linear response between proxy and instrumental data. However, to be safe, it may be better to use the 0.11°C difference between the MWP and modern proxies. This would correspond to a MWP peak "instrumental" temperature anomaly of 0. 39 + 0.11 = 0.50°C.
-
muoncounter at 06:22 AM on 8 March 2011A Real-World Example of Carbon Pricing Benefits Outweighing Costs
Rob: "how is all that coal going to be extracted from the ground and transported?" I'd be happy to leave coal exactly where it is; in the ground. There are LPG-powered vehicles in use; school buses, light-duty trucks, even a 5.9L big rig engine. What about biodiesel, which could stretch dwindling fuel stocks for some years? All I'm saying is that the sum total of what Gilles seems to favor results in a do-nothing attitude. It is born out of the pre-conception that atmospheric CO2 is not an urgent problem, so we can get by on fossil fuels as long as they last. That is unfortunately a path we are taking, but not one we should be taking. Counter the argument 'we can't afford to reduce emissions' with 'we can't afford what will happen if we don't'. -
Chris G at 06:14 AM on 8 March 2011Interactive animation of the climate change impact on agriculture
Camburn, "I was not surprised to see a rise in production from more warmth. That is pretty much a given." Yes, because we've all seen how the increased warmth in Russia lead to higher yields last year. On a more serious note, I'm curious to know if the model accounts for precipitation shifts. I'm guessing not really, but I would expect that changes in the pattern of precip would have a more dramatic affect that changes in mean temperature. For instance, this year China is having a drought that will affect their wheat production. There are good indications from the field lately that rain bands are on the move in response to higher temperatures. -
logicman at 06:02 AM on 8 March 2011Icing the Medieval Warm Period
Re: comment #78 - moderator response. Many thanks for the warm welcome! Yes, I did mean the Spielhagen et al paper. I mistakenly copied from my recent urls list the one above Spielhagen. The link I mistakenly posted is a paper suggesting the possibility of sea ice recovery in 2 years after an ice free summer. I have been 'lurking' here for far too long and thought it was about time I signed on/in/up. Best regards, Patrick Lockerby http://www.science20.com/chatter_boxModerator Response: [DB] Patrick, I think your html for the no follow code string in your SkS Sign-on ID is hashed (plus I'm not sure that the no follow string will work there anyway, but it's worth a try; for some reason it shows up as logicman w/ no link in the Recent Comments window, but it's hashed up on the actual threads). Between the left-arrow symbol and the right-arrow symbol should be this string: a rel="nofollow" href="http://www.science20.com/chatter_box" -
Rob Painting at 05:56 AM on 8 March 2011A Real-World Example of Carbon Pricing Benefits Outweighing Costs
Muoncounter @ 83 - According to World coal: "there is enough coal to last us around 119 years at current rates of production." Not going to be exhausted any time soon. Probably not, but if oil runs out, how is all that coal going to be extracted from the ground and transported?. -
Rob Painting at 05:53 AM on 8 March 2011A Real-World Example of Carbon Pricing Benefits Outweighing Costs
Dana 1981 @ 82 - No it's not. Transportation can be accomplished with electric vehicles to a large degree Personal transport?. Yes. Heavy machinery?. No. We still have a long way to go, and better get cracking in creating something to replace it. -
hank at 05:22 AM on 8 March 2011Climate sensitivity is low
http://www.barrettbellamyclimate.com/page17.htmModerator Response: Please provide some context for links. Link-only comments will be deleted. -
muoncounter at 05:18 AM on 8 March 2011A Real-World Example of Carbon Pricing Benefits Outweighing Costs
Gilles #66: "Even if they halved their energy consumption ... I'm just saying this will not reduce the overall consumption. And it won't either reduce the total amount of fossil fuels that we can extract" I don't follow that reasoning at all. Gilles#72 "I am arguing that we MUST do anything we can to spare FF, first because they are being exhausted ... " According to World coal: "there is enough coal to last us around 119 years at current rates of production." Not going to be exhausted any time soon. Add in (from USEIA): "The combustion of coal, however, adds a significant amount of carbon dioxide to the atmosphere per unit of heat energy, more than does the combustion of other fossil fuels" and your argument reduces to one of failure to act. -
Bob Lacatena at 04:57 AM on 8 March 2011Interactive animation of the climate change impact on agriculture
I think one major failing in the model, one which can make climate change seem good by increasing crop yields, is the question of appropriate precipitation ("appropriate" as in how much, how often, and at what time of year from the crop's perspective). That is probably part of the difference in the low/mid/high latitude setting, but since precipitation changes aren't entirely governed by latitude, I'd rather see something just a little more elaborate... either a "precipitation gauge" which responds in concert to altering temperature (i.e. not a control itself -- you change temperature, and that changes precipitation) with a range of changed values, and therefore a range of expected crop yield due to the precipitation range, or else perhaps more simply 3 or 4 separate "crop yield" boxes (zones), to represent various general climate zones ("wet", "arid", etc.), perhaps each with a percentage to show how much of the world will fall into that category in various scenarios. I guess my main point is that I think that changes in precipitation are a far more important and damaging factor in the long run, and it's the intersection of the two (temperature and precipitation changes) that are going to really hurt crop yields... you have to get better temperatures and better precipitation to increase crop yields, while only one of those two needs to drop to greatly reduce crop yields. And in fact, in some circumstances what would otherwise be a productive increase in temperature but combined with a reduction in precipitation, even if only for a several week span during an important part of the growing season, could exacerbate the precipitation problem and make things worse. That is, the effects of changes in temperature and moisture aren't simply additive, but interact in a complex way. -
hank at 04:32 AM on 8 March 2011Climate sensitivity is low
http://www.gfdl.noaa.gov/blog/isaac-held/2011/03/05/2-linearity-of-the-forced-response/ hat tip to: http://scienceblogs.com/stoat/2011/03/dr_roy_spencer_is_sad_and_lone.php -
hank at 04:29 AM on 8 March 2011Climate sensitivity is low
> what's next, redefining the laws of physics ....? Chuckle. Yep. http://www.google.com/search?q=%2Bspencer+%2Bpoptech+%2Brefute -
RickG at 04:21 AM on 8 March 2011Interactive animation of the climate change impact on agriculture
Camburn, I would think the model is based on normal agricultural conditions with temperature being the primary variable. In that respect it would be useful. However, I think the danger with a warming and changing climate is that agricultural zones will also change; therefore, migrate. With growing global population and urbanization, there is are few places left where they can migrate were agriculture is possible. -
dana1981 at 04:14 AM on 8 March 2011A Real-World Example of Carbon Pricing Benefits Outweighing Costs
Gilles #72 -"Oil is needed for transportation, heating"
No it's not. Transportation can be accomplished with electric vehicles to a large degree, and there are alternatives to heating with oil."mainly because climate is hotter, maybe ?"
No, because California has implemented energy efficiency technologies. Our per capita energy consumption has barely increased over the past 30 years. The rest of the country's has increased significantly."without carbon, there is nothing but the poorest life you can imagine."
First of all, nobody is saying we're going to eliminate all carbon, and secondly, claiming that we can't have a high tech lifestyle without massive carbon emissions is utterly absurd. -
Camburn at 04:05 AM on 8 March 2011Interactive animation of the climate change impact on agriculture
Rick: Grains crops benifit from higher levels of co2 during the growing season. As you can see from your chart the level of co2 is now higher than in the recent past. If you were to look at world vegitation maps/health you would see that there is a trend to increased health worldwide of plants. This is in reponse to higher levels of co2. I don't have the studies at hand, but there have been field studies done in the US as to what happens to corn growth and grass growth with higher levels of co2, everything else remaining constant. The response is quit good. My main point is to the usefullnes of the application presented. There are so many variables that affect plant health that using temperature as the metric does not produce a meaningful result. If everything else is constant, then one could surmise that the results of the graph show that more heat is good for ag output. -
scaddenp at 03:51 AM on 8 March 2011The Climate Show Episode 8: Kevin Trenberth
stevee - what has your comment got to do with the topic? This is a site to discuss the science of global warming - plenty of other places for raves about it. Since you are obviously skeptical, why dont you pick the argument against (one per post), that you find most convincing, look at up in the "Arguments" list, and then tell us why you think the debunk is wrong. -
RickG at 03:22 AM on 8 March 2011The Climate Show Episode 8: Kevin Trenberth
Stevee: Has it been determined, scientifically, if the ClimateGate (Hide the Decline) emails were hacked, or leaked ? I doubt they were leaked but it has been scientifically determined that they were deliberately misrepresented. -
stevee3906 at 03:11 AM on 8 March 2011The Climate Show Episode 8: Kevin Trenberth
Has it been determined, scientifically, if the ClimateGate (Hide the Decline) emails were hacked, or leaked ?Moderator Response: [muoncounter] There are a variety of existing ClimateGate threads. Try the Search function. -
RickG at 03:11 AM on 8 March 2011Interactive animation of the climate change impact on agriculture
Camburn: I was not surprised to see a rise in production from more warmth. That is pretty much a given. The added co2 also contributes to a rise in production. One thing to consider is that a number of fruit trees require a minimum number of days below a certain temperature during winter or they will not produce in the spring/summer. As for annual crops, are you familiar with the Keeling curve? See graph below: peaks in the curve are winter while valleys are summer. Crops and other vegetation take up CO2 during the summer but release it during the winter through decay. Any extra CO2 intake by plants will be released after the growing season.
-
stevee3906 at 03:09 AM on 8 March 2011Interactive animation of the climate change impact on agriculture
It is a very simple model. Yet it provides answers to a tenth of a percent. Soil types, soil status, diseases, fertilizers, timing of moisture and weather, seed types, temperate zones all play a role. As I side note, I plant 1,000 trees every spring. In Northern Minnesota the limiting factors are summers to short and too cool, and winters too long and too cold. -
michael sweet at 02:53 AM on 8 March 2011Interactive animation of the climate change impact on agriculture
We need to keep in mind that this is a simple model. As Camburn pointed out, CO2 fertilization might further increase production while lack of rain, or floods, would lower prduction. On the other hand, this model gives a starting point so we know what we need to deal with. Perhaps more irrigation would be enough to adapt if water is the main limiting factor. If no irrigation water is available we might need to move. If heat alone is the limiting factor we need new cultivars that are heat resistant or we must switch to other crops. This model is not the final word, it is a learning exercise.
Prev 1890 1891 1892 1893 1894 1895 1896 1897 1898 1899 1900 1901 1902 1903 1904 1905 Next


