


 Arguments


Recent Comments
Prev 1897 1898 1899 1900 1901 1902 1903 1904 1905 1906 1907 1908 1909 1910 1911 1912 Next
Comments 95201 to 95250:
-
DSL at 04:42 AM on 19 February 2011Meet The Denominator
In the mountains of Colorado, when I was a child, I once found a tiny nugget of pyrite. I thought I was the richest boy in the world. Poptech, the intensity with which you defend and assign meaning to these 850 studies . . . what happens to that intensity when you think about the hundreds of thousands of published studies, experiments, observations, and instrumental records that support the theory of AGW? Do you say, "Yes, those are all very nice, and they do seem to have a point, but I'm just saying that this handful here is worth looking at"? Or do you say, "Yes, well these 850 clearly destroy the credibility of those many thousands"? Or is it that you have a possibly explicable but certainly overwhelming urge to side with the minority? I'm still not sure, after your hundreds of posts on SkS, of what you, yourself (unless you are a program, as les suggests), find to be demonstrably unsupportable about the theory of AGW. You seem to be more of an empty vessel or messenger than an actual critical voice. You might point to studies, but you don't seem to be able to defend those studies when criticisms of them are shown or linked. You either ignore or don't believe possible that an industry could bankroll a journal to serve a number of purposes, including the creation of doubt about AGW within the democracy--not doubt for the sake of science, but doubt for the sake of democratic immobility. E&E is the obvious example here. I suspect that if this matter were of a more personal nature--say regarding evidence that a large rock was about to fall on your head--you would take the majority opinion. If it is your ultimate purpose to cause confusion and doubt in new SkS readers, you're probably your own worst enemy. As many have said, though, your efforts are appreciated. You are typical of the "it's not happening/it's not us/it's not bad" crowd, and your willingness to keep plunging allows a number of political sideshows to be examined more thoroughly. -
The Dai After Tomorrow
Berényi - I am greatly puzzled by your strongly worded comment "We should not spend any money on forced CO2 emission reduction programs..." Prevention will always be less expensive than after-the-fact adaptation. You're advocating the most expensive path with that statement. Secondly - "Of course we should encourage flow of venture capital into R+D programs targeted on development of new energy sources and their introduction to the market as soon as their pricing becomes competitive with no subsidies whatsoever, but never before." Current energy sources are strongly subsidized. Perhaps it would be more appropriate to state that new technologies should enjoy no higher subsidies than existing ones? Or to be even more fair, subsidies no higher than those technologies (like nuclear) enjoyed during their development phases, as an investment in the future? Otherwise you really aren't competing on a level field. Finally - a massive volcanic eruption could indeed cause widespread chaos and damage. So could an asteroid strike, a new plague, virulent crop pests, tsunamis, zombie uprisings, alien invasions, etc. But none of those low probability disaster events justify hiding our heads in the sand and not acting on high probability climate change effects. -
muoncounter at 04:31 AM on 19 February 2011Deep ocean warming solves the sea level puzzle
Andrea: "exploding methane hydrates which bring up heat from the deep earth to the ocean floor." Methane hydrates (or clathrates) form when gas is frozen within ice crystals in the deep ocean. This is quite cold and would not carry 'heat from the deep earth.' Here is a phase diagram: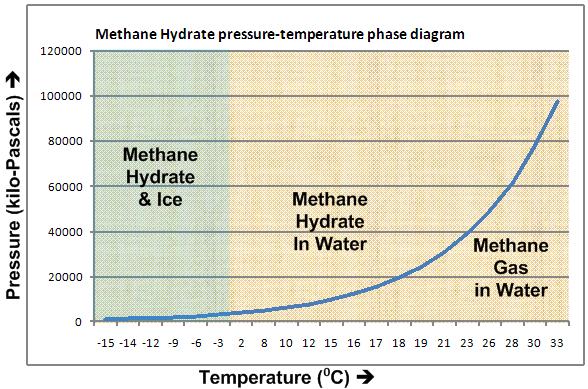 See this thread for additional discussion.
"methane has risen 140% at the same time carbon dioxide has risen 26% "
Atmospheric methane concentrations are typically measured in parts per billion; CO2 in ppm.
See this thread for additional discussion.
"methane has risen 140% at the same time carbon dioxide has risen 26% "
Atmospheric methane concentrations are typically measured in parts per billion; CO2 in ppm.
-
citizenschallenge at 04:18 AM on 19 February 2011A Swift Kick in the Ice
Nice clear explanation. [:thumbs up smilie:] -
Paul D at 04:16 AM on 19 February 2011A Swift Kick in the Ice
Grammatical mistake in the first sentence: understand Spulling mistake in the second paragraph: warm faster 'that' the rest... -
soo doh nim at 04:04 AM on 19 February 2011Monckton Myth #12: Arctic Temperature Changes
@fydijkstra: Care to go to Vegas with that? -
Berényi Péter at 03:37 AM on 19 February 2011The Dai After Tomorrow
#11 Bern at 15:39 PM on 18 February, 2011 I think BP is saying that because there have always been terrible droughts, we don't have to worry about global warming causing droughts. I am saying we have to worry about droughts regardless any climate projections because we know for sure from paleoclimate records that a major volcanic eruption in the Tropics can cause multi-year cooling & drought conditions, hence widespread crop failures. This kind of event can happen any time and we have absolutely no control over its occurrence. Current global food management system is based on the (false) assumption that crop failure in a region is always compensated by good harvest elsewhere, so free trade can solve the problem even without considerable reserves. Of course, that argument ignores the fact that global warming is predicted to increase the *frequency* of such droughts, or the probability that terrible droughts will occur, which, IMHO, is quite an adverse impact. No, it is not predicted, it is projected, which is something entirely different. If it were predicted indeed, one could try to falsify it, but projections, being heavily laden with mays and mights, are essentially unfalsifiable. Consider for example Dai's projection for the Mediterranean. You can see according to Dai's projection severe drought conditions may develop over the Mediterranean by the end of this century.
However, there is research based on actual fossil evidence that indicates otherwise.
Geologie en Mijnbouw 70: 253-264, 1991.
The eastern Mediterranean climate at times of sapropel formation: a review
E.J. Rohling & F.J. Hilgen
"We argue that increased (summer) precipitation along the northern borderlands of the eastern Mediterranean, at times of sapropel formation, was probably due to increased activity of Mediterranean (summer) depressions. Forming predominantly in the western Mediterranean and tracking eastwards, such depressions tend to lower the excess of evaporation from the eastern Mediterranean relative to that from the western basin. Picking up additional moisture along their eastward path, such depressions also redistribute freshwater within the complex eastern Mediterranean water balance."
They say (based on analysis of sea floor sediments) that between 9000 and 6000 BP (during the Holocene climatic optimum) precipitation over NBEM (Northern Borderlands
of the Eastern Mediterranean, where Dai expects extreme drought) was considerably higher than it is today.
At that time NH temperatures were also higher due to increased NH summer insolation, as perihelion of Earth fell into NH summer. Global average might have been somewhat lower because of SH cooling at the same time, but there is very little interaction between weather events of the two hemispheres.
The positive precipitation anomaly is attributed to enhanced land-sea temperature difference, which is also projected to occur under AGW scenarios. From this one can surmise there might be some problem with computational climate models. Indeed, even if they were perfect in in all other respects, their spatial resolution is insufficient to represent local features like cyclone generation over the Mediterranean.
#12 Riccardo at 19:59 PM on 18 February, 2011
You're talking a-scientific here and a bit insulting. I'm sure you know very well that hardly any absolute certainty can be found in cutting edge science. Your accusation of cowardice is really a shame and inappropiate here.
No, the a-scientific statement is found in the article above. To see this clearly, consider the negation of the phrase "most of the Western Hemisphere (along with large parts of Eurasia, Africa, and Australia) may be at threat of extreme drought this century", please.
It looks like "most of the Western Hemisphere (along with large parts of Eurasia, Africa, and Australia) can't possibly be at threat of extreme drought this century", which is obviously false under any reasonable assumption about climate. Therefore the original statement is a truism which has no place in science whatsoever.
It belongs to rhetoric or the language of marketing as it is currently known and is very much like propositions often heard in ads such as "just massage a few drops of this stuff into your hair and it may get up to 63.12% more vibrant".
It has nothing to do with lack of absolute certainty in cutting edge science.
As for shamefulness and inappropriateness the preposterous statement expressed in comment #7 "Population reduction will probably happen in the least affluent countries first and therefore have a minimal ipmact on emissions." surely has these qualities.
It is also insulting because it dares to imply population reduction by mass starvation would be a solution to a problem, if only it happened to the most affluent countries. As soon as people are dying by the hundreds of millions, no sensible person cares for emissions, one cares for people. We are not here to Save the Planet, but to save human souls. It is of course not a scientific stance but a political (or rather ethical) one, but so is speculation about saving the planet by letting people die en masse. It is just a re-dressing of the old Lebensraum theory, nothing else.
To prevent apocalypse, we obviously have to establish massive food reserves, what has to be done anyway, regardless of scary climate scenarios. We also have to spend a lot of money on improving education level of girls in the least affluent countries.
We should not spend any money on forced CO2 emission reduction programs, because that would cripple economic development of less affluent countries (and affluent ones as well), robbing them of the only chance to accommodate to any possible change that may come in the future. Of course we should encourage flow of venture capital into R+D programs targeted on development of new energy sources and their introduction to the market as soon as their pricing becomes competitive with no subsidies whatsoever, but never before.
Agriculture based on current technology, if given a few years leeway by a large distributed food reserve buffer, can adapt to any changes that may be in store for us. But in order to empower people to do that we should help backward nations to improve their conditions by good education, by building infrastructure and embracing cutting edge technology, while forgetting overhyped waste policies like biofuels or windmills ASAP.
No rocket science is needed to accomplish this plan, just some conscience and common sense. Also, it costs much less than the many trillion dollars needed to control a trace gas which has demonstrably no direct harmful effect on human health at all, while it is beneficial to plant life, especially under drought stress.
You can see according to Dai's projection severe drought conditions may develop over the Mediterranean by the end of this century.
However, there is research based on actual fossil evidence that indicates otherwise.
Geologie en Mijnbouw 70: 253-264, 1991.
The eastern Mediterranean climate at times of sapropel formation: a review
E.J. Rohling & F.J. Hilgen
"We argue that increased (summer) precipitation along the northern borderlands of the eastern Mediterranean, at times of sapropel formation, was probably due to increased activity of Mediterranean (summer) depressions. Forming predominantly in the western Mediterranean and tracking eastwards, such depressions tend to lower the excess of evaporation from the eastern Mediterranean relative to that from the western basin. Picking up additional moisture along their eastward path, such depressions also redistribute freshwater within the complex eastern Mediterranean water balance."
They say (based on analysis of sea floor sediments) that between 9000 and 6000 BP (during the Holocene climatic optimum) precipitation over NBEM (Northern Borderlands
of the Eastern Mediterranean, where Dai expects extreme drought) was considerably higher than it is today.
At that time NH temperatures were also higher due to increased NH summer insolation, as perihelion of Earth fell into NH summer. Global average might have been somewhat lower because of SH cooling at the same time, but there is very little interaction between weather events of the two hemispheres.
The positive precipitation anomaly is attributed to enhanced land-sea temperature difference, which is also projected to occur under AGW scenarios. From this one can surmise there might be some problem with computational climate models. Indeed, even if they were perfect in in all other respects, their spatial resolution is insufficient to represent local features like cyclone generation over the Mediterranean.
#12 Riccardo at 19:59 PM on 18 February, 2011
You're talking a-scientific here and a bit insulting. I'm sure you know very well that hardly any absolute certainty can be found in cutting edge science. Your accusation of cowardice is really a shame and inappropiate here.
No, the a-scientific statement is found in the article above. To see this clearly, consider the negation of the phrase "most of the Western Hemisphere (along with large parts of Eurasia, Africa, and Australia) may be at threat of extreme drought this century", please.
It looks like "most of the Western Hemisphere (along with large parts of Eurasia, Africa, and Australia) can't possibly be at threat of extreme drought this century", which is obviously false under any reasonable assumption about climate. Therefore the original statement is a truism which has no place in science whatsoever.
It belongs to rhetoric or the language of marketing as it is currently known and is very much like propositions often heard in ads such as "just massage a few drops of this stuff into your hair and it may get up to 63.12% more vibrant".
It has nothing to do with lack of absolute certainty in cutting edge science.
As for shamefulness and inappropriateness the preposterous statement expressed in comment #7 "Population reduction will probably happen in the least affluent countries first and therefore have a minimal ipmact on emissions." surely has these qualities.
It is also insulting because it dares to imply population reduction by mass starvation would be a solution to a problem, if only it happened to the most affluent countries. As soon as people are dying by the hundreds of millions, no sensible person cares for emissions, one cares for people. We are not here to Save the Planet, but to save human souls. It is of course not a scientific stance but a political (or rather ethical) one, but so is speculation about saving the planet by letting people die en masse. It is just a re-dressing of the old Lebensraum theory, nothing else.
To prevent apocalypse, we obviously have to establish massive food reserves, what has to be done anyway, regardless of scary climate scenarios. We also have to spend a lot of money on improving education level of girls in the least affluent countries.
We should not spend any money on forced CO2 emission reduction programs, because that would cripple economic development of less affluent countries (and affluent ones as well), robbing them of the only chance to accommodate to any possible change that may come in the future. Of course we should encourage flow of venture capital into R+D programs targeted on development of new energy sources and their introduction to the market as soon as their pricing becomes competitive with no subsidies whatsoever, but never before.
Agriculture based on current technology, if given a few years leeway by a large distributed food reserve buffer, can adapt to any changes that may be in store for us. But in order to empower people to do that we should help backward nations to improve their conditions by good education, by building infrastructure and embracing cutting edge technology, while forgetting overhyped waste policies like biofuels or windmills ASAP.
No rocket science is needed to accomplish this plan, just some conscience and common sense. Also, it costs much less than the many trillion dollars needed to control a trace gas which has demonstrably no direct harmful effect on human health at all, while it is beneficial to plant life, especially under drought stress.
-
Rob Honeycutt at 03:36 AM on 19 February 2011Meet The Denominator
Poptech... "ncorrect, nothing has been demonstrated outside of the less than 1% margin of error that the list has maintained since it came out over a year ago." How can you possibly assign a margin of error to your own subjective opinion? -
michael sweet at 03:04 AM on 19 February 2011A basic overview of melting ice around the globe
Peter, You cannot have it both ways. Either you think the sea level rise will continue at its present rate or you think it will increase rapidly in the future. In your first paragraph you claim the first and in your second you claim the second. You need to decide what you think the data support. Hand waving optimism is nice, but not very convincing or productive. Current scientific estimates of sea level rise by 2100 range from one to five meters. Do you have any data to suggest these estimates are incorrect? Since we agree that over 1 meter of sea level rise is terrible and current best estimates are for more rise than that, we need to propose what can be done now to change BAU so that these terible things do not occur. Hoping that people at some undefined future date will be smarter than we are, and will have the technology to save themselves is not much of a plan. -
RickG at 02:18 AM on 19 February 2011Monckton Myth #13: The Magical IPCC
#23 XPLAIN: Thanks, but none of that explains why a schematic of 'central England temps' was published as 'global temps'. It's just sloppy. The diagram didn't represent what it claimed to, and like the Himalayan glacier error, undermines public confidence in the IPCC. The 1990 report noted that it was not clear whether all the fluctuations indicated were truly global (p 202). How is that sloppy? -
Dikran Marsupial at 02:06 AM on 19 February 2011Monckton Myth #13: The Magical IPCC
XPLAIN@23 A schematic is only intended as a qualitative rather than a quantitative description - if at the time the MWP was considered likely to be a global phenomenon, then the schematic for global temperatures and for CET would be the same. This seems to me to be making a mountain out of a molehill. -
Empirical evidence for positive feedback
co2isnotevil - Regarding cloud feedback, I suggest you look at (and comment upon) What is the net feedback from clouds, and in particular Clement et al. (2009). The data indicates that low level clouds are decreasing with warming, producing a positive feedback. Glaciers - 95% of the worlds glaciers are retreating. Perhaps you are skiing on one of the 5% that isn't? Projecting local conditions to global ones without supporting data is a common error. I'm not going to go into the water vapor and CO2 feedback claims you make, aside from noting that everyone in the field disagrees with you. This was more than sufficiently covered in overly long discussions here and here. -
XPLAlN at 01:39 AM on 19 February 2011Monckton Myth #13: The Magical IPCC
#22 Sphaerica Thanks, but none of that explains why a schematic of 'central England temps' was published as 'global temps'. It's just sloppy. The diagram didn't represent what it claimed to, and like the Himalayan glacier error, undermines public confidence in the IPCC. "who knew that the Managerial Wall Period was going to become a rallying cry for an ignorance driven contrarian machine?" Sure this was pre-denialosphere but I don't think that's any excuse. Take contrarians out the equation: the accuracy of the information published by the IPCC should be to the highest possible standard regardless. It's what we fund them for. -
AnotherBee at 01:30 AM on 19 February 2011The Dai After Tomorrow
Berényi Péter #8 It sounds as though you are arguing against the language rather than the content. We are all guilty of occasional sloppy language like "may be at threat". What I think the author means is "our models show that there is an increased risk". This would make it clear that the null hypothesis is the current (or past) level of risk (the current frequency of extreme precipitation events and the current frequency of extreme drought events). The authors argument is that these events are becoming more frequent and therefore there is a deviation from the null hypothesis. Additional commentary: The combination of drought and extreme precipitation events is a poor prospect for agriculture. In many areas where the water supply is already under stress, aquifers are depleted. Extreme precipitation events tend not to replenish aquifers as the water is lost in sudden run-off, rather than soaking into the lower strata. -
guinganbresil at 01:22 AM on 19 February 2011PMEL Carbon Program: a new resource
Rob Painting, muoncounter, and michael sweet - thanks for the spirited debate - I have learned a lot. michael sweet - you have a good point about the Feely et al 2008 paper. I am not so sure about the linearity of the simple subtraction of the 31 umol/kg anthropogenic CO2 component. I expect that removing the signal is not the same as having not produced the anthropogenic CO2 in the first place. "One woman can bear one child in nine months, therefore nine women can bear one child in one month..." muoncounter - I agree 'insidious' might be strong. I understand the actual meaning of the graph and agree that it as I would expect it qualitatively. I have no reason to suspect that the researchers have 'gamed' it in any way. The 'insidious' part is that it is so easily misinterpreted - I suspect that the general public actually believes that the oceans are more 'acidic' (you know why I put it in quotes...) near the surface because of the CO2 dissolving from the atmosphere. Rob Painting - I will go out on a limb and say you are way off base saying that upwelling can't cause surface pH drops because the deep water is not showing a pH (or DIC) change. I don't think you understand the magnitude of the numbers here. we are talking about mixing pH 7.6 deep water with pH 8.1 water at the surface - that is a 0.5 pH unit difference... Compare that to the 0.1 pH difference from the whole industrical revolution... You could use the percent increase trick (nobody I know measures pH like this-and I won't) to figure out the % difference in pH between the shallow and deep water. Keep in mind that I am not saying that upwelling is causing all of the changes observed - just some of the drastic effects reported (sad shellfish etc.) A good example is that the 'hot spot' on the graph above between 45N-55N - if you look at the data behind these measurements you will see that the ocean surface temperature was 3C cooler oin the first trip than the second over this region... -
andthorne at 01:06 AM on 19 February 2011Deep ocean warming solves the sea level puzzle
For once I am in agreement with you: however, you have left out the source of the warming, which is exploding methane hydrates which bring up heat from the deep earth to the ocean floor. You have also left off another source of rising seas: Methane oxidation. Methane oxidizes to formaldehyde and water, before progressing to carbon monoxide and then carbon dioxide. Rising methane means rising amounts of water vapor in our air that comes down as rain and snow and hail, and off course the oxidation of methane which takes place on our seas and does not escape to the air contributes as well. Yet another reason our seas are rising is that a weaken crust of the earth is subsiding; the continental shelfs are collapsing and we are sliding toward the seas. How about calculating: Given methane has risen 140% at the same time carbon dioxide has risen 26% What percentage of the 26% rise in methane is wholly attributible to methane oxidation. Andrea Silverthorne -
dorlomin at 00:21 AM on 19 February 2011Deep ocean warming solves the sea level puzzle
Just to confirm the majority of the energy getting into the deeper layers is getting their by transport (currents) and not conduction, so things like where the thermohaline overturn in the North Atlantic it takes energy with it to the deeper oceans. -
dorlomin at 00:16 AM on 19 February 2011Deep ocean warming solves the sea level puzzle
Does this include water coming from aquifers? I seem to recall last year a paper claiming about ¼ of the sea level rise was due to aquifer being emptied (and in itself that is a huge problem). -
Ann at 23:18 PM on 18 February 2011Monckton Myth #12: Arctic Temperature Changes
@fdijkstra: Could you also please give a prediction for 2011-2030 ? -
les at 20:28 PM on 18 February 2011Meet The Denominator
I've finally sussed it! ... Pop Tech is a modern, web based version of eliza. Clearly the sites techies have some kind of rule based AI engine, I suspect with a 3 stage markov chain, which does a textual analysis of posts (hence the quotes) and responds with: - that's objective/subjective - a return question - that's not logical - some phrases from a data base of replies etc. They've pre-loaded it with an ontology based on website posts... to narrow down the Q&A domain. This clearly explains why a "popular technology" website doesn't have any popular technology on it... it is a bit of technology! I think it's brilliant! -
Riccardo at 19:59 PM on 18 February 2011The Dai After Tomorrow
Berényi Péter #8 "The statement above is actually a coward one." You're talking a-scientific here and a bit insulting. I'm sure you know very well that hardly any absolute certainty can be found in cutting edge science. Your accusation of cowardice is really a shame and inappropiate here. -
co2isnotevil at 19:53 PM on 18 February 2011Empirical evidence for positive feedback
muoncounter, I know that the Sierra alpine glaciers are growing because my friends and I have been skiing them all summer for 20+ years and there's a clear progression from year to year. They grew for a while, shrank or stayed about the same for a decade and have started growing for the last 3 years and most likely again this year. As for positive water vapor feedback, this is absolutely incorrect when clouds are considered a water vapor influence. Look at the work of Spencer, Lindzen and others for more details, or just look at the actual data (instead of highly processed anomaly plots). Of course, this presupposes you have a strong background in thermodynamics, control theory and more, rather than just faith in another persons interpretation, This article claims empirical evidence supporting positive feedback, but the evidence cited is nothing more than unsupportable conclusions based on preconceived bisses. -
Rob Honeycutt at 17:09 PM on 18 February 2011Meet The Denominator
Poptech..."If only half should be thrown out. Since you do not know how many should be included it these sorts of statements are just as meaningless." No. You and I both know that most the papers are clearly peer reviewed and are referencing climate change. The statements are meaningful and quite damning to your list. "Rigorous methods have been applied to my list as each selection was independently reviewed. The number of errors found since the list was released has been less than 1%." This has not been demonstrated. In fact, it has been shown to be utterly false. -
Riduna at 16:40 PM on 18 February 2011A basic overview of melting ice around the globe
Anil Anantheswamy writes in Greenland poised on a knife edge in New Scientist (8 Jan 11, p8), that the ice sheet will reach a tipping point in the early 2040’s, after which nothing mankind does will prevent its eventual collapse. He points out that Greenland’s bedrock dips down, like a soup plate, and that glacier retreat beyond the edge of the dish would result in retreat up to 80 km inland causing huge embayments into the ice sheet. Were this scenario to be realised, how long would it take for the ice sheet to melt? 1,000 years? Adding an average of 0.7m/century to sea level. With loss of Antarctic ice and thermal expansion of seawater, a sea-level rise of ~2m by 2100 seems more realistic than alarmist. Were that to occur, the world as we now know it would cease to exist, particularly for the 70% of global population living on or near the present coast. But fear not. Government intends reducing greenhouse gas emissions by 5% below 2000 levels by 2020 ! -
Peter Offenhartz at 16:06 PM on 18 February 2011A basic overview of melting ice around the globe
@Gordon(50) Several commentators have attributed to me opinions that are not mine. So a couple of clarifications are in order. First, I agree that a sea level rise of a meter in any time period less than 100 years would be terrible. But it is important to treat this figure as an estimate that might or might not be correct, and to contrast it with the current rise rate of one foot per 100 years. Likewise, I do not mean that it will take 40,000 years for the polar ice caps to melt. I do mean that if the melt rate doubles every 5 or 6 years there would still be a lot of ice left in 50 years. I am an optimist about human capabilities. And I don't believe humans can look ahead for more than a few decades. Is that a contradiction? Perhaps. But I find it hard to take seriously projections 50 years or more from now that seem to reject the possibility that humans will take more serious steps to reduce the rate of global warming during the next decade or two or three. I believe we will have time to react at some future date when the data upon which estimates are based is inevitably of better quality. In the interim, I believe it is very important for everyone to compare estimates of future rates with present rates, in order to demonstrate the discrepancy between the two. And numbers like "thousands of gigatons" (or cubic kilometers) are not helpful to general understanding unless they are presented as a ratio. -
Bern at 15:39 PM on 18 February 2011The Dai After Tomorrow
Albatross: I think BP is saying that because there have always been terrible droughts, we don't have to worry about global warming causing droughts. Of course, that argument ignores the fact that global warming is predicted to increase the *frequency* of such droughts, or the probability that terrible droughts will occur, which, IMHO, is quite an adverse impact. -
co2isnotevil at 13:51 PM on 18 February 2011Empirical evidence for positive feedback
Water vapor and CO2 'feedback' is miniscule. It takes 341.5 W/m^2 to produce no more than 1.1 W/m^2 of intrinsic effect. The additional effect from the CO2 'warming' is (1.1^2)/341.5 -> .0035 W/m^2, or mouse nuts. The same is true of water vapor, relative to GHG effects. Beside, the effects of GHG directly affect the system gain and not the feedback anyway. While there was some contraction of average N hemisphere snow/ice a few years ago, it represented a relatively small fraction of change, relative to the whole, moreover; S hemisphere ice was been growing at the same time. Alpine glaciers in the Sierra Nevada mountains have been growing for 3 consecutive years and this winter has seen record snow cover and cold over most of N America and Europe. Do the math folks. Consider how small these changes are relative to the peak extents of summer and winter. There's nothing at all unusual or unexpected about the direction, rate or magnitude of any changes we see. The most convincing empirical data is that without clouds, the global temperature would be higher owing to a lower albedo. Clouds provide the predominate feedback mechanism and the net effect of more clouds makes the surface cooler and makes the planet look colder from space (clouds are colder than the surface when seen from space). This manifests the clear signature of net negative feedback.Moderator Response: [muoncounter] This thread is about evidence for feedbacks. Please see Are glaciers growing for evidence that they are not or to substantiate your claim. Please see A positive outlook for clouds for evidence that water vapor feedback is significant or to substantiate your claim. Please avoid rehashing discussions that already have long complicated threads unless there is some new published science or evidence on the topic. -
muoncounter at 13:49 PM on 18 February 2011A basic overview of melting ice around the globe
Albatross, Sorry, didn't mean to scoop you. I'd have to look at some actual maps, but the EO image sure makes it look like that the southern part could be on the block. Worth checking around to see what other recent images are out. -
Marcus at 13:39 PM on 18 February 2011Meet The Denominator
So, I decided to look up E-G Beck on Google Scholar &-guess what? He's only ever been published in E&E, & his paper has only been cited by authors publishing in E&E. No one publishing in any other journal seems willing to touch Beck with a 10-foot barge pole. -
Albatross at 13:38 PM on 18 February 2011A basic overview of melting ice around the globe
Muoncounter @53, I just signed on to post the very same image ;) Does it perhaps suggest that the southward extending "limb" of the ice sheet is vulnerable in the coming century or so? If so, any idea how much that would contribute to GSL? The NASA article says 0.6 m by 2100, but does not say where the greatest ice loss will be from. -
Albatross at 13:24 PM on 18 February 2011The Dai After Tomorrow
I am quite familiar with this subject, yet I have no idea what BP is driving at. I see a lot of text but very little substance or coherence. -
muoncounter at 13:17 PM on 18 February 2011A basic overview of melting ice around the globe
New image of the day at Earth Observatory. 2010 was an exceptional year for Greenland’s ice cap. Melting started early and stretched later in the year than usual. Little snow fell to replenish the losses. By the end of the season, much of southern Greenland had set a new record, with melting that lasted 50 days longer than average.
Also a shout out to Marco Tedesco cryocity website at CCNY, where this gem is shown:
2010 was an exceptional year for Greenland’s ice cap. Melting started early and stretched later in the year than usual. Little snow fell to replenish the losses. By the end of the season, much of southern Greenland had set a new record, with melting that lasted 50 days longer than average.
Also a shout out to Marco Tedesco cryocity website at CCNY, where this gem is shown:
 The figure above shows the standardized melting index anomaly for the period 1979 – 2010. In simple words, each bar tells us by how many standard deviations melting in a particular year was above the average. ... Over the past 30 years, the area subject to melting in Greenland has been increasing at a rate of ~ 17,000 Km2/year.
This is equivalent to adding a melt-region the size of Washington State every ten years. Or, in alternative, this means that an area of the size of France melted in 2010 which was not melting in 1979.
Au revoir, Paris.
The figure above shows the standardized melting index anomaly for the period 1979 – 2010. In simple words, each bar tells us by how many standard deviations melting in a particular year was above the average. ... Over the past 30 years, the area subject to melting in Greenland has been increasing at a rate of ~ 17,000 Km2/year.
This is equivalent to adding a melt-region the size of Washington State every ten years. Or, in alternative, this means that an area of the size of France melted in 2010 which was not melting in 1979.
Au revoir, Paris.
-
Marcus at 13:14 PM on 18 February 2011Meet The Denominator
"ncorrect, what I have shown is that I readily admit that a small margin of error may exist within the list (1%) and I have taken steps to deal with this by actually having more papers than the actual number." As I've said, PT, claiming something is incorrect doesn't make it so-no matter how much you repeat the claim. The fact that your list consists of so many papers from E&E; that it contains so many papers that deal with Paleo-climate, not current climate (& so only speak to past drivers of climate change, not current ones); that many of the papers are opinion-based, not evidence-based; that many are published in obscure journals that have nothing to do with Climate Science or even the Environment; that you readily admit that you don't bother to check whether all the papers on your list are peer-reviewed; that many of the papers have since been debunked (not merely criticized, but outright proven *wrong*); that many of the papers clearly don't even support your "thesis" & that many of the papers are mutually contradictory *prove* that you're not low-balling at all, but are just casting as wide a net as possible to pad out the numbers (&, clearly, the size of that number is massively important to you-no matter your claims to the contrary). If the skeptic argument were so strong, then you'd be able to reach those same numbers purely from pure-science papers, from ISI listed journals, & without having to rely on mutually contradictory positions. That you've failed to do so proves, as I've said before, that your list is *junk*-& saying otherwise won't change a thing. -
David Horton at 13:10 PM on 18 February 2011The Dai After Tomorrow
Ah yes Berenyi, the "seen it all before" approach. -
Marcus at 13:06 PM on 18 February 2011Meet The Denominator
"Beck's paper was peer-reviewed and supports skepticism of AGW, thus is meets the criteria for inclusion on the list." Oh dear, your skepticism really is highly selective-isn't it? Just because E&E claims papers are peer-reviewed, doesn't make it so. If it were, it would have a far better reputation in the scientific community (it doesn't, btw) & would be listed on the ISI (which is the Gold Standard in scientific circles). If I tried to submit the "quality" of data that Beck tried to pass off, I'd be lucky to keep my job-let alone get published in a genuinely peer reviewed paper. So please spare me your "all-knowing BS", 'cause you don't know *diddley* about peer-review. You're just displaying an extremely bad case of D-K syndrome. -
Berényi Péter at 13:04 PM on 18 February 2011The Dai After Tomorrow
"the paper finds most of the Western Hemisphere (along with large parts of Eurasia, Africa, and Australia) may be at threat of extreme drought this century" What kind of language is that? I have read the paper and still can't figure out what's that supposed to mean. I can see (e.g. Fig. 1. & 2.) during the last thousand years not only threat of extreme drought was present over the Western Hemisphere (along with large parts of Eurasia, Africa, and Australia), but such events actually occurred multiple times over various regions. (-Off-topic snipped-). (-Inflammatory snipped-). Not even a much stronger version like "There will be extreme drought events in most of the Western Hemisphere (along with large parts of Eurasia, Africa, and Australia) this century" can be refuted. (-Off-topic snipped-) Extreme drought events in the historical record seem to cluster around cold spells while warm periods are generally wetter. (-Off-topic snipped-). (-Off-topic snipped-). (-Very off-topic soliloquy snipped-)Response:[DB] Off-topic unsupported assertions snipped.
-
Riduna at 12:29 PM on 18 February 2011The Climate Show Episode 7: Cryosphere special
Well done John Cook! -
Torleif at 12:26 PM on 18 February 2011The Dai After Tomorrow
Bern. I'm scaring myself here but, we're closer than you think. Russia is banning wheat exports due to low harvest caused by record drought. As 4th largest worldwide grower of wheat this has pushed global prices up. Australia's (9th globally and globally largest exporter) wheat harvest is adversely affected by recent flooding after years of drought. Ukrain (8th globally) is affected by the same drought as Russia. This is just wheat. Considering that globally, intense and destructive weather events are likely to become more frequent and more intense we face a likely scenario where staple grain production cannot meet demand sometime in the near future. Population reduction will probably happen in the least affluent countries first and therefore have a minimal ipmact on emissions. I was just interested to see if anyone had factored it in. Having said all of that, you're probably right. -
actually thoughtful at 12:14 PM on 18 February 2011The Dai After Tomorrow
Torleif, the thrashing for survival will use more fossil fuel, not less. These are the best of times to fight climate change. We will never be richer or less panicked about food and water then right... right... NOW. -
Marcus at 12:13 PM on 18 February 2011Meet The Denominator
"Which is irrelevant as I have added 15 more papers in it's place and the list already had an additional 25 papers beyond the 850." Hope you bothered to make certain that they claim what you say they claim-because you've shown a pretty bad habit so far of just putting anything on the list that even *sounds* like it supports your position-which is another great example of bad scientific method-gee, no wonder you're so quick to defend Beck's piece of garbage, you're like kindred spirits. -
Bern at 11:50 AM on 18 February 2011The Dai After Tomorrow
@Torleif - if it gets to that, it'll be too late - the amount of CO2 already emitted will 'lock in' the warming for centuries to come. -
Bern at 11:49 AM on 18 February 2011The Dai After Tomorrow
Looks like it'll be much worse in other parts of the world than in Australia... One other thing to remember, is that while there may be increased rainfall, it may fall in shorter, more intense downfalls, with long, dry periods in between. The drought conditions lead to dry soils & little vegetation, so much of the rainfall will just run off, potentially causing flooding and enormous soil erosion problems. Those would compound soil erosion by 'dust bowl' type events, where dry soils are picked up by the wind and just blown away. It'll take very careful land management to keep soils productive in those sorts of conditions. It will almost certainly mean significantly reduced crop yields, which, when you combine it with projected world population of around 10 billion, is a recipe for disaster. -
Torleif at 11:49 AM on 18 February 2011The Dai After Tomorrow
This is a bit heartless, but I'm wondering if anyone has factored in the reduction of emissions as the population declines in line with lack of water and reduced crops? -
muoncounter at 11:36 AM on 18 February 2011CO2 is not increasing
Koy: The EIA has data for annual worldwide carbon emissions, with country breakdown if you are so inclined. 1980: 18.4 Gtons; 2009: 30.4 Gtons. Net= +12.0 Gtons/yr. Over 30 years, that is actually an average growth rate of 1.7% per year. -
Daniel Bailey at 11:36 AM on 18 February 2011CO2 is not increasing
Re: koyaanisqatsi (31) This graphic shows the rise in emissions as well as the attribution: Data through 2003, so it's a bit dated.
The Yooper
Data through 2003, so it's a bit dated.
The Yooper
-
Daniel Bailey at 11:32 AM on 18 February 2011Empirical evidence for positive feedback
IIRC, 52 PPM by itself. Coupla beers ago I'd have actually looked it up. ;) The Yooper -
PT_Goodman at 11:14 AM on 18 February 2011CO2 is not increasing
Regarding my own comment 28. I'll look at my "analysis" again. But as I was lying in bed last night, and again this morning, I concluded that I was being overly-simplistic. I implicitly assumed/ was provided a constant rate of Carbon emissions increase (1%) from 1960 to 2010, and that probably is not the case. The 1% figure is no doubt an average rate of increase. -
muoncounter at 11:14 AM on 18 February 2011Empirical evidence for positive feedback
This can't be good. Thawing permafrost will accelerate global warming in decades to come, says new study One- to two-thirds of Earth’s permafrost will disappear by 2200, unleashing vast quantities of carbon into the atmosphere, says a study by researchers at the Cooperative Institute for Research in Environmental Sciences (CIRES) National Snow and Ice Data Center (NSIDC). “The amount of carbon released is equivalent to half the amount of carbon that has been released into the atmosphere since the dawn of the industrial age,” said NSIDC scientist Kevin Schaefer. “That is a lot of carbon.” -
Ken Lambert at 11:14 AM on 18 February 2011A Case Study of a Climate Scientist Skeptic
Bibliovermis #79 The Ceres TOA imbalance measurement was +6.4W/sq.m last time I checked. This was 'corrected' down to 0.9W/sq.m to match Hansen's 2005 models. So the imbalance is based on models - not measurement. -
Marcus at 11:14 AM on 18 February 2011Meet The Denominator
FWIW, I really couldn't give two hoots about his precious list, 'cause its so obviously a pile of garbage. His own words-whether he admits it or not-actually confirm that fact. What got my back up was his deliberate misrepresentation of how the scientific method works, & how peer-review works. Having worked in science for the better part of 16 years, it always irks me when those with no knowledge run off at the mouth-like he was. Still, as Rob says, regardless of what his ego is telling him, his audience actually sounds pretty limited.
Prev 1897 1898 1899 1900 1901 1902 1903 1904 1905 1906 1907 1908 1909 1910 1911 1912 Next


