


 Arguments


Recent Comments
Prev 1974 1975 1976 1977 1978 1979 1980 1981 1982 1983 1984 1985 1986 1987 1988 1989 Next
Comments 99051 to 99100:
-
Ned at 05:26 AM on 8 January 2011Ice age predicted in the 70s
My favorite early paper on climate change is Wally Broecker's 1975 paper in the journal Science: Broecker, W. 1975. Climatic change: are we on the brink of a pronounced global warming? Science, 189-460-463. It's discussed in some detail at RealClimate ("Happy 35th birthday, global warming!"). Kind of neat that even back in 1975, Wally B. was using both "climat[ic] change" and "global warming" more or less interchangeably ... even in the very title of this paper. Also, amazingly prescient of Wally, considering that 1975 is more or less when global temperatures came out of a lull and began rising steadily. -
apiratelooksat50 at 05:21 AM on 8 January 2011Understanding the CO2 lag in past climate change
118 Sphaerica, "In today's case, the temperature-stable CO2 level is still 285 ppm, even though we've cranked it up to 390 ppm. 285 ppm is the level that the planet wants to hold CO2 to right now, based on the current mean global temp. We have artificially pumped that up to 390 ppm, not by changing the planet's temperature (the "natural" way) but rather by injecting the CO2 into the atmosphere." Respectfully, how did we artificially "crank up" the CO2 level to 390 ppm from a 285 ppm normal? And, how do you arrive at the 285 ppm figure? -
muoncounter at 04:58 AM on 8 January 2011We're heading into cooling
#15: "it lined up with the NAO/PDO cycles" Every time we go off topic on one of these NAO/PDO tangents, I have to wonder how an oscillation can give rise to a long period increasing trend. But that topic belongs to this thread. -
Mila at 04:35 AM on 8 January 2011Zvon.org guide to RealClimate.org
Thanks :) #1 my work includes a lot of ad hoc programming and manual work (my background in organic chemistry helps, if for almost 10 years you spend a few hours a day washing glassware you are prepared for some tedious work :) ) I am not aware of any software which would fulfill your needs, but I would expect that some exist. But be cautious before purchase, it means to correctly read in PDF files and identify important bits (and this is far from trivial - you may see at Google Scholar that even for them it is not always easy), then to assign dois, as soon as you have PDF - dois mapping the rest is not so difficult -
Yvan Dutil at 04:32 AM on 8 January 2011Graphs from the Zombie Wars
#54 @caerbannog For those who think that the CO2-lags-temperature argument is a valid argument against global-warming theory, here's a question: Why was the Earth so warm then? (Now remember that solar + land-albedo forcing was the same or a bit less then than it is now). Well, it comes that CO2 concentration was much higher then than now. http://www.sciencemag.org/content/330/6005/819.abstract This as been discussed here before: http://www.skepticalscience.com/Climate-change-from-40-million-years-ago-shows-climate-sensitivity-to-CO2.html -
mmiller at 04:24 AM on 8 January 2011The Scientific Guide to Global Warming Skepticism
As evangelical Christian, I would like to thank you for this site and this guide. I have too many friends who are anti science and think global warming is a left wing conspiracy. -
Anne-Marie Blackburn at 03:27 AM on 8 January 2011Zvon.org guide to RealClimate.org
Another phenomenal resource, so again thank you for this, Mila. -
Albatross at 03:21 AM on 8 January 2011Zvon.org guide to RealClimate.org
Wow Mila, you continue to impress. If one is willing to create the database of PDFs of journal papers, could one use your code to create a searchable database? I think researchers would clammer to purchase a software package that would help generate such a database (by ripping though folder containing hundreds of PDFs) and then creating an interactive search engine. I have thousands of papers in my PDF library, but finding the right paper can be tedious and time consuming. Maybe something like that already exists, in which case I'd be delighted if someone could point me in the right direction. Thanks. -
cruzn246 at 03:09 AM on 8 January 2011We're heading into cooling
There are all kinds of cycles Bib. We have been in some multi decadal cycles over the past 30/60 years that we still do not fully understand. It seems the PDO NAO tandem may be driving this shorter term cycle we are in. There are more than a few scientists who see this multi decadel cycle as real. I know I saw some kind of 30/60 year cycle in my tornado data for Alabama. It sure looked like it lined up with the NAO/PDO cycles to me. Response: [Daniel Bailey] Then prove it: do the analysis, write it up, publish it. I plan to as a grad student. -
cruzn246 at 02:54 AM on 8 January 2011We're heading into cooling
Are you studying it Bib? -
cruzn246 at 02:53 AM on 8 January 2011We're heading into cooling
There are all kinds of cycles Bib. We have been in some multi decadal cycles over the past 30/60 years that we still do not fully understand. It seems the PDO NAO tandem may be driving this shorter term cycle we are in. There are more than a few scientists who see this multi decadel cycle as real. I know I saw some kind of 30/60 year cycle in my tornado data for Alabama. It sure looked like it lined up with the NAO/PDO cycles to me.Moderator Response: [Daniel Bailey] Then prove it: do the analysis, write it up, publish it. -
Bibliovermis at 02:53 AM on 8 January 2011We're heading into cooling
When discussing the global climate, it helps to study the "whole world". -
Alec Cowan at 02:46 AM on 8 January 2011Understanding the CO2 lag in past climate change
@gallopingcamel #116 There's a buzzword "correlation" and there's a statistical concept. For instance, you have to calculate a correlation for two variables and you get a number that has usually attached adjectives -like 'good'- in intervals set by uniform criteria. In your sentence "While this is a relatively small region, there is a good correlation between the GISP/GRIP results and Vostok in Antarctica" declares an adjectival correlation for two names, something that doesn't exist. Could you state your variables and the value of such correlation? Either you did the calculations yourself or you get the values elsewhere, so you should have no problem in answering that. Other choices are you got it as a verbal chain elsewhere and are repeating it without really knowing -the bad use of concepts may be a hint- or you might be making that up. I don't think the last choices are possible, but in the lack of a precise answer, what one should think? -
Bibliovermis at 02:45 AM on 8 January 2011We're heading into cooling
Cool weather in your area does not cancel out global warming. I suspect in 10 years you'll still be saying "global cooling is going to start now" because it snowed somewhere during winter. There is no 60 year temperature cycle. This persistent "skeptic argument" needs its own article. -
cruzn246 at 02:45 AM on 8 January 2011We're heading into cooling
Murph, I am studying climatology. I just finished a paper on the climatology of Tornadoes in Alabama over the past 60 years. I am not a graduate student so it was not up for peer review. It was my senior project though, and no scientific error was found by my professors. I have to admit that I do not seriously study the "whole world" thing yet, because quite frankly it's about way too complicated, but I know that many of the "it's never been" stuff we are seeing now is pure baloney. BTW, my study showed that we have been in a down period for tornadoes over Alabama. Activity peaked in that area in the mid 70s and declined from that point on till the mid 90s. It is now on the upswing and is back to where it was in the early 50s. Using ten year averaging I made a graph that almost looks like a sine wave that shows the trend. A colleague did Georgia and found the same thing.Moderator Response:[Daniel Bailey]
"I have to admit that I do not seriously study the "whole world" thing yet, because quite frankly it's about way too complicated, but I know that many of the "it's never been" stuff we are seeing now is pure baloney."
Welcome to the field. If you want to get a degree in climatology you should spend more time learning the hard stuff and less time hand-waving.
-
kdfv at 02:37 AM on 8 January 2011It's freaking cold!
#68 jmurphy the second map is http://climvis.ncdc.noaa.gov/cgi-bin/cag3/state-map-display.plModerator Response: [Daniel Bailey] Your URL link is broken. -
cruzn246 at 02:32 AM on 8 January 2011We're heading into cooling
Well, we are going through our coldest winter in a heck of a long time in the Midwest. Why not pop up? Sorry about the EPO typo, you all knew I meant the PDO. Don't know what I was thinking. 2010 was one of the warmest? Big deal. 1977 was one of the coldest and it was during the beginning of last warm-up period. You get some contradictory times on the edge of periods. We are in a cooling period. you'll all admit it on about ten years.Moderator Response:[Daniel Bailey] Wrong:
-
keithpickering at 02:24 AM on 8 January 2011Graphs from the Zombie Wars
#63 MarkR: You're right, no physical reason, and the polynomial fit isn't enough better than linear to be worth talking about at all -- except that it shows that the apparent flatness is illusory. #64 Ken Lambert: "However assuming that you CO2 component only curves are worth talking about, the temperature anomaly is tracking somewhere between 1.2 and 1.8degC for a doubling of CO2." That number is derived from radiative physics only, so it excludes all feedbacks. The rough estimate from linear regression above includes short-term feedbacks (at least), e.g., water vapor. Which accounts for the difference. -
Bob Lacatena at 02:05 AM on 8 January 2011Understanding the CO2 lag in past climate change
108, lurgee, 109, Albatross, 110, Daniel Bailey I believe the main reason that CO2 levels stay high for thousands of years is that the two scenarios are very different. In today's case, the temperature-stable CO2 level is still 285 ppm, even though we've cranked it up to 390 ppm. 285 ppm is the level that the planet wants to hold CO2 to right now, based on the current mean global temp. We have artificially pumped that up to 390 ppm, not by changing the planet's temperature (the "natural" way) but rather by injecting the CO2 into the atmosphere. But if we abruptly stopped, it would start to fall immediately because the temperature of the planet hasn't caught up. It might take a few hundred years to get down, partly because in the interim the planet would warm, raising that "natural level" above 285 ppm, but it would still fall a lot faster. In the interglacial period case, where levels start at 285 ppm and fall to 190 ppm over thousands of years, it is a very slow cooling/feedback response where the temperature-stable level is slowly reduced. That is, the temperature of the planet is slowly reduced, which reduces the equilibrium CO2 level, which further reduces the temperature. The change in orbital forcing allows winter snow/ice in the northern hemisphere to expand (or, rather, fail to melt all the way back in summer, increasing the extent bit by bit each year). The resulting change in albedo reflects more sunlight, cooling the planet very slightly. As the oceans cool, they absorb more CO2, which cools the planet further, while atmospheric H2O content also drops, cooling things even more. This whole process is very, very slow, taking thousands of years. So in our case, you have a system that has been thrown out of balance/equilibrium, and so will fall back into balance/equilibrium relatively quickly. In the interglacial-to-glacial case (or the opposite, the exiting of a glacial period), you have a very slow acting forcing/feedback response which is changing the equilibrium level itself, bit by bit, and the planet slowly adjusts. They are two completely different cases, and diametrically opposed mechanisms (changing temperatures by abruptly changing CO2 levels, versus changing CO2 levels and temperatures by slowly changing temperatures). And it's all related to the whole CO2-lags-temperature argument. It's in understanding the system as a whole that it makes sense, and moving beyond the overly simplistic CO2-is-a-magic-wand-that-does-this-one-exact-thing approach. -
Daniel Bailey at 02:04 AM on 8 January 2011Understanding the CO2 lag in past climate change
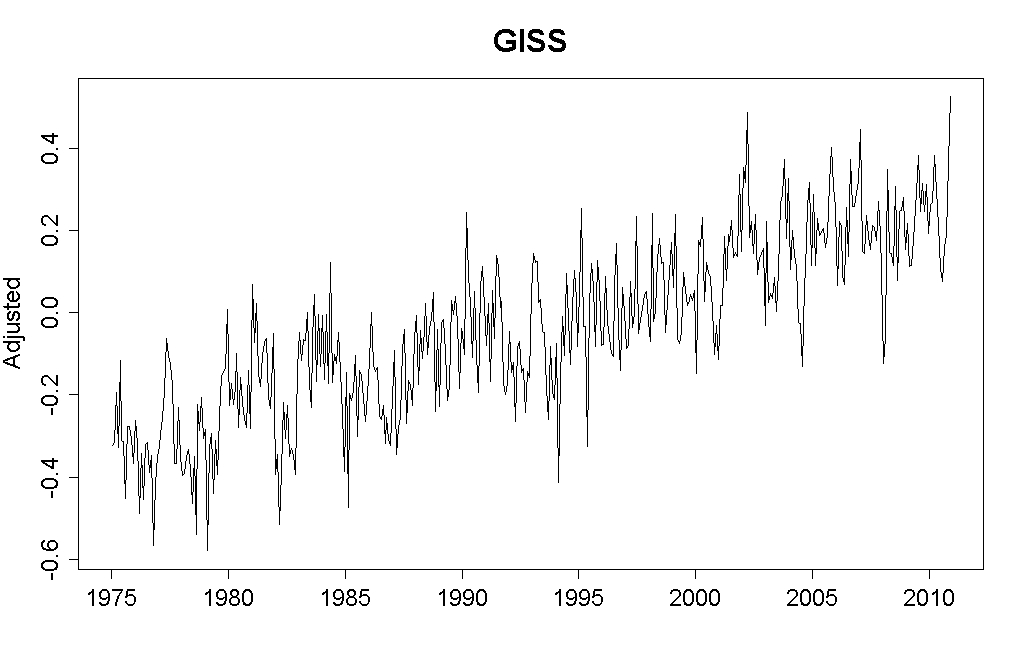
Re: gallopingcamel (116) In order to drive acceptance, your Greenland CO2/temperature research will also have to explain the mass loss we can measure, as shown here: Then you will have to show why this global relationship is no longer valid:
 In addition to that, your proposed understanding will also have to explain the recent melt described here.
In addition, you may want to take a stab at filtering out various cycles, like ENSO, solar and volcanic, as described here and here.
I fear you tilt at windmills. But go for it. Often the only way to truly learn a subject is to roll the sleeves up and get under its hood.
The Yooper
In addition to that, your proposed understanding will also have to explain the recent melt described here.
In addition, you may want to take a stab at filtering out various cycles, like ENSO, solar and volcanic, as described here and here.
I fear you tilt at windmills. But go for it. Often the only way to truly learn a subject is to roll the sleeves up and get under its hood.
The Yooper
-
Ken Lambert at 01:37 AM on 8 January 2011Graphs from the Zombie Wars
Muoncounter #48 Nice job. Humbled that a distinguished contributor such as yourself is naming a law after me. Not bad for a 'zombie'. Of course you are considering only one component of the forcing ie CO2GHG via the log function. I have not found any equations for the WV + Ice Albedo feedback climate response or cloud cooling forcings - and we know that S-B cooling is proportional to T^4. However assuming that you CO2 component only curves are worth talking about, the temperature anomaly is tracking somewhere between 1.2 and 1.8degC for a doubling of CO2. Oft quoted and AGW consensus number is more like 3.0degC for a doubling of CO2 from pre-industrial levels. Since we have already had 0.75-0.8 degC warming since AD1750, this suggests we have 0.4 - 1.0 degC to go at doubling. Not so scary after all. -
Mila at 01:31 AM on 8 January 2011An online resource for the IPCC 4th Assessment Report
#11 1) I plan to work on meaningful citation statistics when 99%+ articles a resolved, there is still a significant work ahead 2) technical problems - as soon as you get to programming web browsers you will always find problems, at least thanks to JQuery it works reasonably on major ones; unfortunately I do not own iPad so I cannot investigate #12 1) to uniquely identify authors would be enormous task, see http://www.orcid.org/ for some fresh development in this area 2) I was thinking of backlinking but as the citation formats vary a lot in texts it would be very time consuming task. I would have to be the author of the IPCC html document to make it easy :) -
gallopingcamel at 01:29 AM on 8 January 2011Understanding the CO2 lag in past climate change
Daniel Bailey, As you point out in your response to my last comment (#100) my data only applies to Greenland. While this is a relatively small region, there is a good correlation between the GISP/GRIP results and Vostok in Antarctica. Also, the GISP2 data clearly shows historic events (Minoan Warm Period etc.) that occurred in lower northern latitudes. I am working on the high latitudes in Russia and Canada. Give me a little time as I do have a day job. -
Alec Cowan at 01:20 AM on 8 January 2011Ice age predicted in the 70s
Maybe first we could wait until thepoodlebites #21 provides more information. By the way, thepoodlebites, were your colleague taught in the same institution? the same grade? can you ask him/her? Not that I think that muoncounter's and snowhare's comments are nothing but excellent, but I think that the first comment would be better once thepoodlebites provide basic information, and the second one is excellent once no information is provided. We have to consider that the success of skepticalscience.com -10% more visitors each month- is going to drive more people of every kind and with that in mind it would be not advisable to engage in debates when incomplete information is provided without first ask the commenter to provide whatever in good faith he or she may have considered unnecessary. -
What's in a Name?
Ville - I believe sout's posting reads much better as a satire: "OTOH if humans were natural, then they would be part of nature and would contribute to forcing along with all the other forces of nature. What a crazy idea!" -
snowhare at 00:59 AM on 8 January 2011Ice age predicted in the 70s
@21 thepoolbites: You've introduced a term I had never heard of before, "instantaneous glaciation", which seemed odd. If you search Google for it there are only 179 matches - two of which are actually links to your usage here. If you search Google Scholar you find only 15 matches, if you search Google Ngrams, it doesn't appear at all. The term is, for all practical intents and purposes, not used. I suspect you are mis-remembering a 30 year old class. Next, the assertion made in this article is that the majority of predictions in the 1970s were for warming, not cooling. That is not a question that an anecdote can answer. The writer demonstrated his thesis - the vast majority of papers in the field from the mid-1960s through the 1970s predicted that warming, not cooling, was in our future. Three to four decades later, it is clear they were absolutely correct. -
muoncounter at 00:49 AM on 8 January 2011Ice age predicted in the 70s
#21: "Nothing about Anthropogenic Global Warming (AGW) being a threat, sorry, I wasn't taught that." Perhaps your university, like many, suffered from a conservative bias among faculty. Some university geology departments taught 'continental foundering' for years as evidence for plate tectonics piled up. That doesn't prove anything about the current state of the science. But the signs were there: Hansen published a paper on warming in 1981; the predictions reflected the early nature of the science, but they were substantially correct. See also this article with links to earlier publications and a link to a video from 1989. -
Alec Cowan at 00:36 AM on 8 January 2011Ice age predicted in the 70s
@thepoodlebites #21 In order it to be complete anecdotal evidence, could you tell the name of the institution you did study at? name of some professors and/or heads of department? name of a couple of books you may have used in the subjects you named, and still keep in your bookshelves? and succinctly what did you do with your degree in meteorology (professionally speaking)? If you want, I can explain why is this very important. Thanks in advance. -
Byron Smith at 00:27 AM on 8 January 2011They changed the name from 'global warming' to 'climate change'
Excellent piece. Thanks once again to Dana for sterling work. -
Byron Smith at 00:10 AM on 8 January 2011A Positive Outlook For Clouds
Thanks Dana - very effective use of diagram. -
thepoodlebites at 23:44 PM on 7 January 2011Ice age predicted in the 70s
I guess this is the correct thread to post my anecdotal evidence. I am really shocked by the display of revisionist history in the "What the science says" section. I have a BS in meteorology, 1979-1982. Some of the classes included physical meteorology, planetary atmospheres, air pollution, taught by both American (one at NASA) and European professors. We were taught that the Earth was in the last phase of an inter-glacial period and through a process called instantaneous glaciation, we could plunge into another ice-age within a few hundred years. We were taught that the runaway greenhouse effect occurred on Venus because the atmosphere never reached saturation vapor pressure and eventually all of the water boiled off into space. Here on Earth we were lucky, water condensed out to form the oceans, stabilizing the climate. Nothing about Anthropogenic Global Warming (AGW) being a threat, sorry, I wasn't taught that. I asked a colleague this morning what he was taught in the 70's and he said the same thing, global cooling. In 1981 I had chance to take a summer class with Dr. James Hansen in planetary atmospheres but didn’t get in, made first alternate. Maybe Dr. Hansen would have introduced me to the concept of AGW but since I could not attend I can’t tell you what he taught in that summer class. -
MarkR at 23:35 PM on 7 January 2011Graphs from the Zombie Wars
@60 Keith: if my accelerating you mean more CO2 means temperatures going faster, there's no good physical reason for that yet afaik. It's probably because this only looks at CO2 forcing and not total forcing. Aerosol's negative forcing hasn't grown as quickly as CO2's has. Assuming that it is negative and not increasingly negative at the same rate that CO2 is increasingly positive, then it would give the illusion of more impact from CO2 and acceleration. -
JMurphy at 23:01 PM on 7 January 2011Understanding the CO2 lag in past climate change
I have referred to apiratelooksat50, and this comment of his on this thread, on another thread about zombies. (Just being polite, in case he thinks I'm doing it behind his back !) -
JMurphy at 22:56 PM on 7 January 2011Graphs from the Zombie Wars
I see that some of the zombie responses that I highlighted above, have re-appeared on another thread ( Understanding the CO2 lag in past climate change), courtesy of a poster called apiratelooksat50 : "...it is far more prudent and cost-effective to adopt a wait-and-see approach than to spend trillions now on what may or may not be a problem." "...it would be necessary to shut down the entire global economy for a decade." "By adopting a wait-and-see approach, we still have plenty of time to address even the worst-case predictions of climate change." Pure zombie-opinion in place of facts or evidence, as usual. But there were a couple of extra zombie arguments also, that I forgot to mention : "Or, we could feed and educate everyone in the world." "Even if global warming becomes a problem, it’s going to be a problem regardless of how much we spend." "Initially I was pro-AGW, but over the years as I've witnessed the shouting down and negative labeling of legitimate scientific inquiry that questioned components of the AGW theory, my position changed. Real science is always open to refutation and revision." You often see the supposed 'concern' for the poor and starving of this world (alongside the false supposition that all problems could be solved, and that the poor and starving wouldn't continue to suffer, if only we spent all that money - money which shouldn't really be spent anyway, as far as the zombies are concerned - on food and education); as well as the shoulder-shrugging, 'so what, we can't do anything about it anyway (even if it is a problem), so why should we bother' attitude; and the 'I used to be convinced about AGW but seeing the horrid attitude to the brave deniers (as I now realise they are), I was convinced otherwise and have disregarded the science in favour of standing with the oppressed and ever-courteous Galileo-like real skeptics like, um, Watts and, er, McIntyre', and some others. Laughable, but bizarre. -
Paul D at 22:22 PM on 7 January 2011What's in a Name?
Further to my comment @25, some of what sout stated was correct. It depends a great deal on the interpretation of the word 'natural'. -
Paul D at 22:08 PM on 7 January 2011What's in a Name?
Sout@23 Your comment is way off topic and couldn't be more wrong. Humans are natural and what they do is natural. Beavers dam rivers, they use knowledge and materials to do that, even if it isn't the same level as humans. Just about everything you wrote in that comment is completely wrong. But this isn't the place to discuss it. -
Anne-Marie Blackburn at 21:28 PM on 7 January 2011What's in a Name?
Ron Crouch But climate change is not happening 'on its own' and it infers nothing - the role of humans in global warming and climate change has been directly observed in changes in Earth's radiation balance. All this in the complete absence of a competing theory - there's no evidence that natural forcing is behind it all. Perhaps Joe Public would have fewer problems keeping abreast if people stopped trying to confuse the issue by making statements that ignore the actual state of knowledge. -
Mike Palin at 21:08 PM on 7 January 2011Graphs from the Zombie Wars
A few days ago I came across a paper provocatively titled “Unskilled and Unaware of It: How Difficulties in Recognizing One’s Own Incompetence Lead to Inflated Self-Assessments" (PDF available here). It received an Ig Noble Prize in 2000 and is definitely worth a look. Some of those doing battle with the Zombies may find it insightful. -
Rob Painting at 21:07 PM on 7 January 2011Understanding the CO2 lag in past climate change
Lurgee - It's always nice to learn things are much worse than previously thought. Just before bedtime and all. Not frightening the horses is generally a good idea, except when said horses (humanity) is galloping (like a camel) directly toward a cliff. -
Anne-Marie Blackburn at 20:56 PM on 7 January 2011Understanding the CO2 lag in past climate change
gallopingcamel I don't think anyone has ever said that CO2 was the only factor affecting temperatures. You could also have mentioned the mid-20th-century cooling to make your point, for example. The thing with global warming is that it can lead to changes in wind and precipitation patterns, which is why some phenomena that can be perceived as counter-intuitive have been observed - such as changes in precipitation patterns leading to some glaciers growing despite warmer temperatures. In terms of possible outcomes, a warming world could lead to the disruption of the North Atlantic conveyor belt, which would lead to cooling in some regions of Europe. This is why scientists look at long-term trends in global average temperatures, rather than what is happening at a regional level, when assessing the effects of CO2 on Earth's temperatures - as Daniel has already pointed out. Regional responses to a CO2 increase will vary according to a number of variables which affect the climate of any given region, but this in no way suggests that CO2 is not the main factor driving temperature changes at a global level. -
lurgee at 20:55 PM on 7 January 2011Understanding the CO2 lag in past climate change
It's always nice to learn things are much worse than previously thought. Just before bedtime and all. -
Alec Cowan at 20:40 PM on 7 January 2011Understanding the CO2 lag in past climate change
@gallopingcamel In spite of your introductory fanfare "One would expect to find temperature trends magnified at high latitudes, so I have concentrated on high latitudes in the northern hemisphere." giving to it all the adornment of a legitimate intend to understand, cherry picking is still cherry picking in the end. Readers can see in this site every day attempts like that to supposedly substantiate or call attention on trends or lack of them through pruning a dataset of selecting an area. Just to cite one the most recent attempts, this one. Why don't you take a look to the other comment and try to deduct a trend from both? Later, I will suggest a third one, a forth, and on and on. -
JMurphy at 20:19 PM on 7 January 2011We're heading into cooling
Does cruzn246 pop up every time it's cold outside where he lives ? Perhaps he should look up the difference between 'weather' and 'climate' and actually check some temperature records, rather than relying on what can be read in the Denialosphere. -
Daniel Bailey at 19:09 PM on 7 January 2011Understanding the CO2 lag in past climate change
Re: lurgee (108)"If I may ask a further question, stemming from what DB posted (genuine, I assure you), if it takes thousands of years for CO2 to be sequestered, does this mean the current CO2 levels will persist for a similar period? I had been under the impression CO2 hung about for a couple of hundred years - which might explain my looking askance at the ice cores."
An excellent question. Skeptical science has examined this previously in posts here and here. RealClimate has examined this many times, most recently here and here. An RC post examining the lag between CO2 and temps is here. Wiki provides a usable synopsis:"Carbon dioxide has a variable atmospheric lifetime, and cannot be specified precisely.[60] Recent work indicates that recovery from a large input of atmospheric CO2 from burning fossil fuels will result in an effective lifetime of tens of thousands of years.[61][62]"
The references are found here and here. That's assuming we manage to curb our addiction to CO2 soon. As it stands now, we have (likely) effectively put off the onset of at least the next round of glaciation. The Yooper -
Albatross at 18:55 PM on 7 January 2011Understanding the CO2 lag in past climate change
Lurgee @108, "if it takes thousands of years for CO2 to be sequestered, does this mean the current CO2 levels will persist for a similar period? I had been under the impression CO2 hung about for a couple of hundred years - which might explain my looking askance at the ice cores." The short answer to your question is yes, probably. A more detailed discussion is provided here, and that thread is probably the most suitable location to discuss this particular matter further.Moderator Response: [Daniel Bailey] You type fast. I am jealous.
-
lurgee at 18:20 PM on 7 January 2011Understanding the CO2 lag in past climate change
I agree there has been a bit of avoidable fuming on all sides. With regards DB's earlier post, thank you for drawing my attention to it. I'd missed that in the strum und drang I unwittingly unleashed. If I may ask a further question, stemming from what DB posted (genuine, I assure you), if it takes thousands of years for CO2 to be sequestered, does this mean the current CO2 levels will persist for a similar period? I had been under the impression CO2 hung about for a couple of hundred years - which might explain my looking askance at the ice cores. Without wanting to jeopardise the fragile harmony, with regards the Eric Steig piece, I didn't intend to present his comments as a peer reviewed piece (though putting the year of publication was probably a BIT thoughtless). But - unless Steig's speech was intended as a comedy turn at the workshop - I'd say it was an accurate reflection of his professional opinions. And, of course, it referenced several other sources. -
keithpickering at 18:10 PM on 7 January 2011Graphs from the Zombie Wars
@garythompson: I think I see what you're looking at, but it's an optical illusion. Two ways to check: first, plot the graph with axes switched, like this: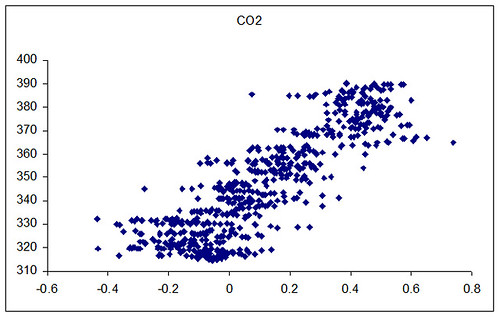 ... and any "flatness" should become verticality, which is not evident to my eye.
More formally, check to see if the linear regression fit is improved by a polynomial fit. In this case, it isn't much improved ... but more importantly, the best 2-order polynomial fit is actually concave upward, i.e., the curve is accelerating rather than decelerating.
... and any "flatness" should become verticality, which is not evident to my eye.
More formally, check to see if the linear regression fit is improved by a polynomial fit. In this case, it isn't much improved ... but more importantly, the best 2-order polynomial fit is actually concave upward, i.e., the curve is accelerating rather than decelerating.
-
gallopingcamel at 17:59 PM on 7 January 2011Graphs from the Zombie Wars
While I disagree with your conclusions you did a magnificent job with this post. -
Albatross at 17:53 PM on 7 January 2011Understanding the CO2 lag in past climate change
Hi Daniel, Many thanks for providing the link above and for confirming that I am a scientist. However, just to clarify, although I have a strong background in various aspects of meteorology and have obviously studied climate over the years, I am not a climate scientist in the traditional definition and am currently not actively publishing in that particular field-- although some of my recent research may have applications in climate science. I know, clear as mud, but I'm really tired. -
garythompson at 17:04 PM on 7 January 2011Graphs from the Zombie Wars
well, that didn't work either. i'm sorry about cluttering your site up. please delete the other posts too. ugh!Moderator Response: [Daniel Bailey] You are almost there. Try linking to a PNG or other graphics file instead of a PDF (PDF's will not link as a visual graphic in a SkS comment window).
Prev 1974 1975 1976 1977 1978 1979 1980 1981 1982 1983 1984 1985 1986 1987 1988 1989 Next


