


 Arguments


Recent Comments
Prev 191 192 193 194 195 196 197 198 199 200 201 202 203 204 205 206 Next
Comments 9901 to 9950:
-
TVC15 at 10:39 AM on 23 July 2019Climate's changed before
Also is this accurate?
Antarctica was warmer 1,000 years ago, long before the industrial revolution and before there has been an increase in CO2 attributed to man.
-
Bob Loblaw at 10:38 AM on 23 July 20192019 SkS Weekly Climate Change & Global Warming News Roundup #27
Just in case billev still misses out on the roles radiation and convective mixing play in atmospheric temperature profiles, he might want to look at this old thread. In particular, the diagram I show that compares what the temperature profile would look likein a purely radiative equilibrium, contrasted with at atmosphere with convection.
https://skepticalscience.com/argument.php?p=23&t=1114&&a=164#69161
-
Bob Loblaw at 10:33 AM on 23 July 20192019 SkS Weekly Climate Change & Global Warming News Roundup #27
Billev then goes on (comment #13) to attribute the decrease in atmospheric temperature with height as being the result of distance from the heat source.
Not true. Billev seems unaware of (or not remembering) the universal gas law, which relates temperature, volume and pressure of gases. He needs to find an elementary meteorology text that can explain adiabatic cooling to him, so he can understand what happens to rising air. (HInt: pressure also decreases with height...)
If billev was correct, then the stratosphere would be even colder than the troposphere. It isn't. If billev were to look at his entire U.S Standard Atmosphere, he would see that this is the case. Why is the stratosphere warmer? That pesky radiation absorption again (UV, this time).
-
TVC15 at 10:27 AM on 23 July 2019Climate's changed before
Thank you so much Daniel Bailey!
A denier is claming these things:
The irrefutable scientific evidence is that Earth is always warmer and wetter, never warmer and drier. That will increase the amount of arable land and also increase food production. That's good news for farmers in foreign States, but not good news for American farmers who will have difficulty competing globally.
The irrefutable scientific evidence also shows that in all 8 recorded Inter-Glacial Periods, the sea levels rose 3 meters to as much as 14 meters, even when CO2 levels were 260 ppm to 280 ppm CO2.
So, whether CO2 levels are 260 ppm or 400 ppm makes no difference, because the sea levels are going to rise 3 meters to 14 meters no matter what happens.
Are these claims accurate?
-
Bob Loblaw at 10:21 AM on 23 July 20192019 SkS Weekly Climate Change & Global Warming News Roundup #27
It's sad when someone makes confident, broad, sweeping statements that are pretty much completely wrong, such as those from billev in this thread.
Starting with comment #7, billev bascially makes the "CO2 is a trace gas" argument, which is debunked here.To further elaborate on why this is a bogus argument, let's consider a few aspects of radiation transfer:
- The absorption of radiation is, with minor secondary effects, solely a function of how much of the absorbing material there is between the radiation source and the detection point. A thin, compressed layer is no different than a a wide, dispersed layer.
- Filling the space between the widely-dispersed absorber with other materials that have no radiative effects will not change how much radiation is aborbed by the absorber. Dilution is irrelevant, to a first (and probably second) approximation. (Eventually, pressure does start to play a role, well-known by radiation modellers.)
- Expressing CO2 as a fraction of the abundant inert atmospheric gases is just plain wrong, when it comes to calculating radiation transfer.
Let's do a thought experiment.
- Consider a plate of perfectly clear glass, 1mm think. Light (AKA radiation) passes through completely.
- We then coat one side of the plate with a 0.1mm thick layer of something that absorbs visible light. The light trasmitted through the plate is reduced. (How much depends on the properties of that material.)
- If we mix that 0.1mm coating into the clear glass, dispersed evenly across the 1mm thickness (well, let's assume it is now 1.1mm thick), the effect on light transmission will not be changed.
- If we put that 0.1mm absorbing layer on a 10mm thick plate of clear glass, the effect is the same as it was on the 1mm plate.
- If we put that 0.1mm absorbing layer on a 100mm thick plate of clear glass, the effect is the same as it was on the 1mm plate.
- If we disperse that 0.1mm of absorbing material across a 1000mm plate of glass, the effect is still the same.
- The ratio of absorbing material to clear glass plate is irrelevant.
Billev needs to learn more about radiation transfer.
-
Bob Loblaw at 09:54 AM on 23 July 2019Postma disproved the greenhouse effect
Dear Nhqjo5kgDyNtNJLX683t:
This has come up recently on this thread:
https://skepticalscience.com/argument.php?a=18&p=26#132128
Radiation in or out of a horizontal surface is expressed as W/m2 (flux density) because douibling the area doibles the energy involved. Yes a Watt is a Joule per second - you get a total in Joules if you sum over time.
The division by four is correct, though: IR is emitted vertically, i.e., perpendicular to the earth's surface. To get total IR in Joules you multiply by the entire earth's surface (4*pi*r3).
Solar radiation is not received vertically at all points on the earth's surface, though. In fact, at any instant in time, there is only one location on earth where the sun is directly overhead. Everywhere else, the sun's rays strike at an oblique angle. The solar intenstity, as measured per unit area of the earth's surface, is reduced according to the cosine law - by a factor of 1/cos(z), where z is the angle between the sun's rays and the local vertical.
If you like calculuis, you could integerate the 1/cos(z) relationship over the entire surface. If you prefer trignonometry, the total sunlight received by the earth is proprtiional to the area of a circle of radius r - area=pi*r2.
The ratio of the two is 1/4, not 1/2.
To visualize the sun's reduced intensity, imaging trying to read a book by candlelight. You can probably manage if you hold the book perpendicular to the light coming from the candle, but as you turn the book obliquely, the light intercepted by the book's page will decrease. By the time the page is parallel to the candle's beam, the page captures no light at all. Think of the sun the same way" at sunrise or sunset, a book lying horizontally gets no direct sunlight at all - only the skylight.
-
Nhqjo5kgDyNtNJLX683tv at 08:10 AM on 23 July 2019Postma disproved the greenhouse effect
How can the watts per meter squared by divided by four when watts are a measure of energy per second (related to joules)? If the area is increased from one meter to the whole earth then the time interval must be increased to one whole day. If one wishes to know how much the whole earth receives from the Sun in one second then one should divide by two. Because the area of a sphere is 4 pi r^2, and one hemisphere is 2 pi r^2 the solar input averaged over the whole Earth would be half that of one hemisphere and not divisible by four. Then, what justification is there for dividing the watts per meter squared by four? If the light is treated as if spread (due to the curvature) from one cross section to twice that area on one hemisphere it is (to use Postma's word) "diluted" by 2 and not by four.
-
MA Rodger at 06:15 AM on 23 July 2019Models are unreliable
rupisnark @1117/1118,
In reverse order.
1118
♣ "Your website ... already do(es) that job." Firstly, SkS is not my website. Secondly, SkS addresses distortions that are prediminantly of 'denialist' origin, not "non-denialist". The non-denialist distortions would be a more interesting subject, if you know of any.
♣ Whether you have the time to cope with all the nonsense served up by Christy, or not. We haven't got very far with the content of this Christy talk in more than one iteration. And there is the question of whether I (or others) could be fussed to continue untangling the garbage fo you into chunks you will understand.
♣ NINO1+2 & NINO3. Note these Sea Surface temperatures (which C&M 2017 appears to say it uses to subtract ENSO from its TLT record) are not de-trended (as for instance the AMO is) so they do still have an AGW signal. Subtracting the NINO signals will thus also subtract some AGW signal.
♣ Does C&M(1994) repeat the method of C&M(2017)? The implication is that it does (note that I have not access to C&M1994) but one difference is the UAH TLT v5.6 record was not used in 1994 as it didn't exist. The corrections to the UAH data set (mainly not the result of work by the UAH team) would have made significant changes to the 1994 result. So it is strange that C&M(2017) only finds a very small difference.
♣ Christy was one of six lead authors of Chapter 2 of IPOCC WG1 TAR (1990). Note the prmary finding of that chapter "The warming rate since 1976, 0.17°C/decade." This contradicts the primary finding of both C&M(1994) and C&M(2017).
♣ The GWPF are anti-scientific to the point of being bare-faced liars. I will be happy to demonstrate that fact if you are interested. If Christy is happy to give the GWPF the time of day, he will get no respect from me!!!
1117
♣ Have you understood correctly? What we can call Slide 1 of Christy (2019) is saying AGW is trivial to the point of insignificance. That is not borne out by the science. And denying the energy imbalance is pretty unforgiveable. You bat the "~750 Million Units" into the long grass but there is also the "6 trillion" which is part of the talk transcript While the 750M quantity could be considered as the rough total (that's total as in down to absolute zero) heat content of the atmosphere per sq metre of the planet, the 6T quantity would be 80 times more than the equivalent for the oceans (which are usually considered the largest thermal pool the climate has to cope with). So what the 6T quantity is supposed to be, I know not. I assume it is just meant to appear very very big.
♣ Slide 1 of Christy (2019) says it takes the values from AR5 Fig 2.11. It is Christy's comparison, not mine. -
rupisnark at 00:15 AM on 23 July 2019Models are unreliable
MA Rodgers @ 1116
Using terms like “climate change denial” does not help my understanding of what is going on, instead it undermines my trust in the people who use the term. I started out with the view that the consensus was probably right about global warming happening and being man-made, but that the solutions so far implemented and being proposed were not terribly good and, in my cases, counterproductive. The tone of this website should be to encourage questions and let people work out for themselves whether people like Christy know what they are talking about or not. “I bring a hum-dinger of climate change denial.” Throwing mud at a former IPCC lead author is more likely to bring into question the whole IPCC process than to make people reject arguments without understanding the issues.
“Christy & McNider (2017) attempts to expunge ENSO & volcanic effects from the UAH TLT satellite temperature record but in doing so also manage to expunge much of the warming signal of AGW.”
Does this paper follow the same methods that they used in 1994? Was Christy trying in 1994 to argue that Global Warming was not occurring (or was occurring at a lower rate)? Did the 1994 paper suggest this?
“Certainly their use of NINO1+2 and NINO3 as an ENSOsignal is one possible cause as these two SST series do contain an AGW signal.”
I do not understand this. Please give me the appropriate background reading and I will get up to speed on it.
“I could continue down the many arguments he makes but how long have you got?” I will look at all the arguments you put up.
And if you wish to check out "distortions of information from both sides", perhaps addressing the apparent distortions on the other non-denialist "side" would be a better appraoch.
Your website and many others already do that job.Moderator Response:[RH] I hope you don't mind, I added line breaks between your paragraphs to make them a little easier to read. Thx.
-
rupisnark at 00:15 AM on 23 July 2019Models are unreliable
MA Rodgers @1113
The substantive criticism you made was relating to the his first graphic. You compare that to the linked graphic. The two appear to me to be saying similar things (but see below), at first glance Christy’s is simpler to read (which would make sense as it was based on a talk to laymen); the use of units puts numbers into percentage terms which makes everything simpler. Since the 750 million units is not mentioned in the text, it seems irrelevant to spend time making conjectures over what you or I think it might mean. I may try to contact Christy or GWPF to understand if it seems important later (not sure if I will get any answers).
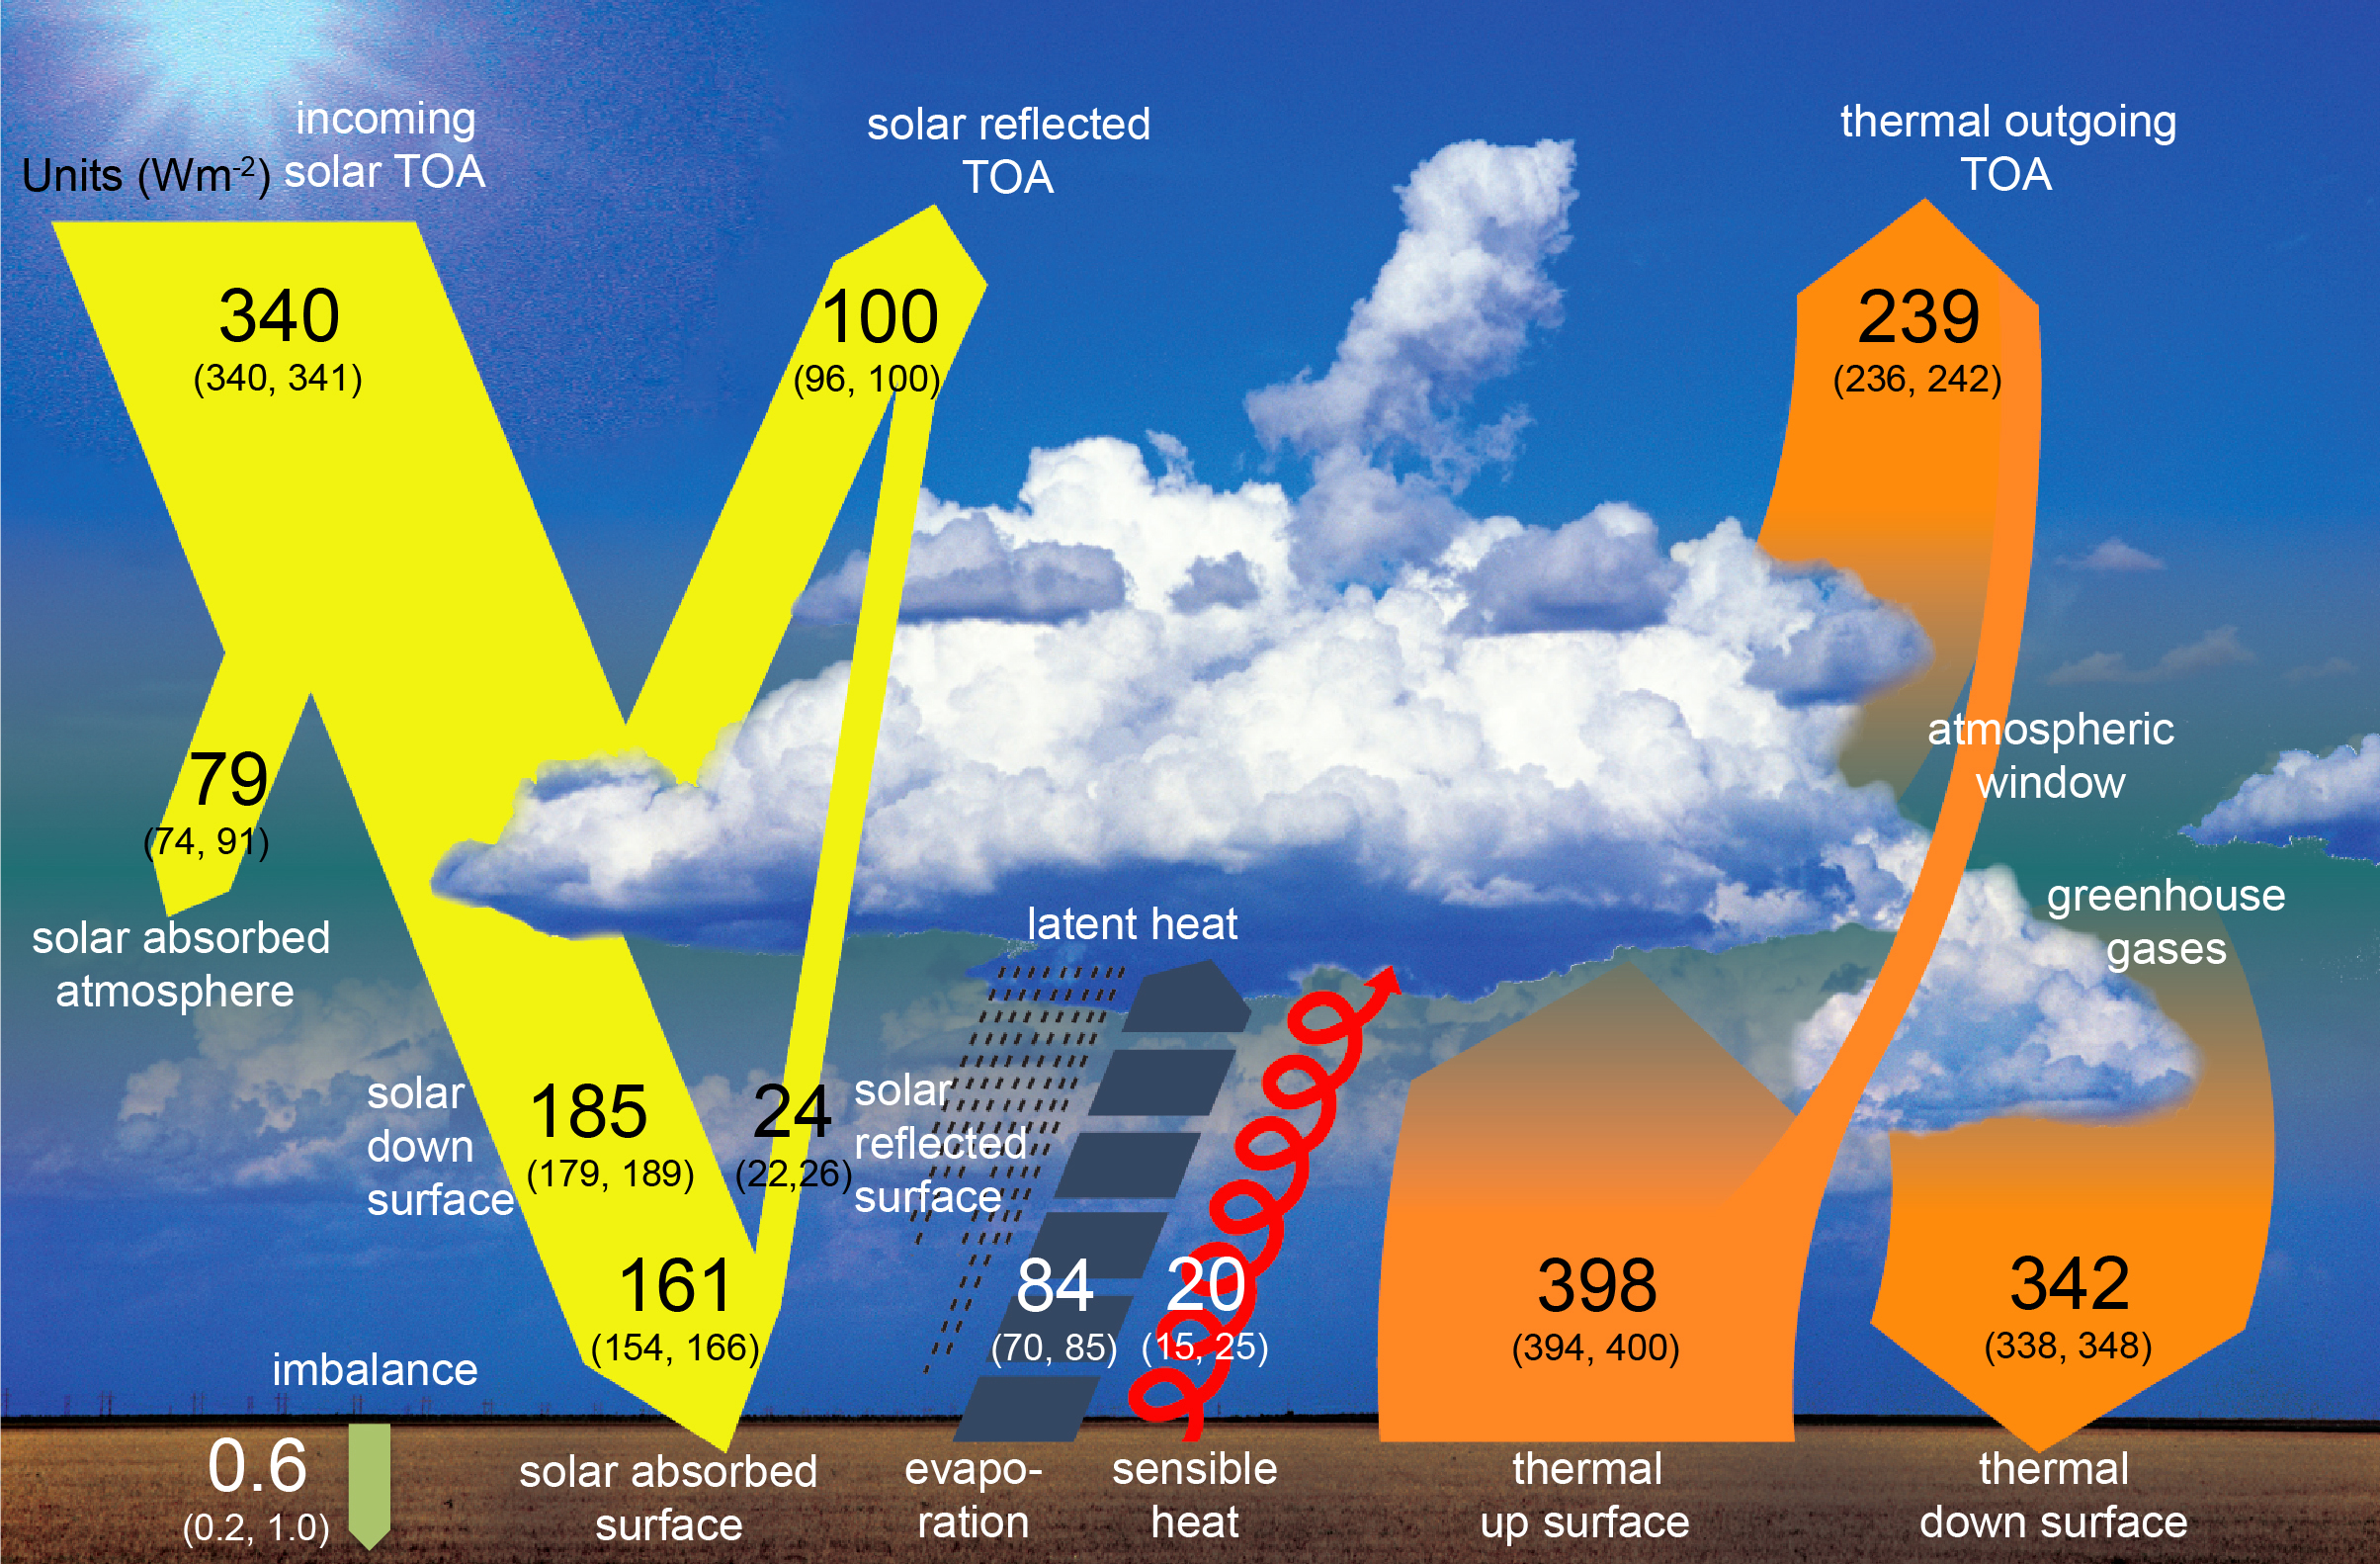
Then there are the issues that are worth discussing. The imbalance of 0.6W/m2 (0.18 units?), the statement that at the surface it is in balance, and the claim that 0.5 units is caused by extra CO2 whereas 100 units is caused by H20, clouds and aerosols (and not mentioned but presumably also existing CO2). Have I understood this correctly? What are the errors in what Christy has said?Moderator Response:[RH] Same.
-
Rob Honeycutt at 23:56 PM on 22 July 2019IPCC is alarmist
Take note that these are very large reports that take years to compile, write, and publish. Thus, the latest research will be several years prior to the published date of the final report.
-
MA Rodger at 21:53 PM on 22 July 2019Models are unreliable
rupisnark @1114,
You must forgive me my intolerance of those in the scientific & political community that remain imprisoned in climate change denial. Yet you do bring a real humdinger of climate change denial here for comment. Christy makes many many 'points' in that GWPF talk and he is pretty-much wrong it all of it.
I could continue down the many arguments he makes but how long have you got?
Consider the second point (The nonsense of the first point I dealt with up-thread @1113.), the graphic "What's happening at the surface?"
This second graphic shows a very small "Extra CO2" effect. This likely makes sense only if this tiny box represents the imbalance in the surface energy flux which is causing AGW. If it is meant to represent the impact of the AGW-induced warming, the box should be roughly the size of the cooling "Heat Flux" box and also have a cooling box the same size to balance.
The second graphic as-presented is scientific nonsense. But as that is really only repeating the incompetence of the first graphic, perhaps I should consider the third argument set out by Christy.
So graphic number three which makes sense to also consider graphic number four. This bring quite a lot of stuff into the discussion - Christy & McNider (1994) and Christy & McNider (2017) as well as Hansen et al (1998). But without getting too deep into all this, the bottom line is that Christy makes two crazy mistakes. Firstly Christy grossly misprepresents Hansen et al (1988) both in his GWPF talk and in Christy & McNider (1994). Hansen et al did not predict a +0.35ºC/decade temperature trend as Christy states (see this SkS post). Secondly Christy & McNider (2017) attempts to expunge ENSO & volcanic effects from the UAH TLT satellite temperature record but in doing so also manage to expunge much of the warming signal of AGW. Thus a trend of +0.16ºC/decade in UAH v5.6 is converted into +0.095ºC/decade. Exactly how Christy & McNider achieve this would require some detailed analysis. Certainly their use of NINO1+2 and NINO3 as an ENSO signal is one possible cause as these two SST series do contain an AGW signal.
---
Certainly I would concede nothing regarding Christy's work without first checking it out. His work is totally untrustwothy.
And if you wish to check out "distortions of information from both sides", perhaps addressing the apparent distortions on the other non-denialist "side" would be a better appraoch.
-
michael sweet at 21:21 PM on 22 July 2019IPCC is alarmist
Cozumelito:
From the title page of the report you cite:
"This chapter should be cited as:
Seneviratne, S.I., N. Nicholls, D. Easterling, C.M. Goodess, S. Kanae, J. Kossin, Y. Luo, J. Marengo, K. McInnes, M. Rahimi,
M. Reichstein, A. Sorteberg, C. Vera, and X. Zhang, 2012:" my emphasis -
michael sweet at 21:16 PM on 22 July 2019Models are unreliable
Rupisnark:
John Christy and his scientific positions were discussed at Skeptical Science in 2011 here. His position has not changed since then.
I note that the globe has warmed sigificantly since 2011 in contradiction to Christy's position.
-
cozumelito at 20:47 PM on 22 July 2019IPCC is alarmist
I've downloaded the 2018 IPCC report
Changes in Climate Extremes and their Impacts on the Natural Physical Environment https://www.ipcc.ch/site/assets/uploads/2018/03/SREX-Chap3_FINAL-1.pdf
I've perused the References section and I can find no research that takes place later than 2011. I guess there's a possibility the report is for 2013 but the link indicates that it's 2018 (No explicit mention of the date of the report in the text. Why?)
If in fact it's 2018, why the delay in examining research?
-
rupisnark at 19:06 PM on 22 July 2019Models are unreliable
MA Rodger @1113. I am trying to work out for myself the truth and have little time for personal attacks. You may not like Christy's opinions but he was a lead author on one of chapters of one of the previous IPCC reports and has a distinguished academic record. He has doen imprtant work in relation to satellite data and worked to correct errors that he admitted he made. Are lead authors of IPCC reports not to be trusted? He may be wrong, but please stick to evidence not personal attacks.
I will review in detail the criticisms of the points you have made. I would like to understand which of his points you are willing to conceed, where he is exaggerating and where he is downright wrong.
My limited study so far has found distortions of information from both sides. Please help me to ascertain whether the distortions come from both sides equally or 90% from one side.
-
MA Rodger at 18:59 PM on 22 July 20192019 SkS Weekly Climate Change & Global Warming News Roundup #27
It is interesting that the lapse rate is being wielded by billev @13 as in some way a proof of the absence of a greenhouse effect.
"The Table of U.S. Standard Atmosphere Heights and Temperatures shows a uniform loss of temperature for each one thousand feet of height from the Earth's surface beginning at the surface. This would appear to show that the only determinant of the heat loss from the Earth's surface is the distance from the surface."
The atmosphere is, of course, effectively static vertically, with the air rising at the equator in the Hadley Cells and taking over a week to rise from the surface to the top of the atmosphere (tropopause). This slow movement prevents large levels of global cooling through convection and the reason it is so slow is because the atmosphere is very much in balance. As the air rises it expands with decreasing pressure and thus cools. The process is so leasurely because it is so close to being an adiabatic expansion. The Lapse Rate that billev @13 describes as disproving the greenhouse effect is in truth an essential part of the insulation process, holding the atmosphere in place so it can act like a greenhouse.
Ironically, the role of the lapse rate in preventing heat loss is exactly like that polyurethane foam that hold air in place against hot water pipes, the previous argument cited by billev @10.
-
nigelj at 18:06 PM on 22 July 20192019 SkS Weekly Climate Change & Global Warming Digest #29
Regarding "New sun-driven cooling period of Earth ‘not far off’, Alan Jones interviews Nils Axel-Mörner, Sky News Australia, June 2019"
More rubbish from the climate denialist Morner. Reading this article Nils Axel Morner makes some astonishing claims about climate change, I mean he doesn't hold back. Its hard to reconcile somebody who is apparently talented with maths and physics making such outrageous and nonsensical and easily rebuted claims. Perhaps he does it to fulfill some strange inner need.
This is interesting and amusing: How not to take on climate change deniers.
-
michael sweet at 16:00 PM on 22 July 20192019 SkS Weekly Climate Change & Global Warming News Roundup #27
Billev:
This video demonstrates how ink at 280 ppm in water visibly is much darker than pure water. 390 ppm is visibly darker htan 280 ppm. Your claim that 400 ppm CO2 insignificantly effects that absrbtion of IR light in the atmosphere compared to 380 ppm is demonstrated to be incorrect.
-
scaddenp at 12:55 PM on 22 July 20192019 SkS Weekly Climate Change & Global Warming News Roundup #27
And our point, is that if you stop convective heat losses, then air is a very adequate insulator for your heat pipes but that has nothing to do with the radiative properties.
You are making assertion "isn't enough of it in the atmosphere to measureably effect the loss of heat from the Earth's surface as distance from that surface increases." which is demonstrably false. See paper on how it observed. You are not understanding how the GHE works and drawing invalid conclusions from things like the laspe rate. Temperature drop with altitude till the tropopause. The lapse rate is pretty much ideal gas law - as pressure drops so does temperature. However, the effect of adding GHGs raises the tropopause. See here for considerably more detail on why.
See here for observations of change in tropopause height, and here looks to be further validation this year.
-
Rob Honeycutt at 12:07 PM on 22 July 20192019 SkS Weekly Climate Change & Global Warming News Roundup #27
billev... It seems to me that you're starting from an assumption that there is no effect and are attempting to position arguments that you think confirm that conclusion. That's motivated reasoning, or confirmation bias.
You have to understand that this basic science regarding CO2's effect on the Earth's temperature has been understood pretty much since the 1850's. Without some form of additional radiative effect in the atmosphere our planet would have a surface temperature 33°C colder than it is. Thus there has to be a radiative effect related to various atmospheric gases.
John Tyndall did the experiments in the 1850's to show which gases have these properties. Nitrogen? Nope. Oxygen? Nope. Argon? Nope. CO2? Yep. Methane? Yep. Water vapor? Yep.
Even though these gases are small in concentration, their affect on the surface temperature is significant.
-
billev at 11:04 AM on 22 July 20192019 SkS Weekly Climate Change & Global Warming News Roundup #27
My point is that without insulation the air is an insufficient barrier to excessive heat loss. My larger point is that regardless of CO2's properties there isn't enough of it in the atmosphere to measureably effect the loss of heat from the Earth's surface as distance from that surface increases. The Table of U.S. Standard Atmosphere Heights and Temperatures shows a uniform loss of temperature for each one thousand feet of height from the Earth's surface beginning at the surface. This would appear to show that the only determinant of the heat loss from the Earth's surface is the distance from the surface.
-
scaddenp at 09:29 AM on 22 July 20192019 SkS Weekly Climate Change & Global Warming News Roundup #27
If you didnt have the air enclosed in something (eg the foam cells or the fibre of wool etc), then you would have convective transfer of heat away from pipes, which is the more effective than conductive or radiative transfer. Air has very low conductivity and so limits conductive energy transport from your pipes.The GHE affects radiative transport and would not have a measurable effect in the thickness of the lagging. Foil is used as well to reduce radiative losses from your pipe.
If you need a primer of energy transfer, try here.
-
MA Rodger at 08:50 AM on 22 July 20192019 SkS Weekly Climate Change & Global Warming News Roundup #27
billev @10,
And any self-respecting engineer will tell you that hot water pipes are indeed encased in air to better insulate them. The air is held in place by such materials as a polyurethane foam which being filled with a matrix of air has perhaps ten-times greater an insulating effect than does solid polyurethane.
-
billev at 07:23 AM on 22 July 20192019 SkS Weekly Climate Change & Global Warming News Roundup #27
And that's why engineers use the surrounding air to retain the heat in hot water pipes, right?
-
scaddenp at 07:23 AM on 22 July 20192019 SkS Weekly Climate Change & Global Warming News Roundup #27
billev - you can directly measure the effect of changing the CO2 content. eg
here. One thing for sure, arguing from Personal Incredulity and ignorance of the physics does not beat direct measurement in science. It is hard to understand what you are trying to achieve by posting demonstably false statements here (and offtopic at that). -
MA Rodger at 04:03 AM on 22 July 2019Models are unreliable
rupisnark @1112,
A first indication that there will be a great many "errors" is the author of this talk you ask about. John Christy is not known for presenting factual accounts of AGW. And a second indication is the audience. The GWPF is allegedly a UK-based educational charity but they fell foul of the UK Charity Commission and now all the really dodgy stuff is posted, as is this talk, by the 'Forum' rather than the 'Foundation' (although dodgy stuff predominated on both).
I would say that John Cristy's GWPF talk is an untrustworthy account from beginning to end. As it runs to over 7,000 words I will address just the beginning and the end. He parting comments are saying that some doomy predictions from 1970 which proved to be entirely wrong mean that all doomy predictions are wrong. I hope the logical fallacy in such an argument is obvious.
And his first graphic is also shot through with nonsense. Christy tries to make AGW appear insignificant by saying that the effect of CO2 is only 0.5 'units' within a diagram showing energy fluxes measured in very large numbers of 'units'. Yet, even though Christy is simply adapting an IPCC AR5 graphic, he still manages to make some fundamental scientific errors. This is not unusual with John Christy.
Perhaps most profound is his assertion that the energy fluxes balance at the surface which is not true on Planet Earth, as the IPCC graphic makes plain.
Another scientific howler in this first graphic is his annotation "Atmosphere (~750 million units)". He presummably means to say that the atmosphere contains 750 million x 3.4 = 2,550 million joules of thermal energy per square but he is saying watts per square metre which simple jibberish. The atmosphere's thermal energy is roughly something like 2,550 million j/sq m and with the 0.5 'units' from "extra CO2", Christy tries to show the impact of CO2 as being insignificant ("small numbers" as he calls it). But 0.5 'units' would amount to 0.5 x 3.4 x 8766 x 3600 = 54 million j/sq m in a single year. It would take a bit of a fool to dismiss this as "small numbers", but then we are talking about John Christy.
-
John Hartz at 02:15 AM on 22 July 2019Antarctica is gaining ice
Recommended supplemental reading:
‘Extraordinary thinning’ of ice sheets revealed deep inside Antarctica by Damian Carrington, Environment, Guardian, May 16, 2019
Antarctic instability 'is spreading' by Jonathan Amos, Science & Environment, BBC News, May 16, 2019
Precipitous' fall in Antarctic sea ice since 2014 revealed by Damian Carrington, Environment, Guardian, July 1, 2019
Glacial melting in Antarctica may become irreversible by Adam Morton, Environment, Guardian, July 9, 2019
-
Rob Honeycutt at 01:01 AM on 22 July 201910 things a committed U.S. President and Congress could do about climate change
I think it's worth noting that going vegan, in and of itself, doesn't actually eliminate CO2. It certainly reduces emissions but you still have to consume the same number of calories and, currently, all types of agriculture produce carbon emissions. It's an improvement, not a panacea.
-
Rob Honeycutt at 00:44 AM on 22 July 20192019 SkS Weekly Climate Change & Global Warming News Roundup #27
billev... Think about it this way:
Distribute one cubic foot of CO2 over 2400 cubic feet, stacked vertically. Then consider how high the troposphere is, which averages out to about 45,000 feet. You end up with stacks of 2400 cubes done 18.75 times to reach the tropopause.
Now, do a thought experiment, a la Einstein. Imagine you're riding on a single photon of IR energy emitted from the Earth's surface traveling up through those 45,000 cubic feet of atmosphere.
What are the chances you will encounter a molecule of CO2? ...Close to 100%.
What happens when IR encounters CO2? The energy is absorbed and then re-emitted in all directions, where that IR again encounters CO2, is again absorbed and re-emitted. Some energy makes its way back to the surface, adding more heat to the surface, while some eventually makes its way out to space.
It's kind of like a giant pinball machine where the pinball is IR and the bumpers are CO2. The more bumpers you have the longer the ball is going to stay in play.
-
rupisnark at 23:18 PM on 21 July 2019Models are unreliable
As someone new to this site and still in the early stages of reviewing the issues, I would be greatful if someone could explain in detail where the errors in this talk by Dr J Christy are (if any).
https://www.thegwpf.com/putting-climate-change-claims-to-the-test/
Moderator Response:[RH] Activated link.
-
MA Rodger at 21:31 PM on 21 July 2019Antarctica is gaining ice
icowrich @492,
GRACE did show a loss of Antarctic ice mass 2002-16 as the NASA graphic below illustrates. We all await the GRACE-FO data (which should soon start appearing here). The numbers are now being published (here) but so far only in a form that will require a bit of processing to show the sort of data graphed out below.
Note this is all land ice. Sea ice floats so is invisible to GRACE.

The work by Zwally (that I know of) also did not concern Antarctic Sea Ice, Sea Ice Extent or otherwise. Mind, satellite data did show a small increase 1979-2015 in Antarctic Sea Ice Extent but that dramatically turned into a decrease 2015-17 - as graphed here - (usually 2 clicks to 'download your attachment').
Zwally et al (2015) concerned analysis of the land ice and the altitude of the ice surface. This showed an increase in altitude suggesting an increase in ice mass. The controversy revolved around levels of snowfall and the process of snow-compaction-into-ice as well as canculation of data uncertainties. It had some merit but obviously the GRACE data is a very strong counter-argument which makes the controversy more academic than a battle over results.
-
icowrich at 20:32 PM on 21 July 2019Antarctica is gaining ice
My understanding is that the GRACE satellite shows that Antarctica was been losing mass throughout the years during which Zwally showed increases in sea ice extent. Since ice extent is a 2D measure, it can't acocunt for ice thickness the way GRACE gravity wave measurements can.
I'm not sure where to find the newest data from GRACE-FO, which llaunched in May, 2018 (I couldn't interpret it, anyway), but I am interested to see how the continent's mass has changed in recent years. -
Daniel Bailey at 08:06 AM on 21 July 201910 things a committed U.S. President and Congress could do about climate change
Because animal agriculture isn't the #1 problem. Read this post for edification and place any related comments on that topic there, not here.
-
billev at 08:03 AM on 21 July 20192019 SkS Weekly Climate Change & Global Warming News Roundup #27
The current level of atmospheric CO2 has one cubic foot of CO2 distributed over each 2400 cubic feet of atmosphere. That faint presence is having no measureable effect on global air temperature.
Moderator Response:[DB] The radiative physics of greenhouse gases are well established. Please read this post and the comments for edification on your point. Place any related comments there, not here.
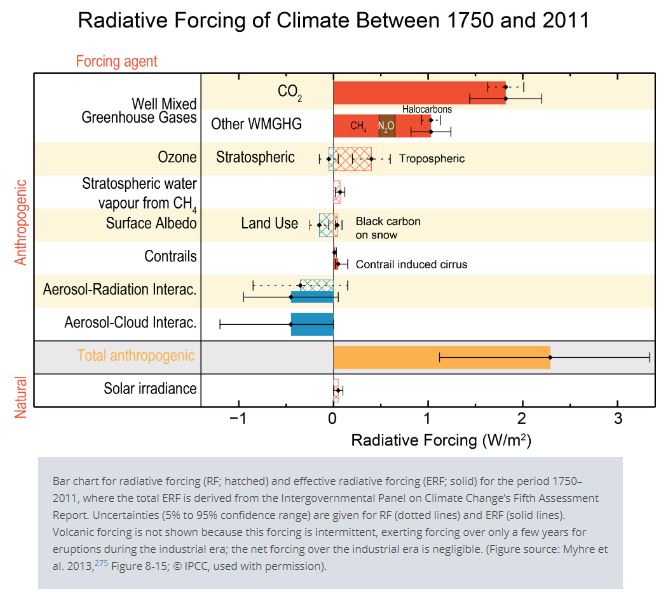
As an FYI, changes in the sun's output falling on the Earth from 1750-2011 are about 0.05 Watts/meter squared.
By comparison, human activities from 1750-2011 warm the Earth by about 2.83 Watts/meter squared (AR5, WG1, Chapter 8, section 8.3.2, p. 676).
What this means is that the warming driven by the GHGs coming from the human burning of fossil fuels since 1750 is over 50 times greater than the slight extra warming coming from the Sun itself over that same time interval.
-
_V_Gun at 07:20 AM on 21 July 201910 things a committed U.S. President and Congress could do about climate change
I'd be interested to know why 'going vegan' isn't No. 1, let alone even listed?
If you're serious about the planet you should not be part of the problem.
-
Rob Honeycutt at 02:02 AM on 21 July 2019Climate science comeback strategies: Al Gore said what?
Marshall119... I believe the key point is that Gore didn't make such a claim.
Even that phrasing "point of no return" is suspect. What would that even mean? What we know is that there are tipping points in the climate system where the climate issue becomes more of a crisis. We certainly don't know where those tipping points are, nor would we know likely for many years after crossing them.
What we do know is that, the harder we push the climate system outside of the normal bounds of the holocene, the more likely we are to create more climate crises. Emissions to date are going to mean bad stuff. At 1.5C it's going to be much worse. 2C will be worse than that. Beyond 2C is outside the bounds of the past few million years and we really don't know how bad it will get nor do we know how much affect we can have on the eventual outcome after that.
"Point of no return" means return to what? The way things were before the industrial revolution? The way things were in the 1950's? ...I don't know. But I do know things will never be the same. We've created an entirely new planet no matter where we go from here. The only rational question would be, how bad will we make it? A 1.5C planet will be a far more inhabitable place than a 3.5C planet.
-
Marshall119 at 16:07 PM on 20 July 2019Climate science comeback strategies: Al Gore said what?
Seems to me the analyses of the comment use straw man responses. The original comment's claims are that 1) Gore predicted a "point of no return" in 10 years, and 2) the apocolypse has been postponed. There's no claim that Gore predicted we'd now be in the middle of a climate apocolypse or that we're not seeing evidence of climate change, as the analyses assert.
None of the strategies address the actual issue: Have we reached the point of no return that Al Gore predicted? If not, then has the point of no return been postponed?
If the answer to the first question is "no", then the comment is entirely correct. Of course "the point of no return" is an oft-used but seldom defined phrase, so perhaps there's argument about what it actually means. I assume it's the 2 deg. increase. If that's still the case, then there is indeed a postponement of Gore's "apocolypse" since since the Oct. UN Special Climate report sets 2030 as the "point of no return".
-
scaddenp at 07:13 AM on 19 July 2019The human fingerprint in the daily cycle
Schmidt is merely building on a long line of other papers and the paper is effectively a "quick a dirty" for the purposes of informing public discussion. From abstract:
"Much of the interest in these values is however due to an implicit
assumption that these contributions are directly relevant for the question of climate sensitivity."ie. it doesnt have a lot of relevance to the practise of climate science. Actual model codes are integrate over all gases and all absorbtion bands simultaneously. They reproduce observations of the radiation spectra with exquisite accuracy. Climate depends on how the system plays as a whole and the individual contributions of the gases in any particular atmospheric composition is of little practical interest.
-
Daniel Bailey at 04:37 AM on 19 July 2019The human fingerprint in the daily cycle
Perhaps you need to broaden and deepen your knowledge of the terminology used in this field, given that it is far outside your area of expertise.
For example, per Lacis et al 2010:“Ample physical evidence shows that carbon dioxide (CO2) is the single most important climate-relevant greenhouse gas in Earth's atmosphere. This is because CO2, like ozone, N2O, CH4, and chlorofluorocarbons, does not condense and precipitate from the atmosphere at current climate temperatures, whereas water vapor can, and does.
Non-condensing greenhouse gases, which account for 25% of the total terrestrial greenhouse effect, thus serve to provide the stable temperature structure that sustains the current levels of atmospheric water vapor and clouds via feedback processes that account for the remaining 75% of the greenhouse effect.
Without the radiative forcing supplied by CO2 and the other non-condensing greenhouse gases, the terrestrial greenhouse would collapse, plunging the global climate into an icebound Earth state.”
https://www.nasa.gov/topics/earth/features/co2-temperature.html
https://www.giss.nasa.gov/research/briefs/lacis_01/
https://www.giss.nasa.gov/research/briefs/schmidt_05/
https://www.nasa.gov/topics/earth/features/vapor_warming.html -
Ddahl44 at 03:30 AM on 19 July 2019The human fingerprint in the daily cycle
Part of my residency training in Emergency Medicine and continuing education involves review of scientific articles of relevance to our specialty including controlled prospective trials, literature reviews, and policy statements. Schmidt’s language, specifically his allocations based on estimated attributions and inferences is quite foreign at least to scientific review in my field. At a minimum it seems somewhat arbitrary, lacks objectivity, allows for author subjective interpretation of data and opens up the potential of bias. This concerns me if this is a go-to reference in the field.
-
SirCharles at 23:53 PM on 18 July 201997% consensus study hits one million downloads!
-
SirCharles at 23:23 PM on 18 July 201997% consensus study hits one million downloads!
Another peer-reviewed study by James Powell:

=> The Consensus on Anthropogenic Global Warming Matters
Moderator Response:[DB] Please reduce image widths below 550 to prevent them from breaking the page formatting.
-
Eclectic at 12:11 PM on 18 July 201997% consensus study hits one million downloads!
One marker of the success of the 97% from Cook et al., 2013 study is that the 97% figure is still causing major heartburn in the foremost ranks of the denialists, some 6 years on. They still recycle their arithmetic fantasies that the 97% ought to be seen as 33% or even 3% .
And they stay completely silent about the part of the study where the self-assessments survey shows a similar 97% .
-
Daniel Bailey at 11:24 AM on 18 July 201997% consensus study hits one million downloads!
How many downloads for Watts' Fall et al paper, again?
-
Bob Loblaw at 10:18 AM on 18 July 201997% consensus study hits one million downloads!
That's an impressive, steady rate of downloads - for an impressive volunteer-driven effort of "citizen science".
Queue the usual arguments that science is not driven by consensus.
Queue the debunking that points out that the paper is direct evidence against the argument that the level of disagreement is large.
-
Doug Bostrom at 06:57 AM on 18 July 201997% consensus study hits one million downloads!
That's a dandy post. This guy John Cook should write here more often. :-)
-
TVC15 at 16:27 PM on 16 July 2019There's no empirical evidence
Geez!
Non-peer-reviewed manuscript falsely claims natural cloud changes can explain global warming
Flawed Reasoning: The authors' argument claims a correlation between cloud cover/relative humidity and global temperature proves that the former caused the latter without investigating whether they have the relationship backwards.
Inadequate support: The source of their claimed global cloud dataset is not given, and no research on their proposed mechanism for climate change is cited.
Fails to provide correct physical explanation: The manuscript incorrectly claims that the rise of atmospheric carbon dioxide is caused by release from ocean waters. It also provides no explanation for the claim that an increase in relative humidity causes global cooling.
KEY TAKE AWAY
Warming related to human activities is estimated to be around 1°C over the past century. This document claims to overturn decades of scientific findings but provides neither the source of the data it uses nor the physics responsible for the proposed relationship between clouds and global temperature. -
TVC15 at 16:08 PM on 16 July 2019There's no empirical evidence
Hi everyone!
I've been away on a vaction and while away I found this news article pop up on my Android.
HomeWorld News Finnish study finds ‘practically no’ evidence for man-made climate change
The human caused climate change deniers are jumping all over this! How can this study be credible?
-
Eclectic at 10:44 AM on 16 July 20192019 SkS Weekly Climate Change & Global Warming Digest #28
Nigelj , the "cosmic ray" article has been headlined as a Breakthrough , per that scrupulously-scientific and just-slightly propagandist organization, the GWPF. Also taken up by ClimateDepot & other bloggy deniosphere sites.
On somewhat tenuous grounds, the academicians at Kobe University etc have suggested that the latest geomagnetic reversal ( 780,000 years ago ) had — via a temporary increase in cosmic ray impingement — produced a variation, for several thousand years, in the Winter Monsoon in North-East Asia (but little effect on the Summer Monsoon).
As yet, I have been unable to see that this localized effect so very long ago, could have more than zero relevance to modern global climate or even the climate of the last 100,000 years. We already have experimental, historical, and paleological evidence that Cosmic Rays have negligible effect on world climate.
The GWPF seems to be scraping the bottom of the barrel, in its ongoing attempts to find a whisker of doubt about mainstream climate science. Not that such attempts are anything new, from the GWPF. As yet, the GWPF's batting rate is steady at Zero.
Moderator Response:[PS] Could any further discussion of this article please go to "it's cosmic rays". Thank you.
Prev 191 192 193 194 195 196 197 198 199 200 201 202 203 204 205 206 Next


