


 Arguments


Recent Comments
Prev 1989 1990 1991 1992 1993 1994 1995 1996 1997 1998 1999 2000 2001 2002 2003 2004 Next
Comments 99801 to 99850:
-
Bibliovermis at 14:16 PM on 30 December 2010We're heading into an ice age
Henry, Try reading the entry you are replying to, including the intermediate version. The increased heat retention from the enhanced greenhouse effect is an order of magnitude larger than the decreased heat from a return to Maunder minimum levels of solar activity. As for "urban records are unreliable", refer to argument #6 which is linked at the top of the left column. -
archiesteel at 14:09 PM on 30 December 2010It's not bad
@Nederland: there is plenty of hyperbole on the denier side, with accusations of planned genocide and conspiracy theories involving a secret cabal of scientists and world government, etc. Considering that hyperbole is enough to convince you of the invalidity of a theory, will the blatant and repeated examples on the denier side turn you off of their position as well? In any case, hyperbole in itself is not a logical fallacy, neither are ad hominem if you don't use them in order to attack someone's credibility. The sentence "2+2=4, you arse!" may be uncouth and rude, but it's mathematically correct... -
archiesteel at 14:03 PM on 30 December 2010Climate sensitivity is low
@BP: "That is, the time constant τ has no effect other than introducing a delay in this case - or an additive constant, if we look at it the other way around. It has no influence on the trend whatsoever." That's nonsense: a delay will in effect raise the temperature of the system, as the sun continues to send energy. Like RW1 and co2isnotevil in another thread, you seem to forget this is a dynamic system, and that power input is constant. -
Henry justice at 14:02 PM on 30 December 2010We're heading into an ice age
The historical record indicates that we are now in a repeat Dalton like minimum (called Landscheidt). This is expected to last through solar cycle 25. However, around 2015 or so, its expected that the solar gauss will fall below 1500. Then the sunspots may wink out completely. It is further predicted that a new Maunder like minimum will then begin. So, global cooling has, in fact,begun and will last most likely for the next 70 or 80 years. See this site: http://www.landscheidt.info/?q=node/61 Also, I checked the worlds annual mean temperature charts. Not much of a visual upward slant in temperatures everywhere I looked world wide for the last 50 years. The urban site temps were not used as they are unreliable. So upward and downward wiggles appear all but natural variations. Look for yourself and you be the judge! See this site:http://www.john-daly.com/stations/stations.html In Greenland, eight WW2 bombers from the "lost squadron" were found in 1986 under 267 feet of ice. How's that for melting glaciers? I didn't take the rest of the article seriously. See this site: http://www.2012online.org/2012research/iceage/ For the new little ice age that's emerging now: see this site: mail.google.com/mail/hl=en&shva=1#inbox/12d1de941be48ea3 -
archiesteel at 14:00 PM on 30 December 2010Did Global Warming stop in
1998,1995,2002,2007, 2010?
@ghornerhb: I counted at least twelve logical fallacies and outright fabrications in your post. Please stop posted well-debunked junk science and unfounded accusations, thanks! -
archiesteel at 13:56 PM on 30 December 2010A Positive Outlook For Clouds
@adrian smits: except the temperature has increased by more than 1/8th of a degree, and it has done so in mostly in the last 50 years (not 150). Right now, the increase (about 0.8C) falls right within the 2.5-4.5C climate sensitivity for a doubling of CO2, a fact no denier has been able to disprove (though many have tried). -
Climate sensitivity is low
Berényi - "Provided of course τ is not larger than several decades" - many of them (the feedbacks) have time constants longer than this. I listed a few (certainly not an exhaustive list) in this post. I'm not a specialist in this field - I'm certain that other feedbacks with fairly long time constants could be added. -
archiesteel at 13:54 PM on 30 December 2010Lindzen and Choi find low climate sensitivity
@co2isnotevil: discussing the reliability of measurements (never mind that different measurements provide pretty much the same picture) is off-topic, and belongs in another thread. Of course, when one makes his own climate simulation tool, one can get all kinds of results. Until your tool has been validated by others, we have now way of knowing how accurate it is. As for your conspiracy theories on publishing scientific papers, they are the hallmark of the pseudo-scientific quack. If your theory is good, it will stand up on its own. The fact that you have yet to publish it makes me think you are simply afraid it will get thoroughly rebutted, and you'd rather keep your very subjective view of the science intact. Sorry. It is up to you to prove what you claim. Right now, we are all a little skeptical about your claims, and with good reason. -
Climate sensitivity is low
Berényi - "satellite lower troposphere temperature anomalies are not reliable either": Please keep in mind that this cuts both ways - if the records are not as reliable as we would like (which you have really not established, mind you), any errors could go in either direction, so claiming temperature measurements are bad (which should be discussed here, really) does not establish that warming isn't happening. -
Berényi Péter at 11:57 AM on 30 December 2010It's not us
#13 muoncounter at 11:33 AM on 30 December, 2010 Not sure why you're mixing your aerosols with your CO2 sensitivity. If you gave a thought to it, you'd be absolutely sure. BTW, the other thread is continued here. -
Berényi Péter at 11:50 AM on 30 December 2010Did Global Warming stop in
1998,1995,2002,2007, 2010?
#57 Albatross at 08:23 AM on 30 December, 2010 There are other issues with your argument, but I have very little patience to deal with misinformers. Vague handwaving when confronted with facts & logic is exactly the kind of behavior characteristic of misinformers, isn't it? Regardless, this thread is not about climate sensitivity, so we should move that discussion to the appropriate thread. That's right. Cont'd here. -
Berényi Péter at 11:40 AM on 30 December 2010Climate sensitivity is low
#57 Albatross at 08:23 AM on 30 December, 2010 under Did global warming stop in1998,1995,2002,2007, 2010? I see that you are failing to differentiate between Charney feedbacks (transient climate response, Gregory and Forster 2005) and equilibrium climate sensitivity. Annan and Hargreaves, and others, show the PDF for EQS dropping off sharply below about 2.5 C. (On moderator's advice discussion started there is continued here) Well, let's suppose there is a first order low pass filter between "forcing" and "climate response" (lower troposphere temperature anomaly). If we apply a small step-like forcing ΔF to a climate system in equilibrium and the long term temperature anomaly response is ΔT = βΔF, than β is said to be the equilibrium sensitivity, right? The impulse response function of the filter in this case is (β/τ)e-t/τ for t > 0, zero otherwise, where t is the time variable and τ is a time constant characteristic to the relaxation time of the system. The response to a step-function is of course β(1-e-t/τ). Now, let's suppose the forcing is increasing linearly with time (instead of kicking in in a step-like fashion). With CO2 more or less this is the case, that is, ΔF = ft, where f ~ 0.006 year-1, if unit of forcing is CO2 doubling. The relation seems to hold pretty well at least during the last 70 years. The response of the low pass filter above to such a forcing is βf(t-τ). That is, the time constant τ has no effect other than introducing a delay in this case - or an additive constant, if we look at it the other way around. It has no influence on the trend whatsoever. Provided of course τ is not larger than several decades, that is, the pre-industrial flat part of the CO2 forcing curve has negligible effect beyond the start of satellite era (late 1978). Therefore my calculation is correct, the climate sensitivity is considerably less than 2°C (per CO2 doubling), for the reasons I've stated in the other thread. BTW, I think it is even lower, because satellite lower troposphere temperature anomalies are not reliable either. Back-calculation of temperature from narrow band radiances depends heavily on the atmospheric model used, especially on fine details of water vapor distribution, which is neither measured nor modeled properly. On top of that all climate variables behave like pink noise even in the unforced case, that is, they have large spontaneous fluctuations on all scales (this is characteristic of systems in a state of self-organized criticality). -
muoncounter at 11:33 AM on 30 December 2010It's not us
From a comment here. "industrial aerosol emissions are mitigated somewhat during the last three decades. Therefore the actual climate sensitivity to carbon dioxide should be considerably less" Not sure why you're mixing your aerosols with your CO2 sensitivity. But if, by mitigated, do you mean that the ongoing increase in the magnitude of annual CO2 emissions of +0.67 Gtons/year worldwide somehow indicates a slowdown? -
co2isnotevil at 11:27 AM on 30 December 2010Lindzen and Choi find low climate sensitivity
archdiesteel, The data comes from isccp.giss.nasa.gov and I plotted the graphs from my climate simulation tool, CSIM, which integrates hierarchically gridded modeling with verification from satellite data, paleo data and a whole lot more, including replicating much of the ISCCP tool chain for processing weather satellite images where I use HITRAN 2008 driven 3-d atmospheric modeling, rather than the simple heuristics used by ISCCP, for extracting equivalent temperatures from IR brightnesses. The data in these plots is directly from the ISCCP processed, D2 data set and not from my processed DX data. I only subtracted out the bias in the first plot, although my analysis of the DX data (after recalibration) for months around where NOAA-14 transitions to NOAA-16 validated the profile of the bias. As I said in a deleted post, Rossow privately acknowledged this error and said it would eventually be fixed. For some reason, this rather large error has never been fixed or put in the errata, even though later reported errors have. I first brought this to his attention over 3 years ago. At the time, I even complained that I had seen some people using his data misinterpret the data anomaly as an anomalous warming trend. It's my understanding that many more are using this data now. New data based on 10 km sampling is supposed to be forthcoming, and I have been told that the error should be fixed, but the new data seems to be delayed. Regarding Biblio's comment. Anomaly analysis increases precision at the expense of accuracy, which is not the right direction to go. The even bigger problem is that you can't discriminate between anomalous data (meaning bad data) and an anomalous trend. The problem here is that the one month big anomaly that arose because of a baseline shift manifests itself as anomalous warming trend. Regarding publishing. Publishing in a 'legitimate' climate related publication is horribly stacked against anyone going counter to the consensus, that's not to say that I don't have a plan ... -
adrian smits at 11:23 AM on 30 December 2010A Positive Outlook For Clouds
Why don't we just look at the record for signs of forcing? Since the end of the last mini ice age we have warmed about 8ths of a degree.Our carbon dioxide has gone up about 50% the last 150 years so we should be seeing half the warming we would get with a doubling of c02.So I am assuming about an additional 8ths of a degree of warming with a full doubling of our c02.This theory assumes no natural variation in our climate and no tipping points either.Lets just pretend they cancel each other out for the sake of this discussion.Some how 8ths of a degree isn't that scary. -
muoncounter at 11:18 AM on 30 December 2010We're heading into an ice age
Hey, those crystals might just align one day. Since you're the one 'in pharmaceuticals', party on, dude! -
Daniel Bailey at 11:03 AM on 30 December 2010We're heading into an ice age
Re: muoncounter (195) Sounds like another variant of Hapgood's crustal displacement mythos. -
witsendnj at 11:01 AM on 30 December 2010How much did aerosols contribute to mid-20th century cooling?
I watched this movie: http://witsendnj.blogspot.com/2010/12/insidious-soup.html about global dimming. Peter Cox of the UK MET office seems to thing it is (still) playing a significant role in suppressing rises in temperature that would otherwise be much higher. My question is: Could it be that (part of) the disparity in warming between the arctic temps and the lower latitudes is due to more global dimming clustered around the equator as opposed to cleaner air around the poles??? I would appreciate any thoughts! thanks, Gail -
Bibliovermis at 11:01 AM on 30 December 2010Did Global Warming stop in
1998,1995,2002,2007, 2010?
Your post is full of many wholly wrong, trite misunderstandings and baseless accusations. If you are interested in improving your knowledge on this general topic, please read through this site and study the primary sources available elsewhere. Please post your questions in their relevant areas and curtail the conspiracy notions. Otherwise, don't bother complaining when the moderator deletes your comments. -
Daniel Bailey at 11:01 AM on 30 December 2010Temp record is unreliable
Re: Rovinpiper (137) Sorry, I no longer work in the Earth Sciences fields. In pharmaceuticals now, living where I want to live instead of doing the work I wanted to do & hating where I was living (Washington, DC). If you want to chat via email, send it to John Cook here at Skeptical Science & he'll forward it to me. The Yooper -
Daniel Bailey at 10:53 AM on 30 December 2010The Hitchhiker’s Guide to the AGU Fall Meeting
Re: Greg While I wasn't there to hear it directly and indeed have only heard about it anecdotally, I applaud you for the courage of your convictions. That is a rare thing in this world we live in. If only more had the stones to do so... I'm minded of the words of Martin Niemöller:"They came first for the Communists, and I didn't speak up because I wasn't a Communist. Then they came for the trade unionists, and I didn't speak up because I wasn't a trade unionist. Then they came for the Jews, and I didn't speak up because I wasn't a Jew. Then they came for me and by that time no one was left to speak up."
Let us go and do likewise. Else the end result be the same. The Yooper -
hurleybird at 10:51 AM on 30 December 2010CO2 lags temperature
Unfortunately, this article is in need of some serious revision -Deglaciation is not initiated by CO2 but by orbital cycles -CO2 amplifies the warming which cannot be explained by orbital cycles alone <---weak reasoning! -CO2 spreads warming throughout the planet These points are about as logical as "collect underpants > ? > profit!", where the '?' here is analogous to the middle point above. Obviously change in orbital cycles alone does not account for all temperature fluctuation, and neither does orbital fluctuations + CO2. There are many feedbacks. As horrible as it may sound, you can't win them all. CO2 may or may not be causing modern day warming, but if you think you can spin the fact that causation is reversed historically into proof that CO2 is causing warming you're delusional. At the least you should provide some further links to back up the middle point, but really what needs to be done is to change the article to concede that yes, historical causation does support the skeptical side, but may or may not be relevant now that CO2 concentration is being altered by humans as well as the carbon cycle. To claim anything more is extremely disingenuous. -
Rovinpiper at 10:49 AM on 30 December 2010Temp record is unreliable
Thanks Yooper, Hey I was at the University of Michigan Biological Station this June and July, and I toured the Upper Peninsula a bit. Do you do research in Michigan? -
muoncounter at 10:44 AM on 30 December 2010We're heading into an ice age
#192: Perhaps this is a reference to the Chile earthquake? If so, the numbers are way out of any realm of possibility. Of course, there have been lots of large earthquakes in recent history; no ice age yet. Here's one that explains why such an axis shift did not, nay, cannot happen. -
ghornerhb at 10:44 AM on 30 December 2010Did Global Warming stop in
1998,1995,2002,2007, 2010?
Ok folks, you do realize all this hyperbole is over less than one degree C of possible temperature variation don't you? Wouldn't that small a rise fall into the "plus or minus" catagory? Records have only been kept for 114 years, so "warmest in recorded history" is rather meaningless! All this is based on one sentence added to the initial IPCC report by UN policymakers (not by the scientists). Even the UN admits the reports are in response to computer simulations, not real world data. Weather satellites and weather balloon data never supported those simulations, yet we now have cottage industries popping up because of all this unsubstantiated "what if" blathering! Al Gore's film was shot down by his main piece of evidence (Vostock ice core samples show 800 year lag from temp rise to CO2 level rise) and by the British courts who ruled there were 9 major flaws in the film (not to mention the large number of prominent scientists counted among the skeptics). As a lay-person, I've been looking at everything presented by both side of the argument. The evidence is supportive of natural climate change (and now would seem to support the possibility of global cooling again). Have none of you AGW proponents been the least suspicious as to why governments are pushing for rules that require massive new taxes so they can "deal" with the so-called "problem?" Do any of you remember the global cooling scare of the 1970's? Many of the same scientists are involved in the current warming debate... Ah well, keep those government grants comming. They would dry up without some life threatening problem that needs decades of research!Moderator Response: Your claims have already been addressed elsewhere on this site. Please review this site's list of skeptic arguments or use the search function and place your individual comments in the appropriate thread. Future off-topic posts will be deleted per the comment policy. -
Daniel Bailey at 10:43 AM on 30 December 2010Back from the Dead: Lost Open Mind Posts
Thanks to all for the kind words. This index is for all of you. If there are any favorites, please save them for off-line perusal, as relying upon the Archives to always find them is a bit like storing your computer files in the "to be deleted" bin. As to the actual reasons for the limbo status of the posts, others have commented already. Not my place to offer up further on that. If anyone finds any of the posts between August 2008 and March 2010 let me know so I can append them to this index. I delved as deeply into the Archives as is possible, I believe (I found about a dozen more posts than the Archive search function did). -
Eric (skeptic) at 10:43 AM on 30 December 2010We're heading into an ice age
There are lots of scientists who study and monitor the shape of the earth. Here is an example: http://geodesy.unr.edu/ There is no mention by them of any sudden changes in 2010. -
Albatross at 10:43 AM on 30 December 2010It's cooling
BP @93, "about 25% of its supposed increase in 55 years (since 1955)" And the 0-2000 m OHC decreased by that about amount in two months in early 2006. Yet, the long-term trend is up my friend. Funny how you ignore that fact. And worse still, I know that you know better BP. Also, please make up your mind. Earlier on this thread you correctly stated that the planet is warming and that TCR is about 2 C, now you seem to be trying to suggest that the warming is an artifact of an alleged faulty data record. -
Bibliovermis at 10:37 AM on 30 December 2010We're heading into an ice age
Don't worry. You are one hundred percent wrong. Please read up on Milankovitch cycles and solar variability, and how the increased heat retention from enhancing the greenhouse effect overwhelms it. Do you have a reference for the orbital tilt claim? -
wonderingmind42 at 10:36 AM on 30 December 2010The Hitchhiker’s Guide to the AGU Fall Meeting
Andy, Volume too loud--agreed wholeheartedly. Attacks on AGU: That's what prompted me to post a hasty and again-too-high-volume "open letter" the Friday night after, trying to get in front of the story trying to prevent the echo chamber (seeded by Steven Mosher, reposted several other blogs) from painting the AGU as activist, using the brush of my personal actions. Having listened to my speech again since then (don't know if you heard, but I had exactly 11 hours to prepare it due to a HD crash at 1 am), I think it doesn't justify the mega-ness of my mia culpa. I was desperate to avoid being used against AGU, hadn't listened to the speech since I gave it, and couldn't remember the text beyond the first wild-eyed paragraph. Having since transcribed it (available at www.gregcraven.org), I stand by the message. My only regret is that it was so strongly given that I'm sure it turned off many of the people who most needed to hear the message. I was indeed intending to shock--and even risk pissing off--but ended up pretty much slapping people in the face. Like a face slap to a roomful of absorbed, focused people in a burning building, it pisses off most of them, but a few of them say "thank you for waking me up to the larger threat" and get moving. That's my hope, anyway. Staring at the text finished just minutes before I went on stage, I was faced with the choice of giving it, or just winging it, which I could have ably done (I do it regularly when my lessons plans are rendered moot by some occurrence at the tardy bell). I made a conscious decision about which regret I'd rather risk: regretting that I'd gone too far, or regretting that I had my one chance to speak to the people that are our last realistic hope, wishing I had said more. I chose the former, and don't regret it. Especially since it seems the contrarian attempt to damage the AGU using me seems to have not gotten any traction. Hope this helps. And I'd humbly suggest that before making such a strong yet simplified assessment--especially when agreeing with an attack article that deliberately distorts and manipulates ("the face of the new AGU," "the first step to violent action," leaving his own misstatements about what I said--even when notified--rather than actually quoting the speaker)--that you closely read the posting you are agreeing with. If you've already done that and still think that telling your readers you agree with Steven Mosher (comprising 30% of your assessment of the session) is what you really intend to convey, then perhaps you might want to consider whether skepticalscience.com is the place that is the best match for your opinions. It's one thing to say I was a shameful spectacle, and quite another to agree with the contents and tone of Mosher's article, which you link to. I'd suggest that your readers perhaps deserve better. Respectfully, Greg Craven -
Nick Palmer at 10:34 AM on 30 December 2010A Positive Outlook For Clouds
Dana1981 #2 Ahh. Most popular descriptions of the greenhouse effect give the strong impression that the H20 molecule has a stronger greenhouse effect than the CO2 molecule - like CH4 (methane). I don't remember seeing it clarified elsewhere that H20 has, although a weaker greenhouse gas, a bigger effect due to its much greater abundance. The various Wiki articles make this less than clear too. -
muoncounter at 10:32 AM on 30 December 2010It's not bad
" Here's some hyperbole to match yours"
Moderator Response:[PW] Muoncounter, this link is now dead. You may wish to update it
-
ppkuio at 10:13 AM on 30 December 2010We're heading into an ice age
For the future of human kind I hope I am 100% wrong to what follows : 1.The earth , as shape , is not one PERFECT sphere , therefor every minor change of axis would result in a change of the solar radiation absorbed . 2.One such change of 1,5 degrees took place in 2010 . 3.The result was indeed a more vertical positioning of the equator towards the sun which leads to a temperature raise for the sea water in the equators . 4.By that the amounts of vapors has raised together with warm air streams that makes vapor clouds to lift higher so when they are above europe or north america they freeze spontaneusly due to the contact of lower atmospheric temperatures (in the atmosphere higher= colder )giving them heavy snowings we observe lately. As a result of all the above we may consider the ice age has started this winter ,the sky will keep on showering snow untill everything will be covered by it and when I am talking covering I mean 300 metres of ice throughout the northen hemisphere above longitude 40 . This was the short resume of my thoughts on the actuall climate problem.What frightens me the most is the fact that glacial periods apear with a strict periodicity , so the argument of one astronomical event taking place as a regulator of their appearance and disappearance is not to be discussed !!!! And apparently this took place this year .....Moderator Response: [Daniel Bailey] Please be so kind as to provide linked references for those (ahem) "unusual" claims. Or be taken for a troll-bot. Thanks! -
Anne-Marie Blackburn at 09:59 AM on 30 December 2010Back from the Dead: Lost Open Mind Posts
Thank you Daniel - brilliant stuff. -
archiesteel at 09:53 AM on 30 December 2010Lindzen and Choi find low climate sensitivity
@George White: where did you get these graphs? They do not seem to agree with any temperature graphs out there (including NOAA's). Perhaps you made them yourself, and have failed to spot an error in your calculations? Why not have your theories published and peer-reviewed, if you are so adamant about being right? -
Bibliovermis at 09:44 AM on 30 December 2010Lindzen and Choi find low climate sensitivity
That is one of the reasons why anomaly plots are used instead of absolute temperature plots, precision vs accuracy. -
co2isnotevil at 09:32 AM on 30 December 2010Lindzen and Choi find low climate sensitivity
Bibliovermis, Do you know the difference between an anomaly plot and a temperature plot? This is a temperature plot.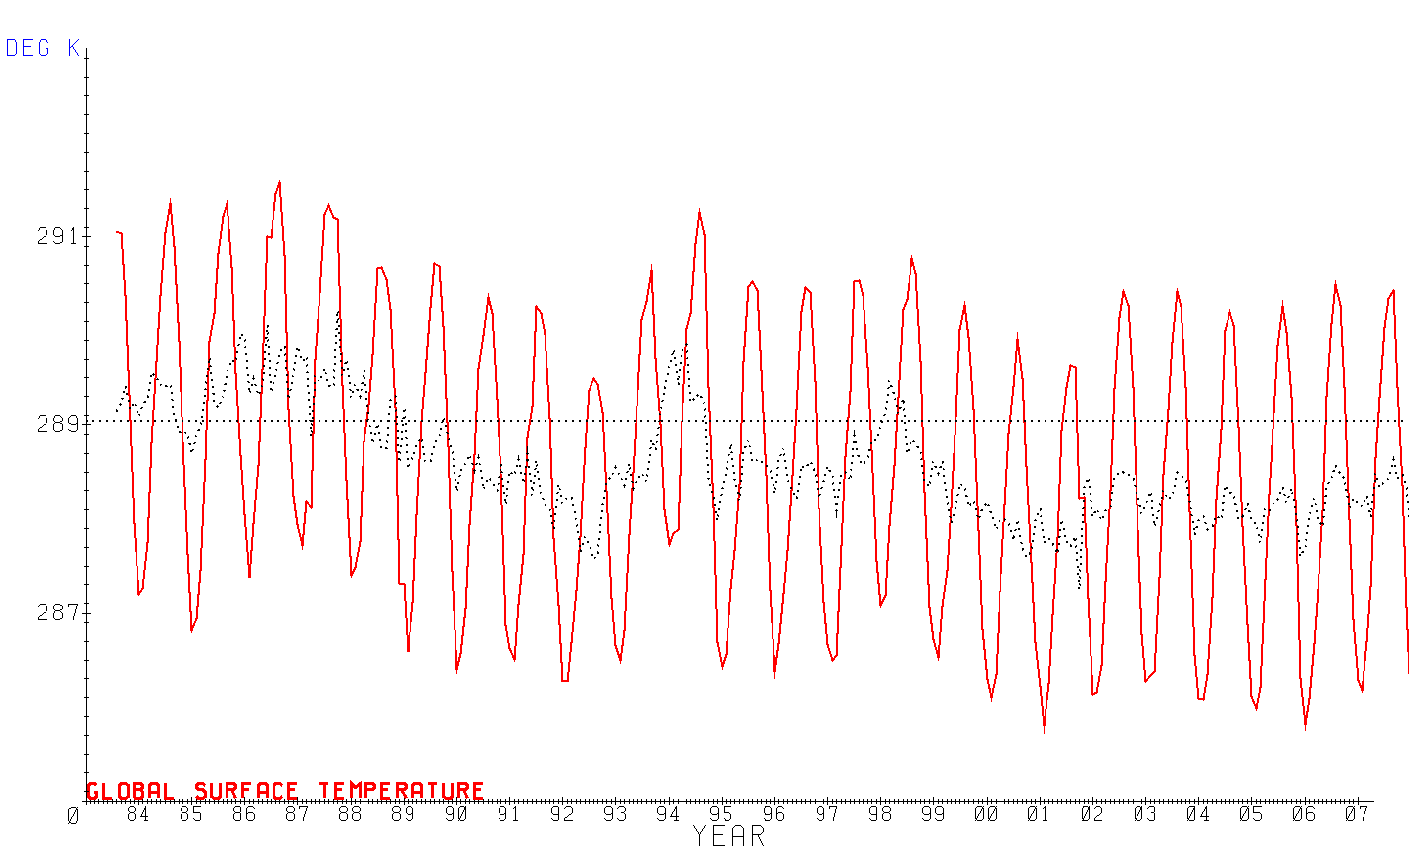 Notice the scales on the left. The actual data spans more than a 5C range and has no averaging applied. An anomaly plot shows the difference in the monthly average to the expected monthly average for that month. The limits of this are only about 1C over the same interval. In my plots, the dotted black line is the running 12-month average.
The actual data from Nasa looks like this,
Notice the scales on the left. The actual data spans more than a 5C range and has no averaging applied. An anomaly plot shows the difference in the monthly average to the expected monthly average for that month. The limits of this are only about 1C over the same interval. In my plots, the dotted black line is the running 12-month average.
The actual data from Nasa looks like this,
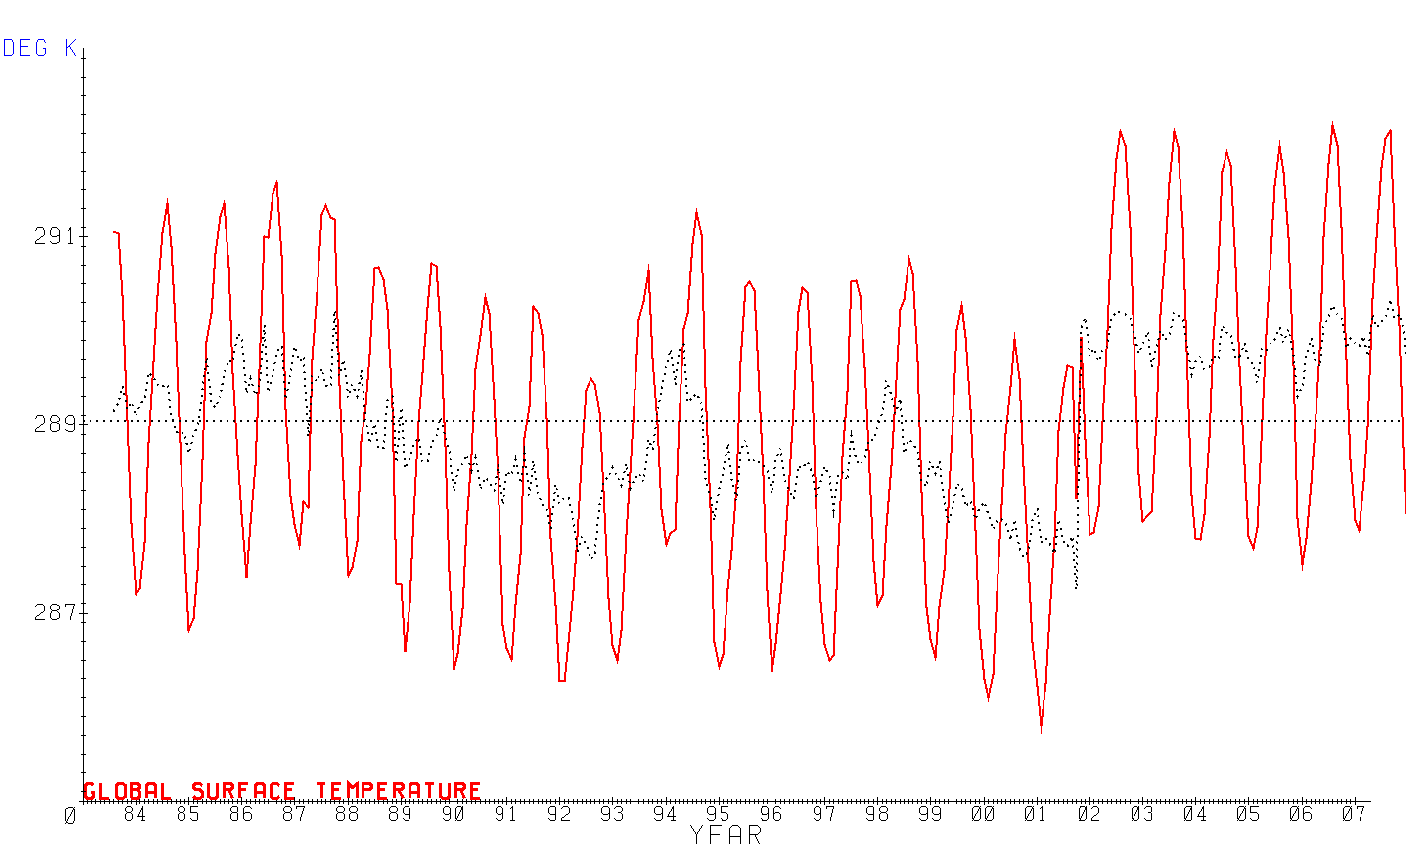 Notice the discontinuity around 2001? This is when NOAA-14 was replaced by NOAA-16 and baseline shifted by about 2C and which I have corrected in my data. The calibration error would be misinterpreted in an anomaly plot as an anomalous warming trend, but is actually representative of a data anomaly. This is my issue with anomaly analysis. You can't distinguish between a data anomaly and an anomalous trend.
-
Bodo at 09:25 AM on 30 December 2010Back from the Dead: Lost Open Mind Posts
Thank you very much, I have long searched for Taminos old post! I would also like to know why they were deleted from his blog, I have never read something about this in his blog. -
archiesteel at 09:24 AM on 30 December 2010It's cooling
@Chris: Bibliovermis pretty much said it all. Your friend believes things that are false, and bases all of his argument these falsehoods. His response is therefore insufficient. This is how you can respond, if you want to (it seems as if he is politically opposed to AGW theory, and as such is unlikely to be open to a rational scientific argument): 1. The greenhouse effect was discovered in th 19th century and has been validated numerous time since. The burden of scientific proof is therefore on those claiming it doesn't exist. 2. That position is wrong on two counts, i.e. that 7 or even 10 years is a sufficient period to establish statistical relevance, AND that temperature have been stable since 2000 or decreasing since 2003. Here is a graph showing the 15, 10 and 7 year trend (again, the last two being statistically not significant to the 95% degree):3. The IPCC models never predicted steady warming. He has to prove that assertion, or it is irrecievable. 4. As him where that (presumably) peer-reviewed evidence is. Insist on this very simple truth: there is virtually no evidence supporting his position, and a mountain of evidence supporting yours. It's a safe claim to make, as it is completely true (you can find such evidence here). 5. Again, that is an unproved assertion. Ask him for serious peer-reviewed evidence supporting this idea. Remember, the burden of proof is on him, not you. 6. That is an unfounded conspiracy theory. Offer to sell him a tinfoil hat. 7. The IPCC still has the confidence of the scientific community. Most people not trusting the IPCC were already against it, and their opposition is for the most part political. In any case, the IPCC is a reflection of the scientific consensus. Attacking the IPCC is rather meaningless in this regard, as it relies on actual climate science for its position and publications. 8. If anyone is acting in a fanatical manner, it is those who continue to decry AGW theory even after being presented with the strong evidence supporting it. They often repeat the same debunked talking points. In fact, by clearly failing to understand the science while entertaining all kinds of conspiracy theories, they are akin to a modern version of the European medieval flat Earthers. 9. The ICCC was a sham, and very few serious climate scientists attended (if any). It was organized by the Heritage Institute, which is not a scientific body but a highly-politicized conservative think tank. In other words, it is an institution that does not seek to discover the truth, but rather to spread a conservative agenda that unfortunately considers scientific evidence to be less important than political ideology. 10. The media ignored the results of the conference because it was a sham, and an obvious one at that. For a so-called "skeptic," your friend seems to trust what conservatives say about climate change a little too much. Hopefully this is on-topic enough; in any case, I won't add anything to this unless it specifically deals with points 1 to 5.
-
Berényi Péter at 09:18 AM on 30 December 2010It's cooling
Hey, you keep digging up this Schuckmann graph, although I have told you it was unbelievable.Re: Response to #54TomJones at 01:56 AM on 6 August, 2010 : The source is von Schuckmann 2009:
Figure 2: Time series of global mean heat storage (0–2000 m), measured in 108 Joules per square metre.Now I'll give you something to believe. I'm just one hundred and one, five months and a day.' 'I can't believe that!' said Alice. 'Can't you?' the Queen said in a pitying tone. 'Try again: draw a long breath, and shut your eyes.' Alice laughed. 'There's no use trying,' she said 'one can't believe impossible things.' 'I daresay you haven't had much practice,' said the Queen. 'When I was your age, I always did it for half-an-hour a day. Why, sometimes I've believed as many as six impossible things before breakfast.
Some more practice is needed perhaps. That way one could eventually believe between december 2006 & february 2007 OHC went up by 8.15×10⁷ J/m2. That's about 3×10²² Joules in just two months, about 25% of its supposed increase in 55 years (since 1955). -
Nederland at 09:09 AM on 30 December 2010It's not bad
#91: You asked for examples of hyperbole and I gave you one. If you look back at my original post you'll see I never said anything about hyperbole in peer reviewed papers, so I'm not exactly sure why you insist that I look only in the "actual research" for examples. I'm talking about people in the field making statements that in my opinion are hyperbole, regardless of venue. For example, when James Hansen says that CEOs of energy companies "should be tried for high crimes against humanity and nature" I would call that an example of hyperbole. The fact that he did not make the statement in a peer reviewed paper is irrelevant. He is a scientist in the field making statements that are non-scientific and arguably designed solely to garner press. Link to Hansen Statement: High Crimes Now, if you want to talk about why I believe that our understanding of climate sensitivity is insufficient to justify drastic action on climate change right now, I'll be happy to limit my links to actual research (or at the very least, links to sites like Real Climate that discuss actual research). -
Phila at 08:52 AM on 30 December 2010Did Global Warming stop in
1998,1995,2002,2007, 2010?
Nederland: Phila: Thank you for pointing out the etymology of the word hysteria, I was unaware of it. In the future I think I'll use the word hyperbole. Would you find that acceptable? Sure, provided it's accompanied by clear evidence that justifies its use. As others have pointed out, such evidence should also be presented on the appropriate thread. Thanks for asking! -
rhpflieger at 08:42 AM on 30 December 2010A Positive Outlook For Clouds
Supposing that Lindzen is correct and the low level cloud cover eventually is sufficient to limit the increase in global warming, what are the consequences? If that occurs what will be the additional changes in the global weather. Doesn't the additional cloud cover reduce the sunlight reaching the earth, and will more flooding occur due to increased rainfall. According to NOAA, the temperature anomaly in the Arctic is already +5 degrees Centigrade. This warming in the Arctic has been linked to changes in the Jet Stream and the resulting (selective) cooling of the US and Europe. According to NOAA so far this year, January through November, the combined land and sea temperatures are the highest on record. When the temperature stops increasing how bad will it be? -
Bibliovermis at 08:25 AM on 30 December 2010It's cooling
#1: Wholly incorrect. It was intially discovered in the 19th century; Tyndall, Arrhenius, et al. That initial was repeatedly validated in the early-mid 20th century. #2 & 3: Wholly incorrect. Refer to argument #4 & 7, and the recent blog article. #4: Wholly incorrect. Consult the argument list. #5: Wholly incorrect. Strength of belief does not overturn published & independently validated empirical research. #6 & 7: Wholly incorrect. Neither do vast conspiracy notions. #8: Wholly incorrect. Dismissing a empirical field of scientific endeavour as a religion only serves to show pridefully ignorant the respondent is. #9 & 10: The ICCC (1st & 2nd) was a dog & pony show staged by a well-known professional disinformation outfit. Their previous work includes "tobacco is harmless" back in the 90s. -
It's cooling
Chris, You can investigate each of these claims on this site's own List of Skeptic Arguments. There is also a good index of common claims here. Be warned that your discussion with this person is likely to devolve into an endless Gish Gallop. It is the argument style of choice for those who have no interest in understanding what they are discussing, but have formed a conclusion anyways. If so, you are likely just wasting your time, as he is not really interested in hearing what you have to say. FYI, the Second International Conference on Climate Change is sponsored by the Heartland Institute, a libertarian think tank that is explicitly political in its goals. As such, it is an extremely poor source for objective science. Likewise, the claim that the conference includes "the world's best climatologists" is self-described, and thus should be taken with a very large grain of salt. As for the general credibility of these "130 scientists," the fact that they signed their names to a set of demonstrably false (and quite old) talking points is enough to toss their credibility out the window. -
Albatross at 08:23 AM on 30 December 2010Did Global Warming stop in
1998,1995,2002,2007, 2010?
BP @56, "Therefore the actual climate sensitivity to carbon dioxide should be considerably less than 2°C. Simple as a wood wedge." I see that you are failing to differentiate between Charney feedbacks (transient climate response, Gregory and Forster 2005) and equilibrium climate sensitivity. Annan and Hargreaves, and others, show the PDF for EQS dropping off sharply below about 2.5 C. There are other issues with your argument, but I have very little patience to deal with misinformers. Perhaps someone else more patient than I will do so. Regardless, this thread is not about climate sensitivity, so we should move that discussion to the appropriate thread.Moderator Response: Yes, please do move to a more suitable thread. -
Dick Veldkamp at 07:54 AM on 30 December 2010The Hitchhiker’s Guide to the AGU Fall Meeting
Andy S @ 8 Thanks very much for your clarifying post. I completely agree with your points 3 and 4. -
Chris3699 at 07:47 AM on 30 December 2010It's cooling
@archiesteel: I passed on your response to the person I'm talking to and this was his response: "Recently, 130 German scientists wrote an open letter to their government. They made the following points: 1.Information known before the IPCC was founded shows that human CO2 emissions have no measurable effect on global warming. 2.The atmosphere has not warmed in the last 10 years and has cooled significantly since 2003. 3. The expensive IPCC climate models predicted steady warming but the opposite has occurred. 4. Growing evidence continues to show human CO2 plays no measurable role in climate change. 5. If all fossil fuels were burned, the additional long-term warming would not exceed a few tenths of a degree. 6.The IPCC has been aware of this fact but has completely ignored it. 7. As a result, the IPCC has lost its scientific credibility. 8. The belief in manmade climate change has become a pseudo-religion. 9. The Second International Conference on Climate Change in NY March 2009 was attended by approximately 800 leading scientists, some of whom are among the world’s best climatologists. 10. The media has virtually ignored the results of this Conference. " You can read the entire open letter here: http://climatephysics.com/2010/09/19/open-letter-to-the-chancellor-of-germany-by-130-scientists/ -
Berényi Péter at 07:40 AM on 30 December 2010Did Global Warming stop in
1998,1995,2002,2007, 2010?
"The overall trend from 1979 through November 2010 (Brown line) shows an unmistakable rise." Yes, the trend line from december 1978 to november 2010 (inclusive), that is, for the last 32 full years is 1.4°C/century. You can access the UAH TLT (lower tropospheric temperature) data here: ftp://ghrc.nsstc.nasa.gov/pub/data/msu/t2lt/tltday_5.3 and check this claim. You can also access carbon dioxide mixing ratios measured at the Mauna Loa Observatory here: ftp://ftp.cmdl.noaa.gov/ccg/co2/trends/co2_mm_mlo.txt From november 1978 to november 2010 it has increased from 333.76 ppmv to 388.59 ppmv. That's 22% of a doubling. Therefore on face value the data would indicate a climate sensitivity of 2°C (per doubling of CO2). This is at the low end of IPCC projections. However, in 1978/79 the world was just coming out of the mid-century cooling. On top of that, in the first half of this 32 years long period (the satellite era) there were two major volcanic eruptions (El Chichón, 1982 & Pinatubo, 1991), while in the second half of it there was none.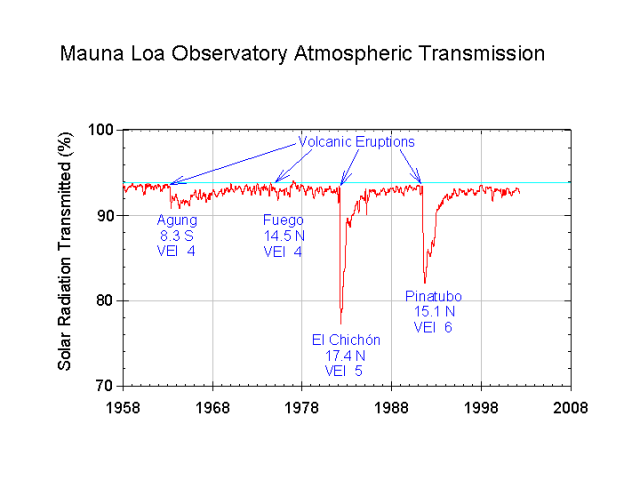 Also, with all the clean air acts in Europe & the US (and with the 1989-92 collapse of the Eastern block with its unregulated smokestacks, of course) industrial aerosol emissions are mitigated somewhat during the last three decades.
Therefore the actual climate sensitivity to carbon dioxide should be considerably less than 2°C. Simple as a wood wedge.
Also, with all the clean air acts in Europe & the US (and with the 1989-92 collapse of the Eastern block with its unregulated smokestacks, of course) industrial aerosol emissions are mitigated somewhat during the last three decades.
Therefore the actual climate sensitivity to carbon dioxide should be considerably less than 2°C. Simple as a wood wedge.
-
Albatross at 07:38 AM on 30 December 2010Back from the Dead: Lost Open Mind Posts
Steve @9, It (indirectly) had something to do with the actions of a certain vindictive contrarian/"skeptic".
Prev 1989 1990 1991 1992 1993 1994 1995 1996 1997 1998 1999 2000 2001 2002 2003 2004 Next


